Satellite Detects Record Pacific Sea‑Level Rise, Signaling Strong 2026 El Niño
Satellites warn a mysterious warm Pacific water swell could trigger a far bigger 2026 climate shock than expected.
NOAA announced on June 11 that sea‑surface temperatures in the central and eastern equatorial Pacific had stayed at least 0.5 °C above normal for several months, crossing the threshold for an official El Niño declaration. The confirmation came after a series of satellite observations showed a massive heat reservoir building beneath the ocean’s surface.
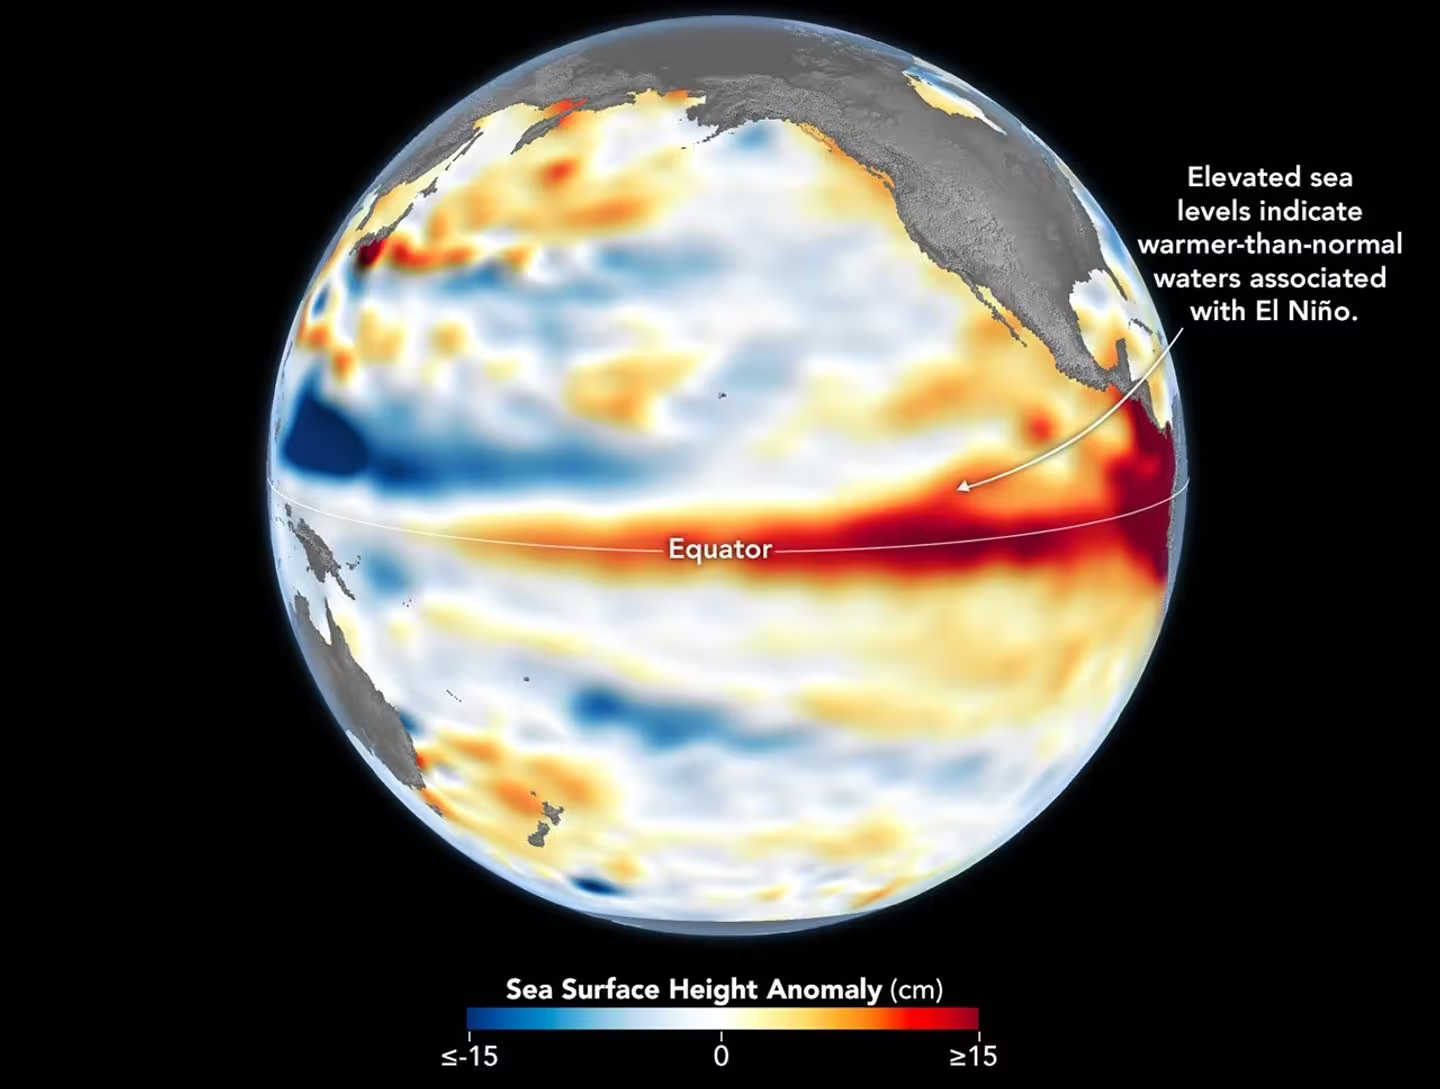
Three days earlier, a satellite orbiting the Pacific recorded sea‑surface heights that were more than 15 centimetres higher than average across a broad swath of the equatorial region. The anomaly, captured by the Sentinel‑6 Michael Freilich platform, signaled that warm water was already piling up deep below the surface, a signal that temperature‑only measurements cannot provide.
Why Ocean Height Beats Surface Temperature for Forecasting
When water warms, it expands and lifts the sea surface, turning height changes into a proxy for the amount of stored heat. A thin, warm skin layer may have little impact, but a deep, voluminous heat pool drives the atmospheric shifts typical of El Niño, such as jet‑stream displacement, altered storm tracks, and extreme precipitation far from the Pacific basin.
Launched in 2020 under a NASA‑ESA partnership for the Copernicus programme, Sentinel‑6 Michael Freilich surveys global sea level every ten days with millimetre‑scale accuracy. Its continuous coverage complements the sparse network of buoys and surface sensors, delivering a comprehensive view of how heat moves across ocean basins.
NASA’s Jet Propulsion Laboratory highlights that one of the mission’s primary goals is to track Kelvin waves—fast‑moving pulses of warm water that transport heat from the western Pacific toward the east in the months preceding an El Niño. By measuring sea‑surface height, the satellite captures these waves in ways that stationary instruments cannot.
Mechanics of Kelvin Wave Propagation
Kelvin waves originate when the prevailing trade winds in the far western equatorial Pacific weaken or briefly reverse. Under normal conditions, easterly winds push warm water westward; a reversal lets the stored warmth surge eastward.
As the wave advances over weeks, it deepens the warm layer, lowers the thermocline, and curtails the upwelling of cold water that usually moderates temperatures along the Americas’ Pacific coasts. Repeated wave events over several months can eventually deliver enough heat to the shores of Colombia, Ecuador and Peru, sparking a full‑blown El Niño.
JPL’s analysis recorded a modest Kelvin wave near Micronesia in late January that faded by mid‑February, followed by a larger pulse that set out in early March. By mid‑May, sea‑level anomalies off Peru had risen more than 5.9 inches above the long‑term mean, and additional waves were still en route in early June, indicating that the heat transfer was ongoing.
“While this year’s event started a bit later than the big El Niños of 2015 and 1997, it’s beginning to catch up,” noted Josh Willis, sea‑level researcher at JPL and project scientist for Sentinel‑6 Michael Freilich. “We’ll see how big it gets.”
June 8 Snapshot Mirrors 1997’s Early Signals
The June 8 sea‑surface height map attracted attention because the western Pacific patterns resembled those observed in the same period of 1997, a year that produced one of the strongest El Niños on record.
Severine Fournier, deputy project scientist for Sentinel‑6 Michael Freilich, cautioned that the eastern Pacific lagged behind the 1997 benchmark, with fewer Kelvin waves evident by that calendar date. Nonetheless, her outlook shifted in the days before NOAA’s official call. “For now, it looks like it’s going to be a big one, more so than I would have said last week, but we still need more observations to know what’s going to happen,” she explained in a NASA Earth Observatory report.
The magnitude of an El Niño influences weather far beyond the tropical Pacific. Moderate events, such as those of 2018 and 2023, mainly generated drought and flooding within the Pacific region. In contrast, the 2015‑2016 El Niño triggered drought across parts of Africa and severe flooding in California, illustrating how a larger heat reservoir can reshape global precipitation patterns.
El Niño typically peaks between November and January, so several more months of oceanic data will clarify how far the 2026 episode will develop. As Fournier summarized in a JPL release, “Every El Niño is different. But they almost always make for a hot year and big changes in rainfall in parts of the globe.”
Sentinel‑6 Michael Freilich now serves as the reference platform for global sea‑level monitoring, continuing a record that began with the 1992 launch of TOPEX/Poseidon. Its successor, Sentinel‑6B, lifted off in November 2025 and is slated to assume full responsibility by the end of 2026, ensuring an uninterrupted ocean‑height dataset for future climate assessments.
This article has been fact checked for accuracy, with information verified against reputable sources. Learn more about us and our editorial process.
Last reviewed on .
Article history
- Latest version
Reference(s)
- “Elnino Sen6 20260608.” <https://assets.science.nasa.gov/dynamicimage/assets/science/esd/eo/images/iotd/2026/el-ni%C3%B1o-is-underway/elnino_sen6_20260608.jpg?w=1440&h=1090&fit=clip&crop=faces%2Cfocalpoint>.
- Dauphin, Lauren. “El Niño Is Underway - NASA Science.”, June 18, 2026 NASA <https://science.nasa.gov/earth/earth-observatory/el-nino-is-underway/>.
- Laboratory, Jet. “NASA-European Sea Level Mission Homes in on El Niño.” NASA Jet Propulsion Laboratory (JPL) <https://www.jpl.nasa.gov/news/nasa-european-sea-level-mission-homes-in-on-el-nino/>.
Cite this page:
- Posted by Divya Iyer