Ancient Indian Ocean Chart Decoded: How Sailors Mapped 180 Islands Without Modern Tools
Researchers decode a 200‑year‑old London scroll that once guided sailors through the Red Sea and Gulf of Aden, revealing its hidden navigation method.
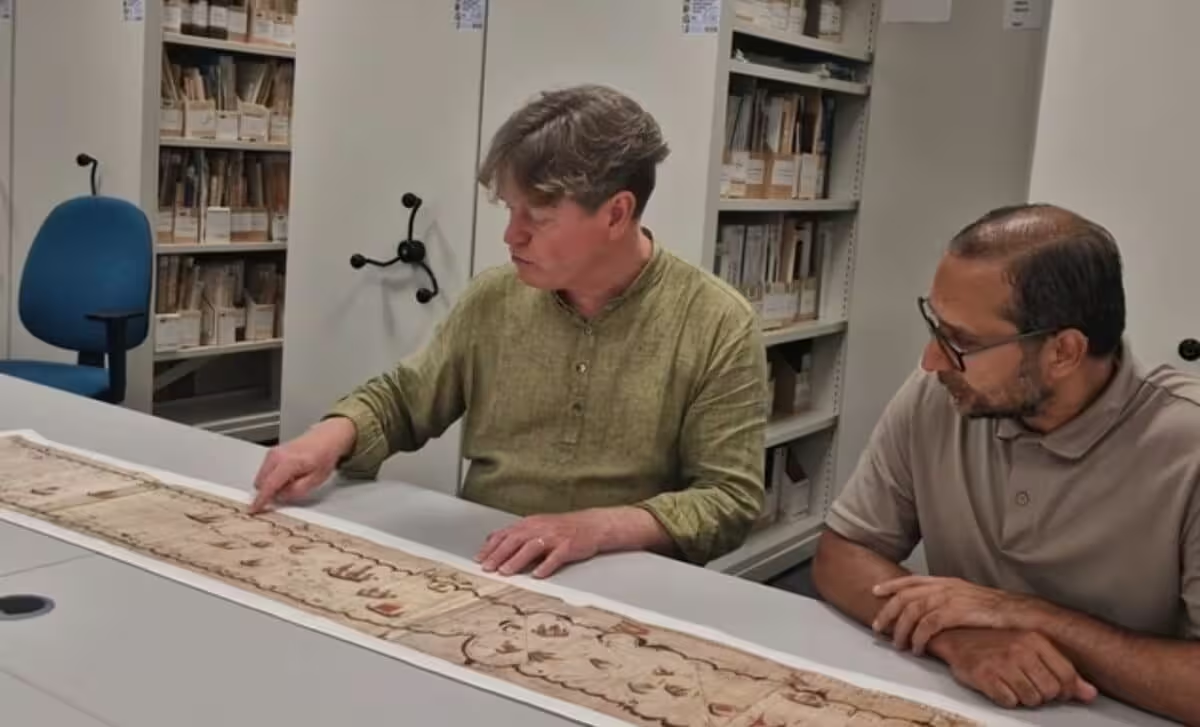
For nearly two centuries the Royal Geographical Society has housed a remarkable seafaring chart that offers a rare glimpse into the pre‑modern trading routes of the Indian Ocean. Researchers from the University of Exeter describe it as one of the most comprehensive surviving examples of indigenous navigational mapping, illustrating how merchants and sailors linked India, the Arabian Peninsula and the Horn of Africa long before European instruments dominated the seas.
Memory‑Based Navigation Revealed
The parchment, written in a Kachchhi or Gujarati script, dates to the late 1700s or early 1800s. In 1835 a young East India Company officer named Alexander Burnes purchased the scroll from an unidentified captain at Kachch and later presented it to the Royal Geographical Society. Burnes, fresh from a celebrated 1832 Central Asian expedition that produced a bestseller and earned him an audience with King William IV, praised the artifact as an unparalleled example of naval surveying, though he mistook it for a decorative item rather than a functional tool.
Subsequent examinations in 1947, 1987, 2002, 2012 and 2022 failed to recognise the chart’s practical purpose. Scholars were confounded by its unconventional geometry, assuming that it omitted latitude and longitude entirely and misreading its distorted depiction of the Red Sea and Gulf of Aden as a flaw. Recent research overturns those assumptions, arguing that the deliberate distortion made the scroll compact and easier to consult while at sea.
Decoding the Ancient Map
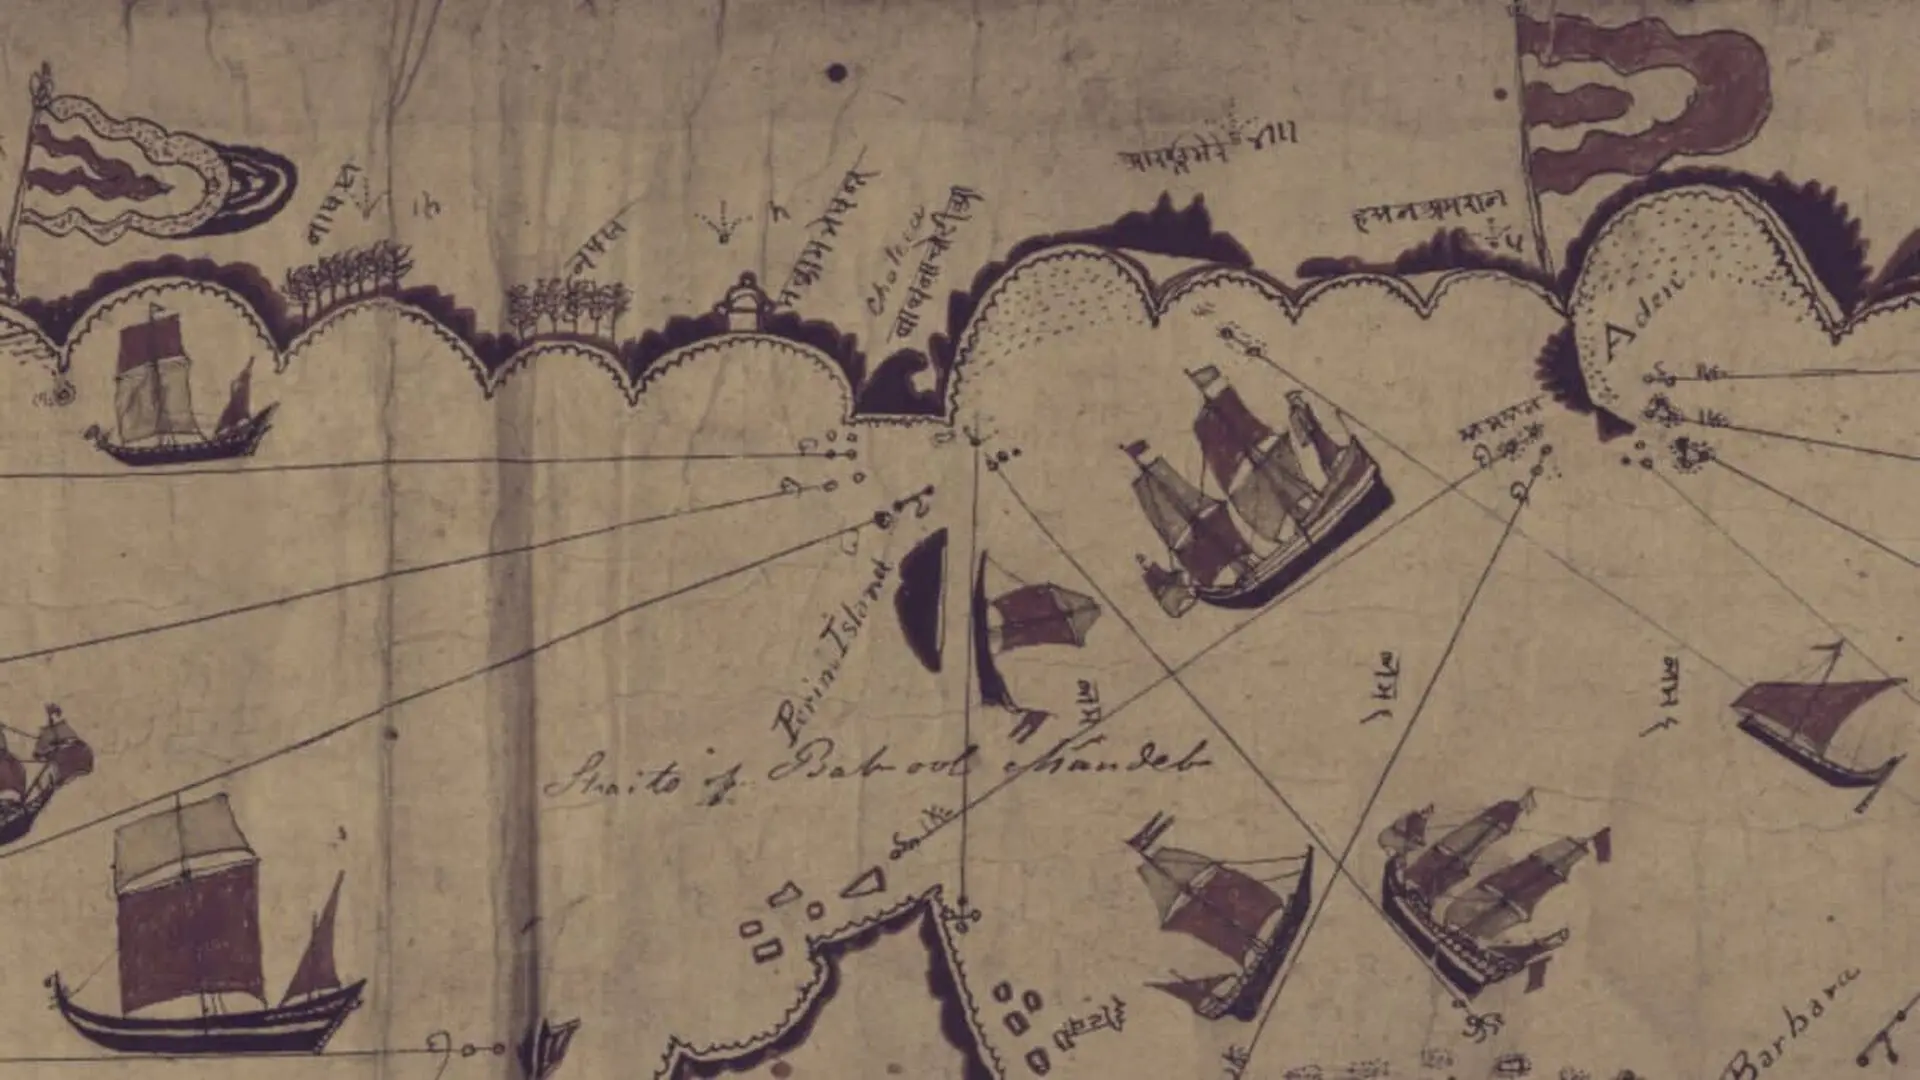
A team led by Professor John Cooper at the University of Exeter’s Institute of Arab and Islamic Studies has now pinpointed coordinates for all sixty‑six place names and produced a clearer transcription of the Devanagari annotations. Their reconstruction translates the scroll’s spatial logic into a modern projection, revealing more than one hundred and eighty islands, reefs, landmarks, religious structures and flags that once guided mariners.
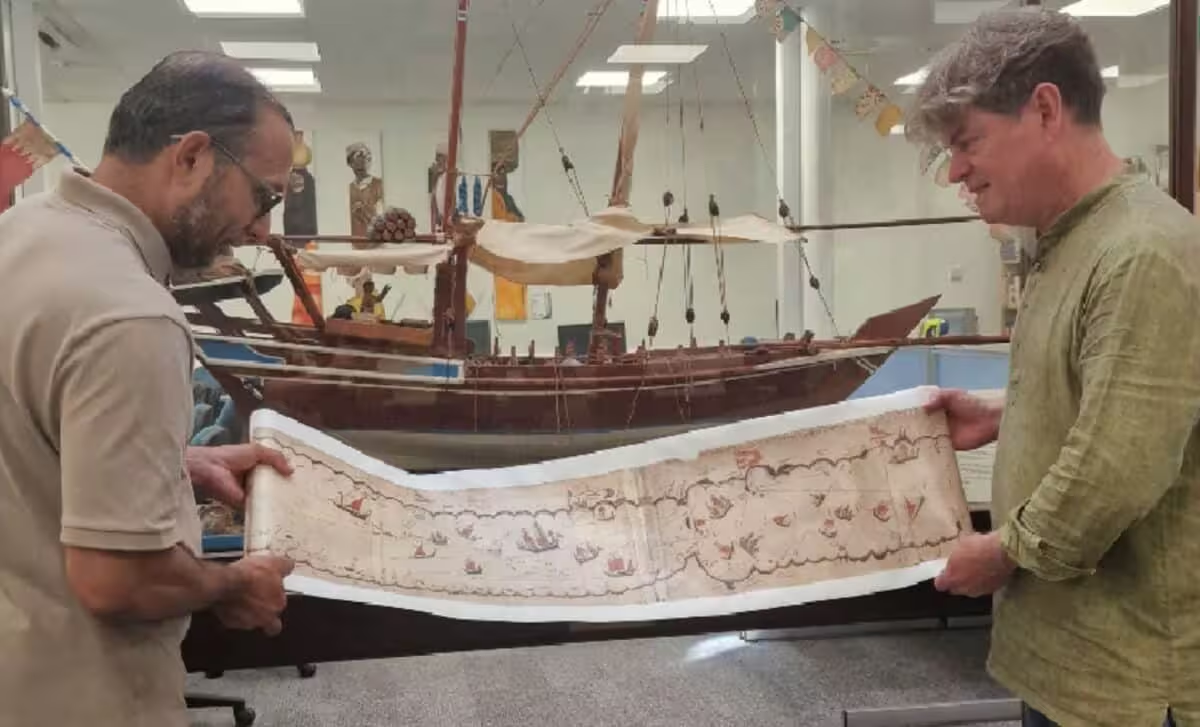
The scholars identified twenty‑nine rhumb lines that served three distinct roles: outlining the general shape of coastlines, charting courses across open water, and, in at least two cases, marking safe approaches to harbours. Although the map would not meet today’s cartographic precision standards, Cooper explains that it supplied seasoned sailors—who already mastered stellar navigation—with all the information needed to negotiate some of the world’s most demanding maritime passages, all compressed onto a scroll only twenty‑five centimetres wide.
Cooper describes the document as a sophisticated navigational aid, combining astronomical data for latitude determination with a dense network of place names and topographic cues for positional fixes. The inclusion of Islamic motifs suggests the creator’s Muslim background, while the depicted flags likely indicate centres of trade and political authority. Rather than a teaching manual, the scroll functioned as a memory supplement for experts, allowing a navigator to unfurl only the relevant segment while keeping the remainder neatly stowed aboard.
Dr. Katherine Parker, who manages the Royal Geographical Society’s cartographic collections, notes that the fresh analysis demonstrates how applying contemporary methodologies can reshape our understanding of historic artifacts. She adds that the project deepens insight into the chart’s geographical, cultural and technical importance, as well as the skill of the seafarers who relied on it centuries ago.
This article has been fact checked for accuracy, with information verified against reputable sources. Learn more about us and our editorial process.
Last reviewed on .
Article history
- Latest version
Reference(s)
- “Discovery.” <https://experts.exeter.ac.uk/456-john-p-cooper>.
- <https://ies.sas.ac.uk/people/katherine-parker>.
Cite this page:
- Posted by Divya Iyer