NASA Satellite Captures Pacific Tsunami With Hidden Wave Layers, Challenging Forecasts
NASA satellite’s rare high‑resolution view of a Pacific tsunami reveals unexpected wave behavior, reshaping earthquake rupture dynamics.

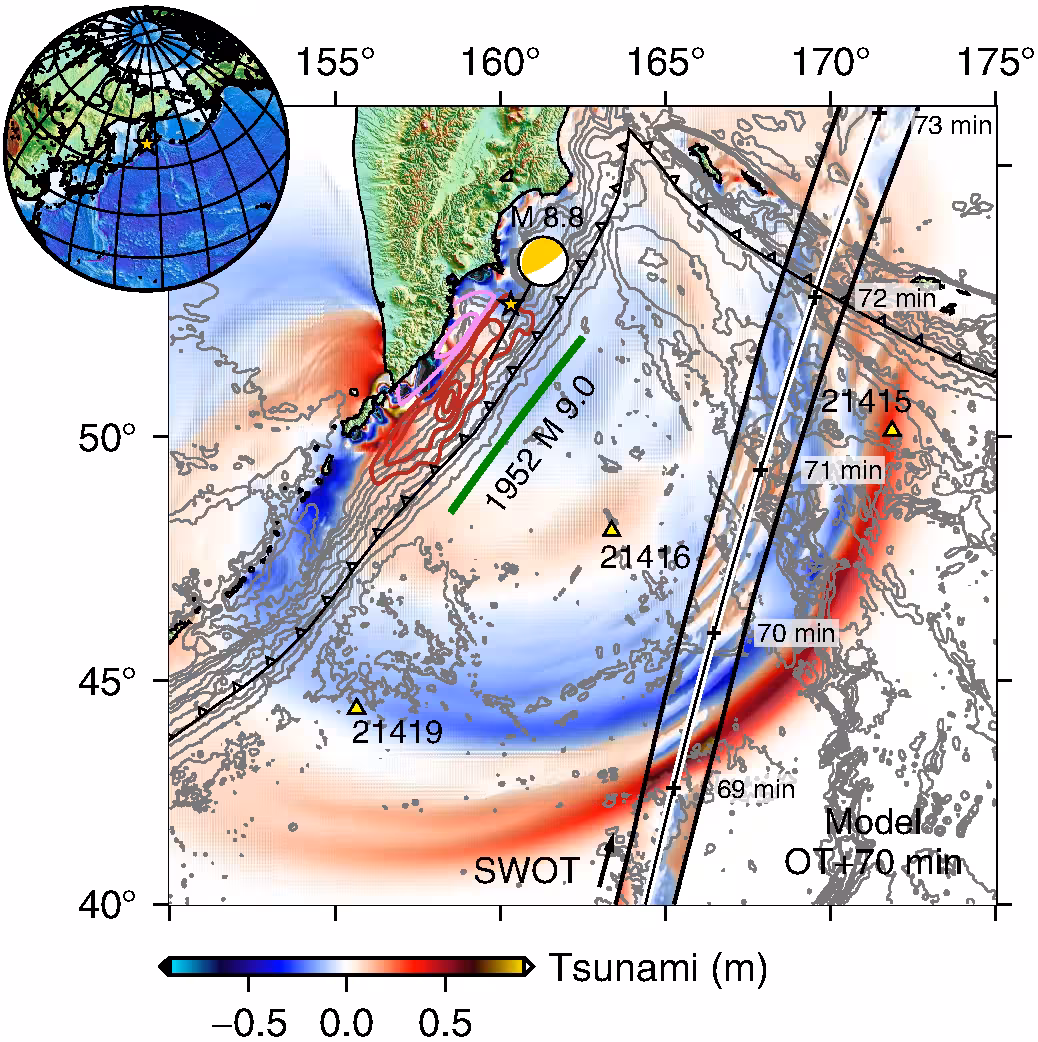
A magnitude‑8.8 earthquake beneath Russia’s Kamchatka Peninsula on 29 July unleashed a Pacific‑crossing tsunami that has forced scientists to rethink how ocean waves behave on a planetary scale. New analysis published in The Seismic Record shows that a NASA Surface Water and Ocean Topography (SWOT) satellite captured the event in unprecedented detail, revealing wave structures that contradict long‑standing assumptions about tsunami propagation.
Satellite Swath Provides a Planet‑Wide View of the Tsunami
The tsunami generated by the Kamchatka quake traveled across one of Earth’s best‑instrumented ocean basins, yet traditional monitoring networks could only sample it at isolated points. At the crucial moment, SWOT was positioned to sweep a continuous 120‑kilometre‑wide swath of the sea surface, delivering a coherent picture of the wave as it spanned hundreds of kilometres.
Lead author Angel Ruiz‑Angulo of the University of Iceland likens the satellite data to “a new pair of glasses.” He explains that previous DART buoys offered only point measurements, while earlier satellites traced a thin line across a tsunami at best. “Now we can see a broad, high‑resolution slice of the sea surface,” he says.
This extensive view let researchers track not just the leading crest but also the internal architecture of the tsunami. The wave displayed layered patterns that evolved during its journey, suggesting interactions among multiple components that had never been observed on this scale.
Unexpected Alignment Gives Researchers a Global‑Scale Laboratory
The SWOT mission, primarily intended to map surface water, was not designed to capture catastrophic geophysical events. Yet the satellite’s orbit coincided with the Kamchatka disturbance, providing a full‑scale record of one of the century’s largest earthquakes. Prior to this, the team had spent over two years analysing SWOT data for subtle ocean features such as eddies and currents, never anticipating a mega‑tsunami capture.
“We had been analyzing SWOT data for over two years understanding different processes in the ocean like small eddies, never imagining that we would be fortunate enough to capture a tsunami,” the authors note.
The continuous swath allowed scientists to merge satellite observations with deep‑ocean DART buoy data, producing a multi‑layered view of the tsunami’s evolution across the Pacific basin.
Wave Dispersion Forces a Rethink of Tsunami Modeling
For decades, large tsunamis have been treated as non‑dispersive waves, meaning every part travels at the same speed. SWOT data, however, revealed subtle dispersion: different components of the wave moved at slightly different velocities, creating a more intricate internal structure behind the main crest.
“The SWOT data for this event has challenged the idea of big tsunamis being non‑dispersive,” Ruiz‑Angulo says. Comparative modeling showed that simulations incorporating dispersion matched the satellite record far better than traditional, purely non‑dispersive approaches.
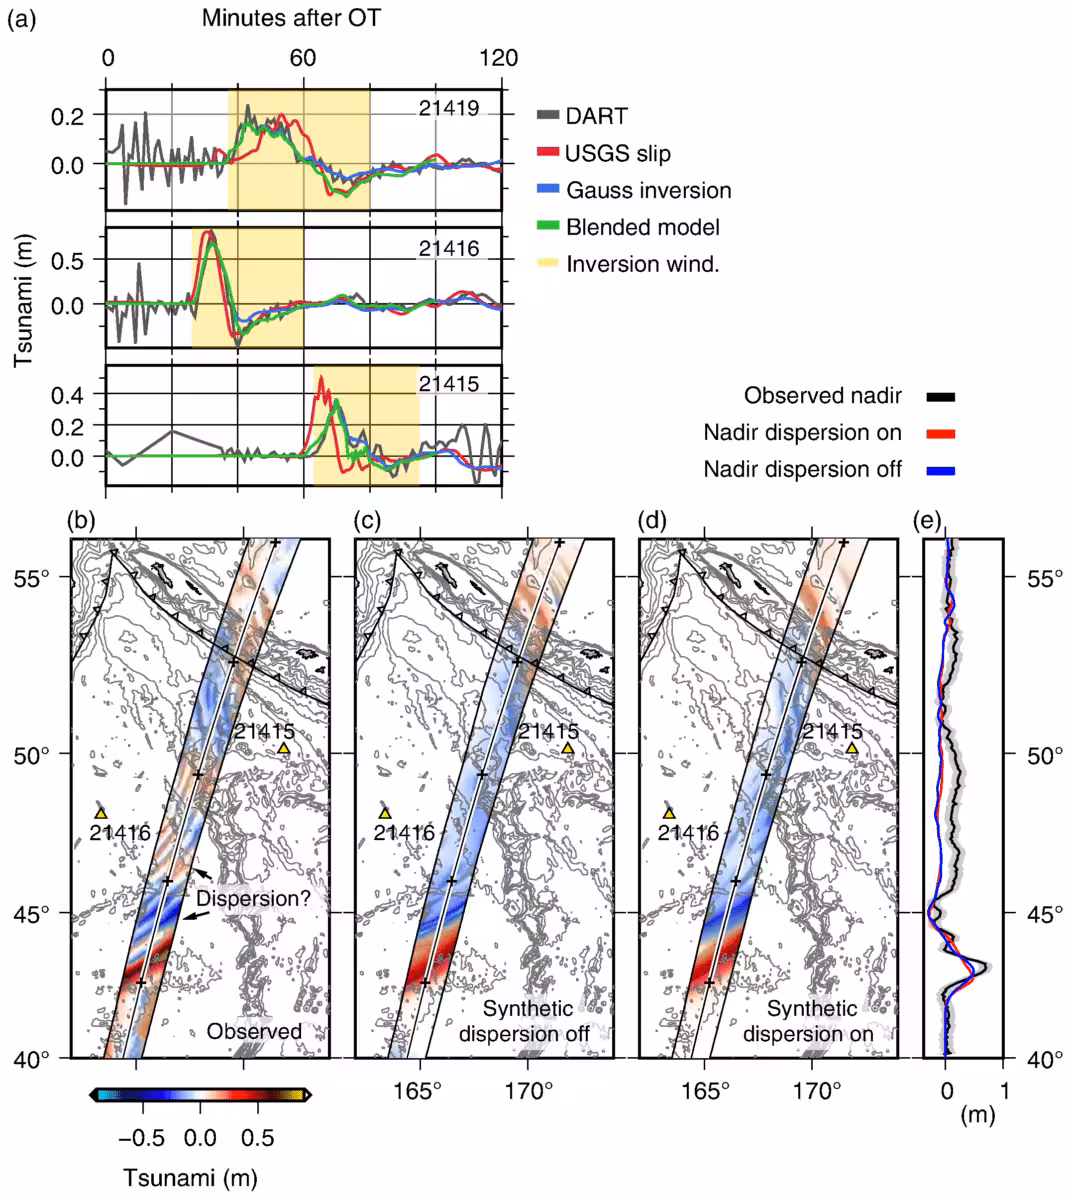
The authors caution that current forecasting tools may overlook this “extra” variability, which could modulate the main wave as it nears coastlines. Quantifying the dispersive energy could refine impact predictions for future events.
Tsunami Signals Reveal a Larger Earthquake Source
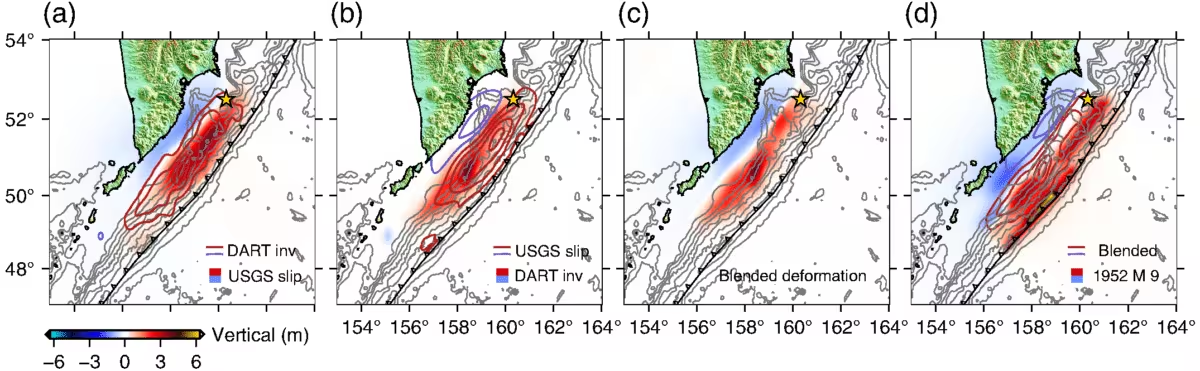
By comparing arrival times at DART buoys with model forecasts, researchers identified inconsistencies that hinted at a more extensive rupture than seismic data alone suggested. Some buoys recorded earlier arrivals, while others showed delayed signals, indicating uneven energy release along the fault.
Inversion of the tsunami data produced a revised fault geometry stretching roughly 400 km—significantly longer than the previously estimated 300 km. This broader rupture length implies a wider distribution of seismic energy across the subduction zone.
The study echoes insights from the 2011 Tōhoku‑oki event, where tsunami observations were crucial for mapping shallow slip. Together, these cases underscore the growing importance of ocean‑based measurements in refining earthquake science, especially where land‑based seismology may miss critical details.
This article has been fact checked for accuracy, with information verified against reputable sources. Learn more about us and our editorial process.
Last reviewed on .
Article history
- Latest version
Cite this page:
- Posted by Vikram Desai