Surprise Driver Behind Human Metapneumovirus Seasonality Revealed
A nearly two-decade analysis shows that co-circulating respiratory syncytial virus dictates transmission cycles rather than local weather.

Human metapneumovirus, a major driver of severe respiratory illnesses, is heavily influenced by respiratory syncytial virus (RSV) activity rather than local weather patterns, according to a 2026 study. Researchers tracked laboratory surveillance records spanning nearly two decades from 2008 to 2025 across 10 distinct regions of the United States to untangle what dictates the seasonal timing and spread of the pathogen.
The investigation, published in PLOS Pathogens, reveals that population-level viral interference from RSV plays a decisive role in shaping the transmission dynamics of human metapneumovirus, commonly known as HMPV. While weather variables such as temperature, precipitation, and humidity govern the seasonality of many respiratory viruses, mathematical modeling showed they failed to explain the unique transmission cycles of HMPV on their own.
Unraveling the Spatiotemporal Spread of HMPV
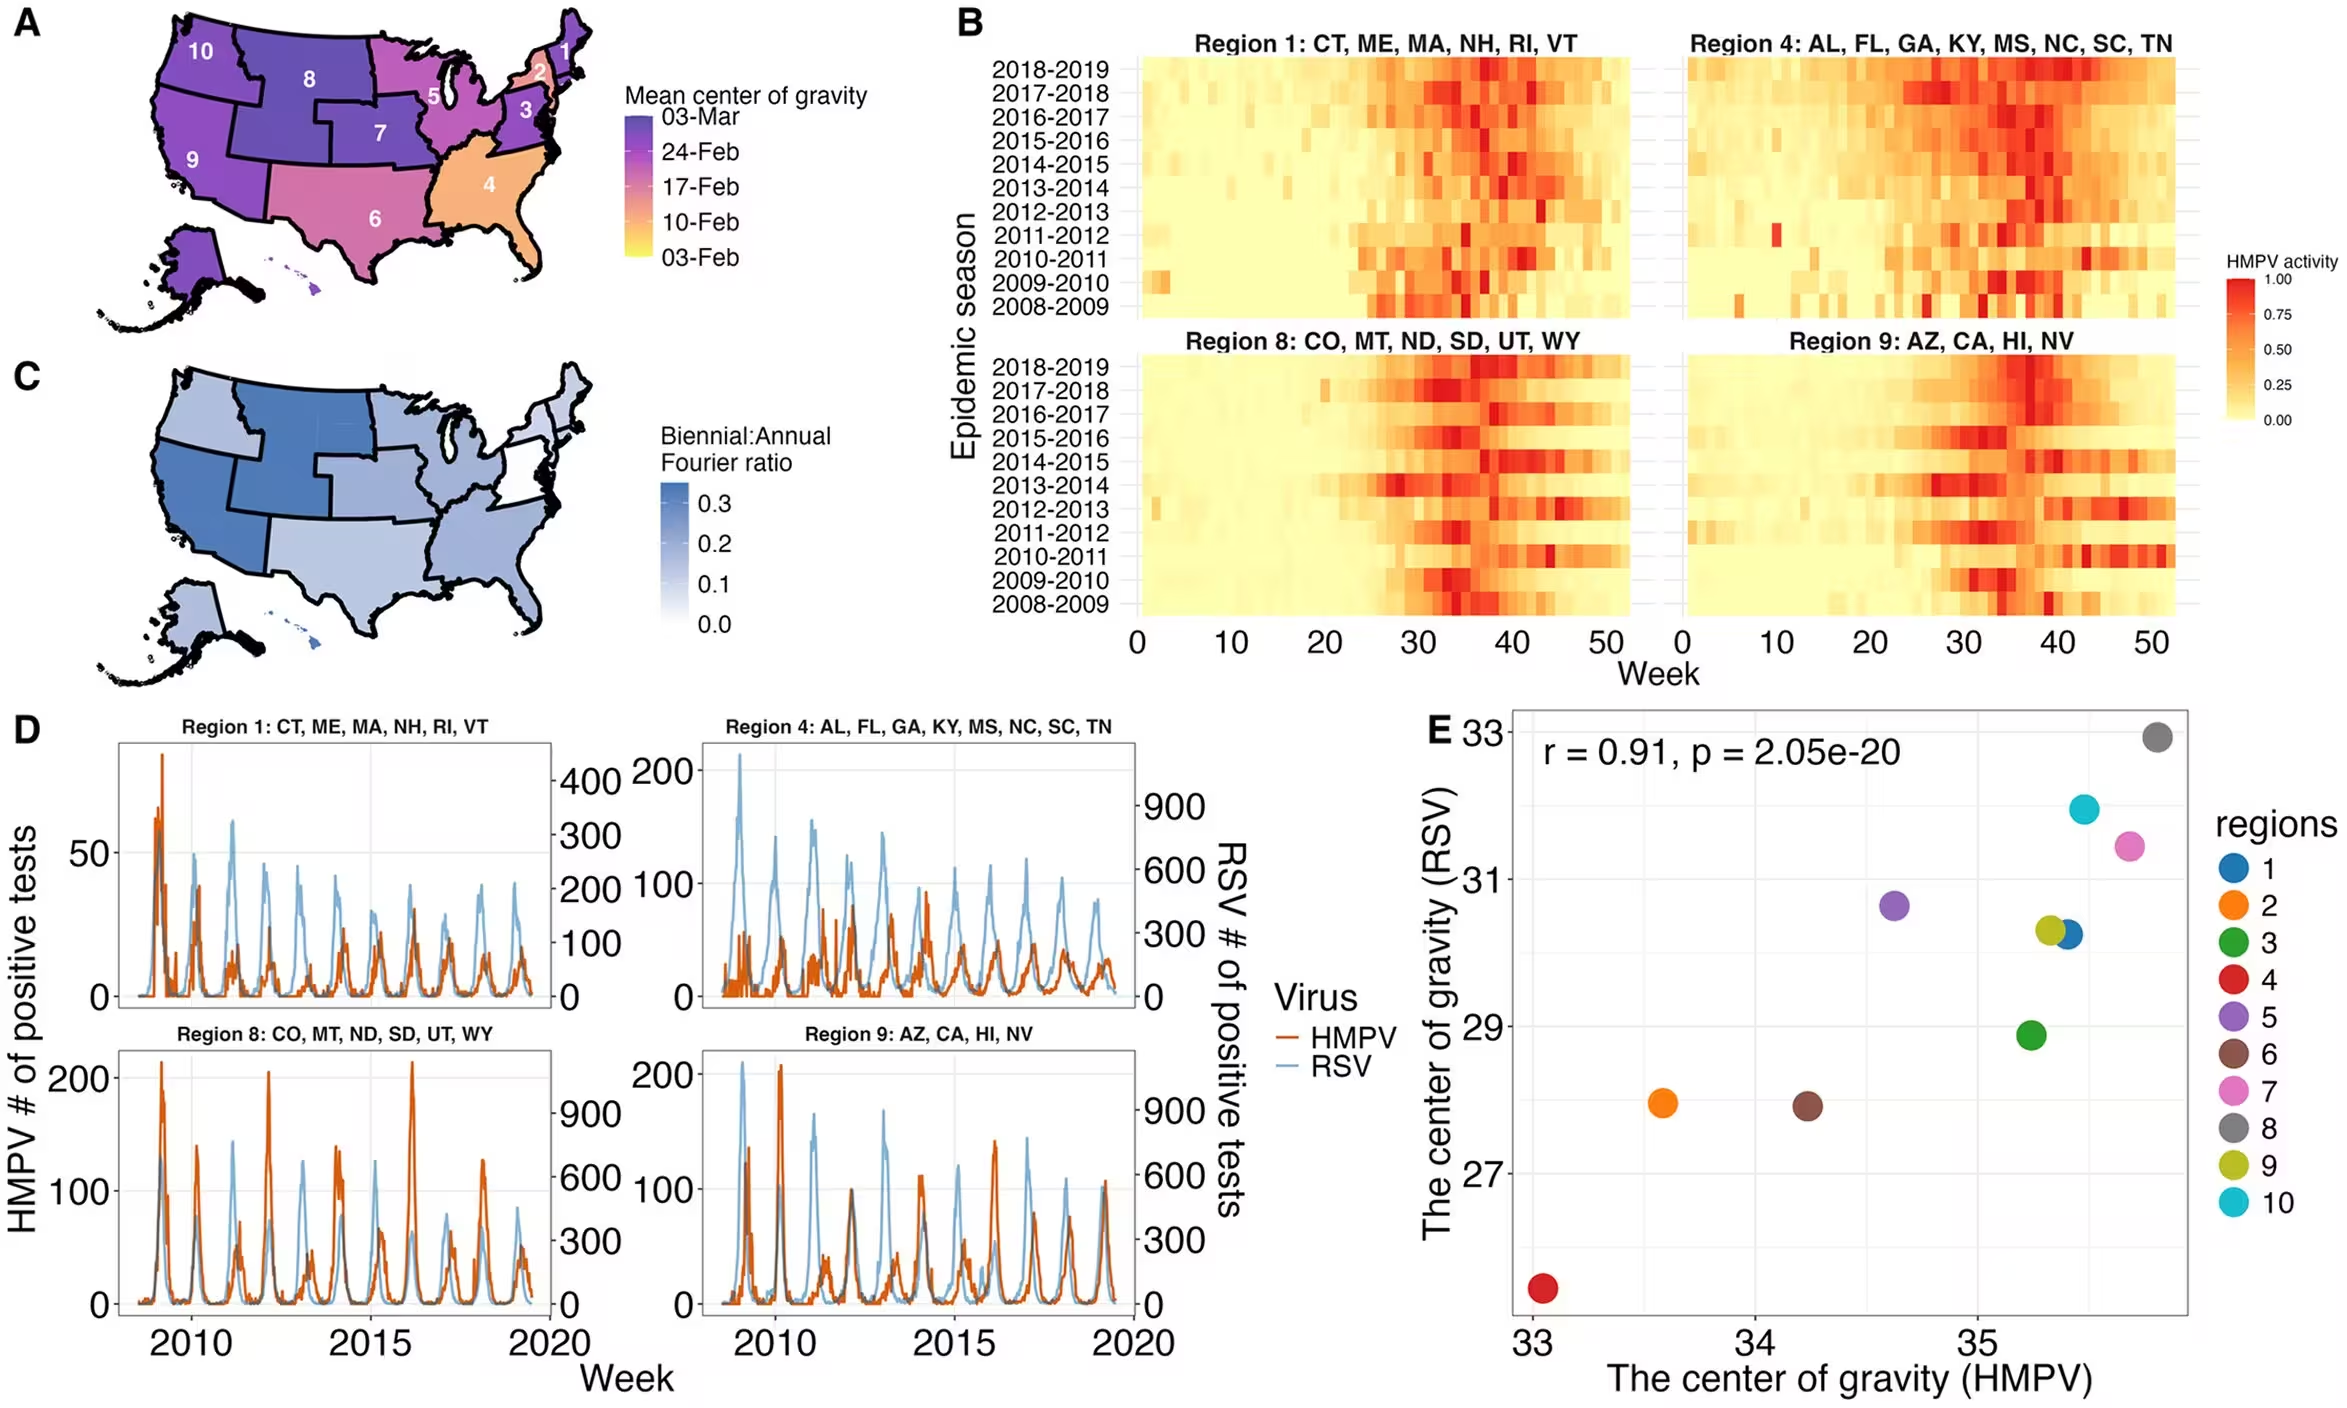
Led by scientists from Yale University and other institutions, the research team analyzed weekly laboratory-confirmed positive tests across 10 regions defined by the U.S. Department of Health and Human Services. Before the COVID-19 pandemic disrupted seasonal norms, HMPV outbreaks exhibited a reliable annual rhythm, typically peaking during late winter and early spring. The geographic spread moved systematically across the country, starting as early as February in the southeastern United States and arriving by early March in the upper Midwest.
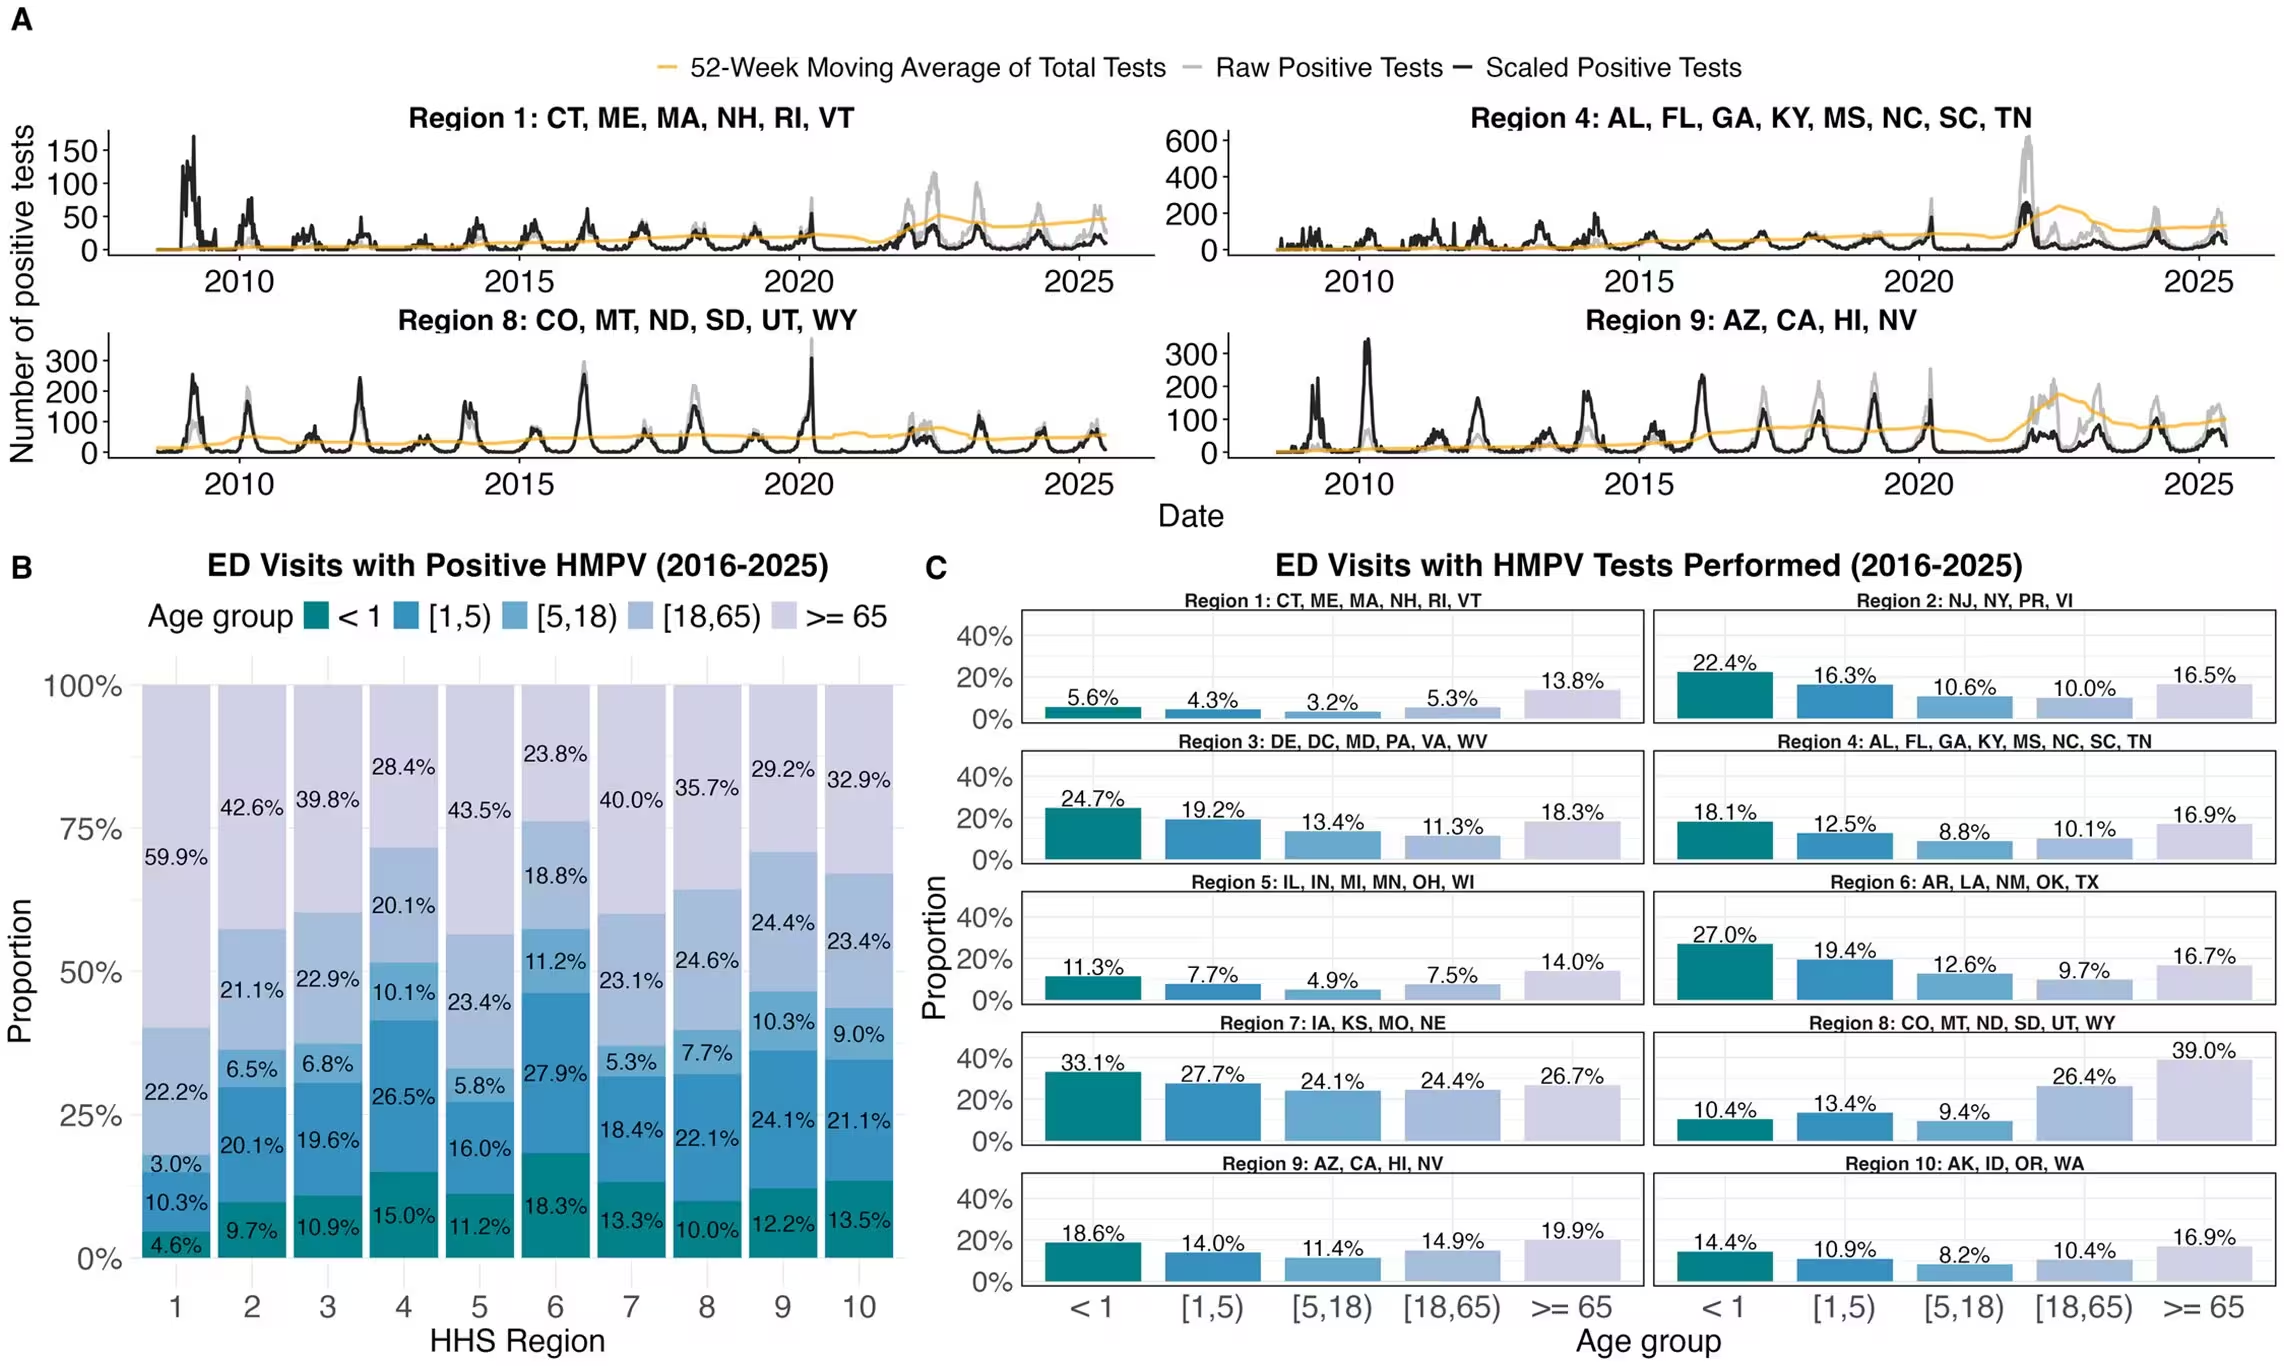
Certain geographic zones, particularly the upper Midwest and the West, displayed fascinating biennial rhythms. These areas experienced alternating patterns of smaller outbreaks in even-numbered years and larger, earlier outbreaks in odd-numbered years. By stratifying emergency department visits into age brackets, the authors found that infants under one year old accounted for roughly 12 percent of cases, children aged one to five made up nearly 21 percent, and adults aged 65 and older bore the largest burden at roughly 38 percent of all reported encounters.
Why Climate Factors Took a Backseat to Viral Interference
To determine what drives these patterns, the team built an age-stratified mathematical transmission model incorporating natural history parameters, testing frequency adjustments, and environmental datasets. They tested multiple climate indicators, including vapor pressure, minimum temperature, precipitation, and potential evapotranspiration. Surprisingly, models incorporating only climate variables did not improve statistical fit compared to baseline models.
However, models that incorporated an RSV-associated interaction term successfully reproduced both the seasonal timing and the puzzling biennial patterns observed in regions 8 and 9. The analysis pointed to a suppressive population-level effect, where peak RSV activity temporarily curtails HMPV transmission rates by an average of eight percent. The researchers emphasize that this phenomenon reflects epidemiological competition between co-circulating pathogens rather than direct biological proof of host-level antagonism alone.
The Impact of New RSV Interventions on Future Outbreaks
With the recent authorization of monoclonal antibodies like nirsevimab, maternal immunizations, and adult vaccines designed to combat RSV, public health experts raised questions about whether suppressing RSV might inadvertently trigger a surge in HMPV cases. To answer this, the team simulated forward intervention scenarios covering the 2025 through 2027 seasons.
The simulations project that achieving a 50 percent coverage rate across RSV interventions will substantially reduce RSV-related lower respiratory tract infections, particularly among infants and older adults. Crucially, the model indicates that these interventions will have a minimal impact on HMPV incidence, predicting a negligible overall increase of about two percent in HMPV cases. The authors conclude that while viral interference is detectable, the interaction magnitude is not strong enough to cause a dramatic rebound in human metapneumovirus disease burden as RSV vaccination programs expand.
The research was published in PLOS Pathogens on November 17, 2026.
This article has been fact checked for accuracy, with information verified against reputable sources. Learn more about us and our editorial process.
Last reviewed on .
Article history
- Latest version
Reference(s)
- Li, Ke., et al. “Spatiotemporal dynamics of human metapneumovirus and potential impact of respiratory syncytial virus interventions in the United States.” PLOS Pathogens, vol. 22, no. 11, November 17, 2026, pp. e1014810 Public Library of Science (PLoS), doi: 10.1371/journal.ppat.1014810. <https://doi.org/10.1371/journal.ppat.1014810>.
Cite this page:
- Posted by Michael Ellison