Brain Tumor Cells Exploit Tyrosine Metabolism to Drive Immune Evasion
Chemistry

Brain Tumor Cells Exploit Tyrosine Metabolism to Drive Immune Evasion

A new 10-gene prognostic model successfully stratifies patient survival risks by tracking metabolic reprogramming in astrocytomas.

By Bilal Abbasi
Published:
Email this Article
Brain Tumor Cells Exploit Tyrosine Metabolism to Drive Immune Evasion
Photo by Robina Weermeijer on Unsplash

Brain tumor cells reprogram how they process the amino acid tyrosine to manipulate nearby immune cells and fuel malignant growth, according to a recent study. Low-grade astrocytoma, a prevalent and infiltrative type of adult brain tumor affecting roughly 24,000 Americans each year, frequently progresses to deadlier glioblastoma stages despite aggressive surgery, radiation, and chemotherapy.

How Single-Cell Sequencing Mapped Tyrosine Pathways

By analyzing single-cell transcriptomes from two independent patient cohorts, researchers discovered that astrocytes, which are star-shaped glial cells in the central nervous system, display exceptionally high tyrosine metabolism activity compared to other cell types in the tumor microenvironment. The study was published in PLOS One, detailing how this metabolic processing shifts along cellular differentiation trajectories.

The research team combined single-cell profiling with bulk RNA sequencing data from 221 tumor samples. Using weighted gene co-expression network analysis, they isolated a specific genetic module tied directly to tyrosine metabolism. They then evaluated 101 different machine learning algorithm combinations to distill down a concise 10-gene prognostic signature known as the Tyrosine Metabolism Risk Model.

What High-Risk Scores Reveal About Tumor Microenvironments

When patients were divided into high- and low-risk groups using this model, those with high-risk scores faced significantly shorter overall survival times. The prognostic signature was successfully validated in external cohorts, showing robust accuracy across independent patient groups.
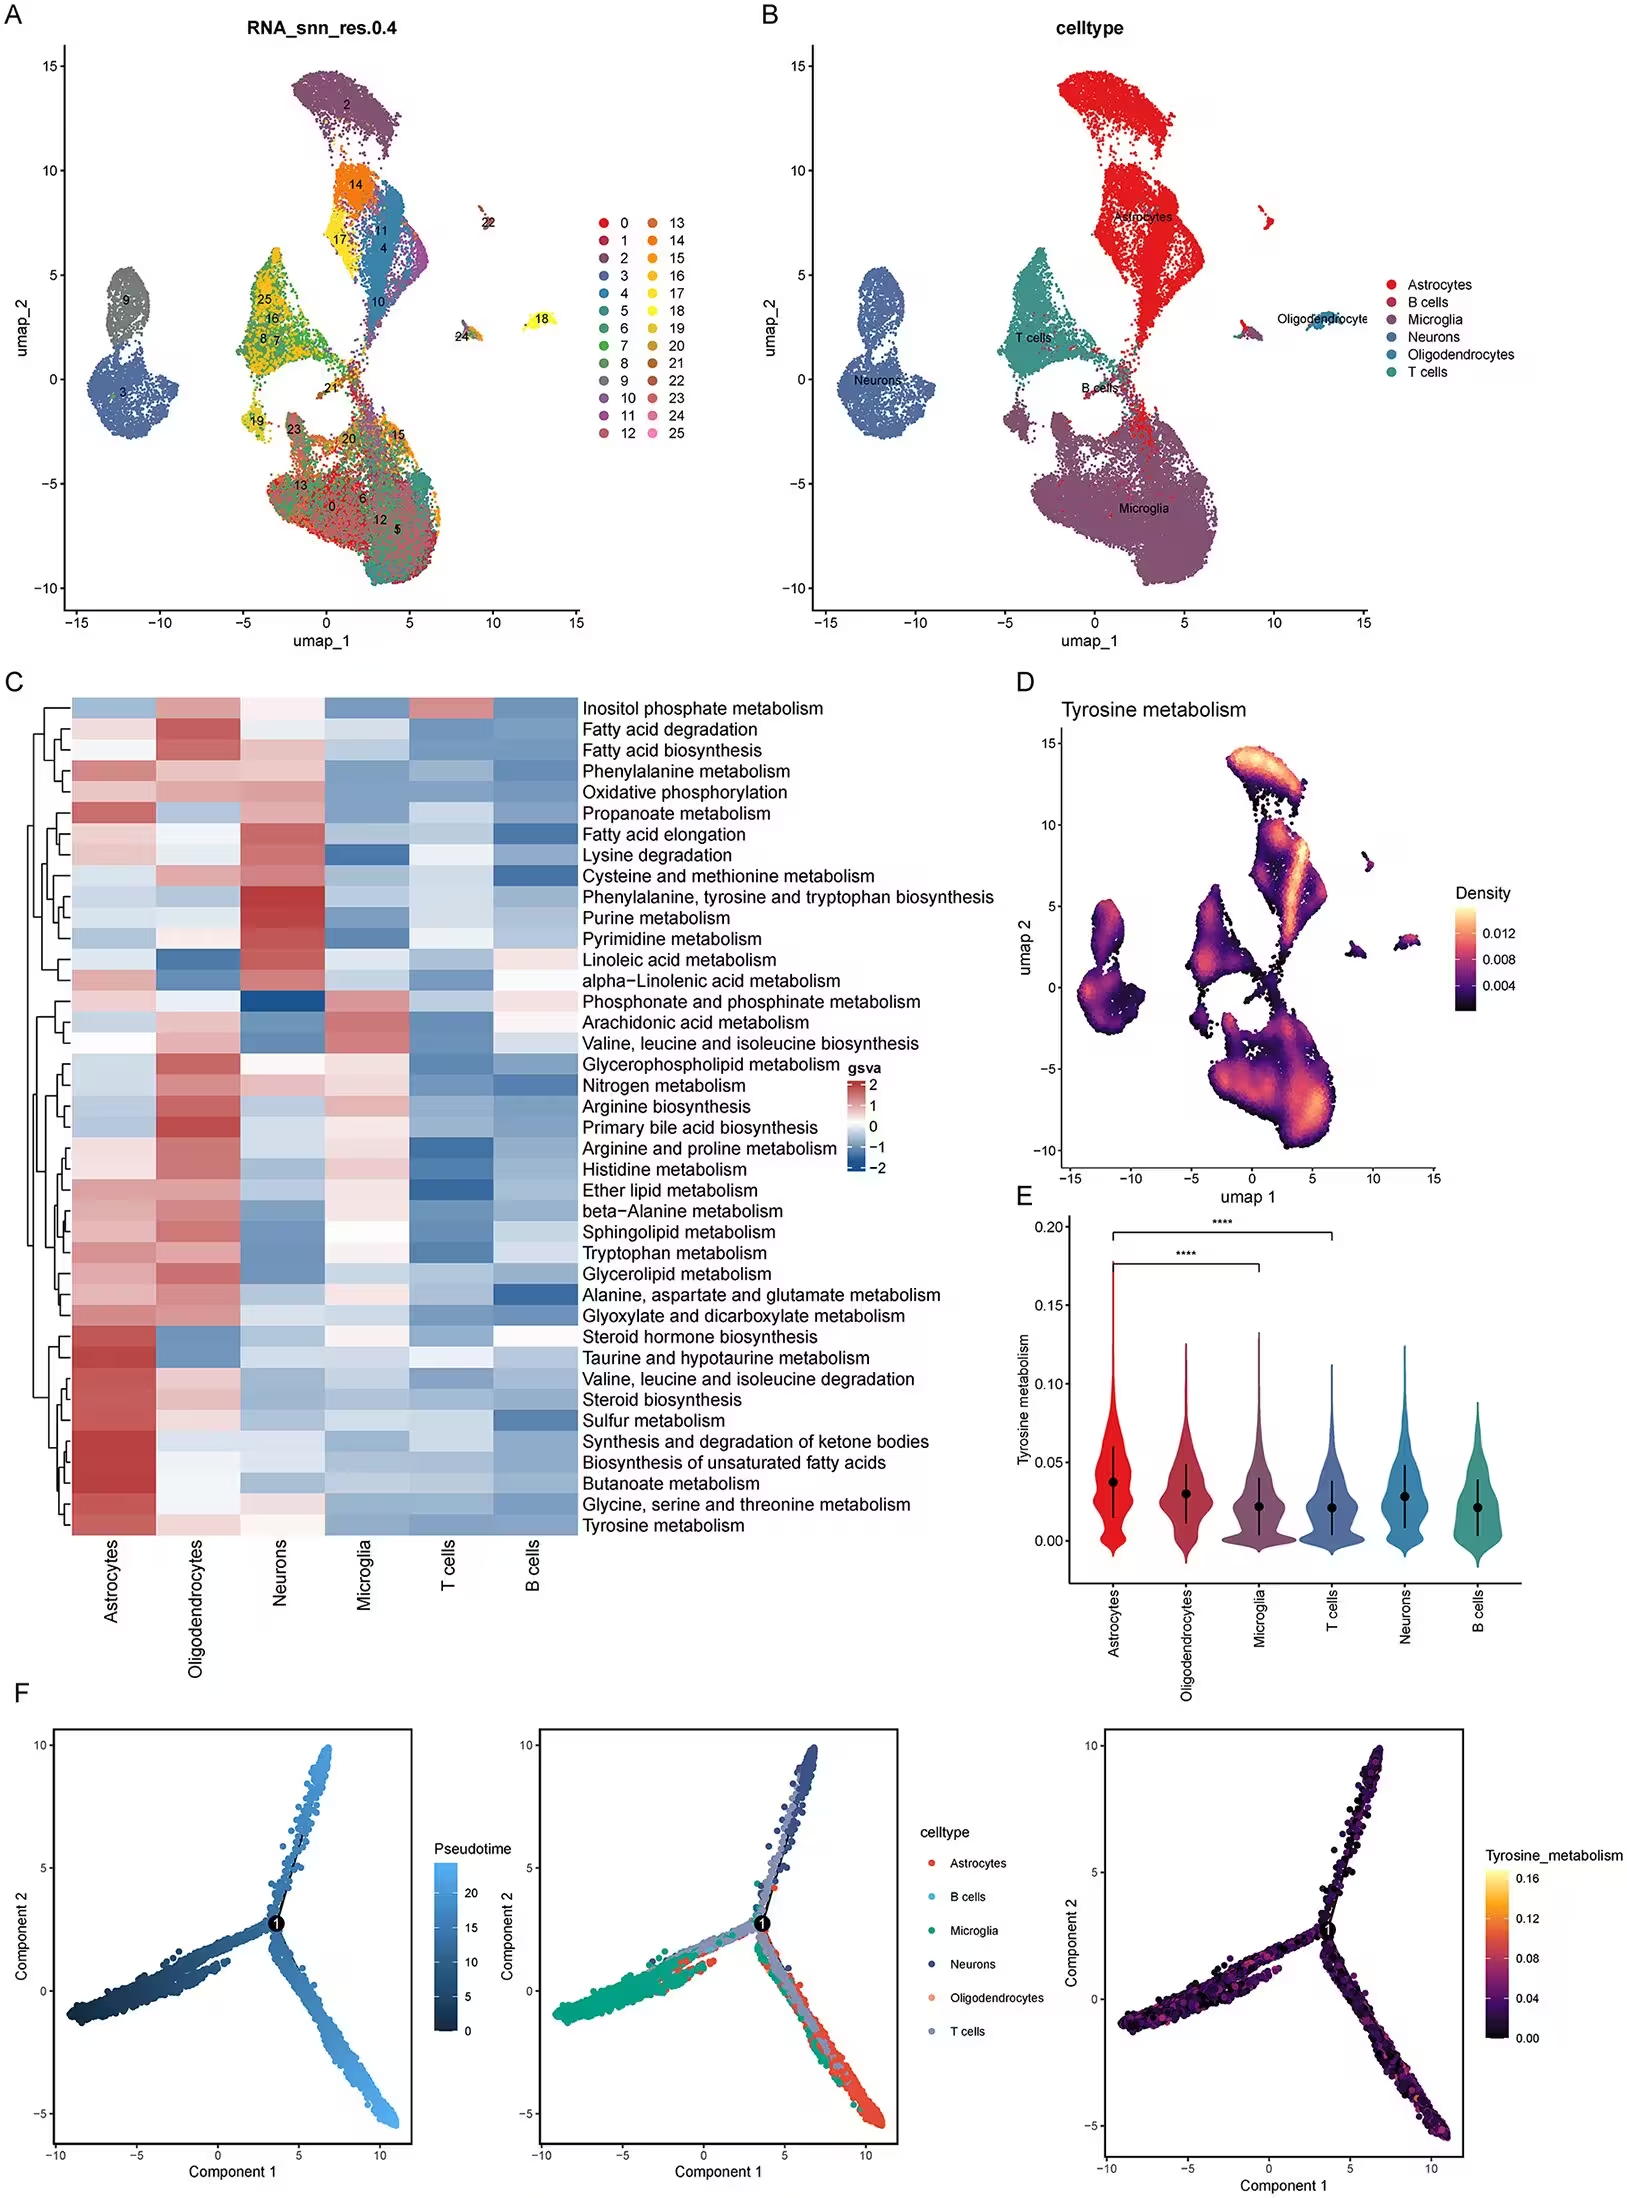
Fig 1: Single-cell sequencing reveals metabolic heterogeneity and the distribution of tyrosine metabolism in low-grade astrocytoma. A. UMAP clustering of low-grade astrocytoma single cells from the GSE182109 and GSE222850 datasets (resolution = 0.4), identifying 26 cell clusters. B. UMAP visualization following cell-type annotation. Major cell types include astrocytes, B cells, microglia, neurons, oligodendrocytes, and T cells. C. Heatmap of metabolic pathway activity across cell types based on GSVA, demonstrating pronounced metabolic heterogeneity among cell populations. D. UMAP density plot of tyrosine metabolism pathway activity, indicating preferential enrichment in specific cell clusters. E. Violin plot comparing tyrosine metabolism pathway scores across cell types. Astrocytes exhibit significantly higher activity than all other cell types (****p < 0.0001). F. Monocle2 pseudotime trajectory analysis showing the cell differentiation trajectory (left), cell-type distribution along pseudoti
Single-cell sequencing reveals metabolic heterogeneity and the distribution of tyrosine metabolism in low-grade astrocytoma. A. UMAP clustering of low-grade astrocytoma single cells from the GSE182109 and GSE222850 datasets (resolution = 0.4), identifying 26 cell clusters. B. UMAP visualization following cell-type annotation. Major cell types include astrocytes, B cells, microglia, neurons, oligodendrocytes, and T cells. C. Heatmap of metabolic pathway activity across cell types based on GSVA, demonstrating pronounced metabolic heterogeneity among cell populations. D. UMAP density plot of tyrosine metabolism pathway activity, indicating preferential enrichment in specific cell clusters. E. Violin plot comparing tyrosine metabolism pathway scores across cell types. Astrocytes exhibit significantly higher activity than all other cell types (****p < 0.0001). F. Monocle2 pseudotime trajectory analysis showing the cell differentiation trajectory (left), cell-type distribution along pseudoti Credit: XiaoFeng Lin et al. / PLOS One

Additional functional assays showed that high-risk tumors undergo extensive reprogramming, featuring activation of epithelial-mesenchymal transition, the PI3K-AKT-mTOR signaling cascade, and strong interferon-gamma responses. These high-risk cellular environments also feature increased infiltration of immunosuppressive M2 macrophages and activated mast cells, which help the tumor evade normal immune surveillance.

Cell-Cell Communication Networks Driven by Astrocytes

To understand how these metabolic changes affect neighboring cells, researchers mapped intercellular communication channels within the tissue. High-risk astrocytes were found to act as active signal senders, communicating heavily with microglia and T cells via MIF, PTN, and SPP1 signaling axes. This cross-talk creates a protective inflammatory bubble that helps cancer cells proliferate and migrate.
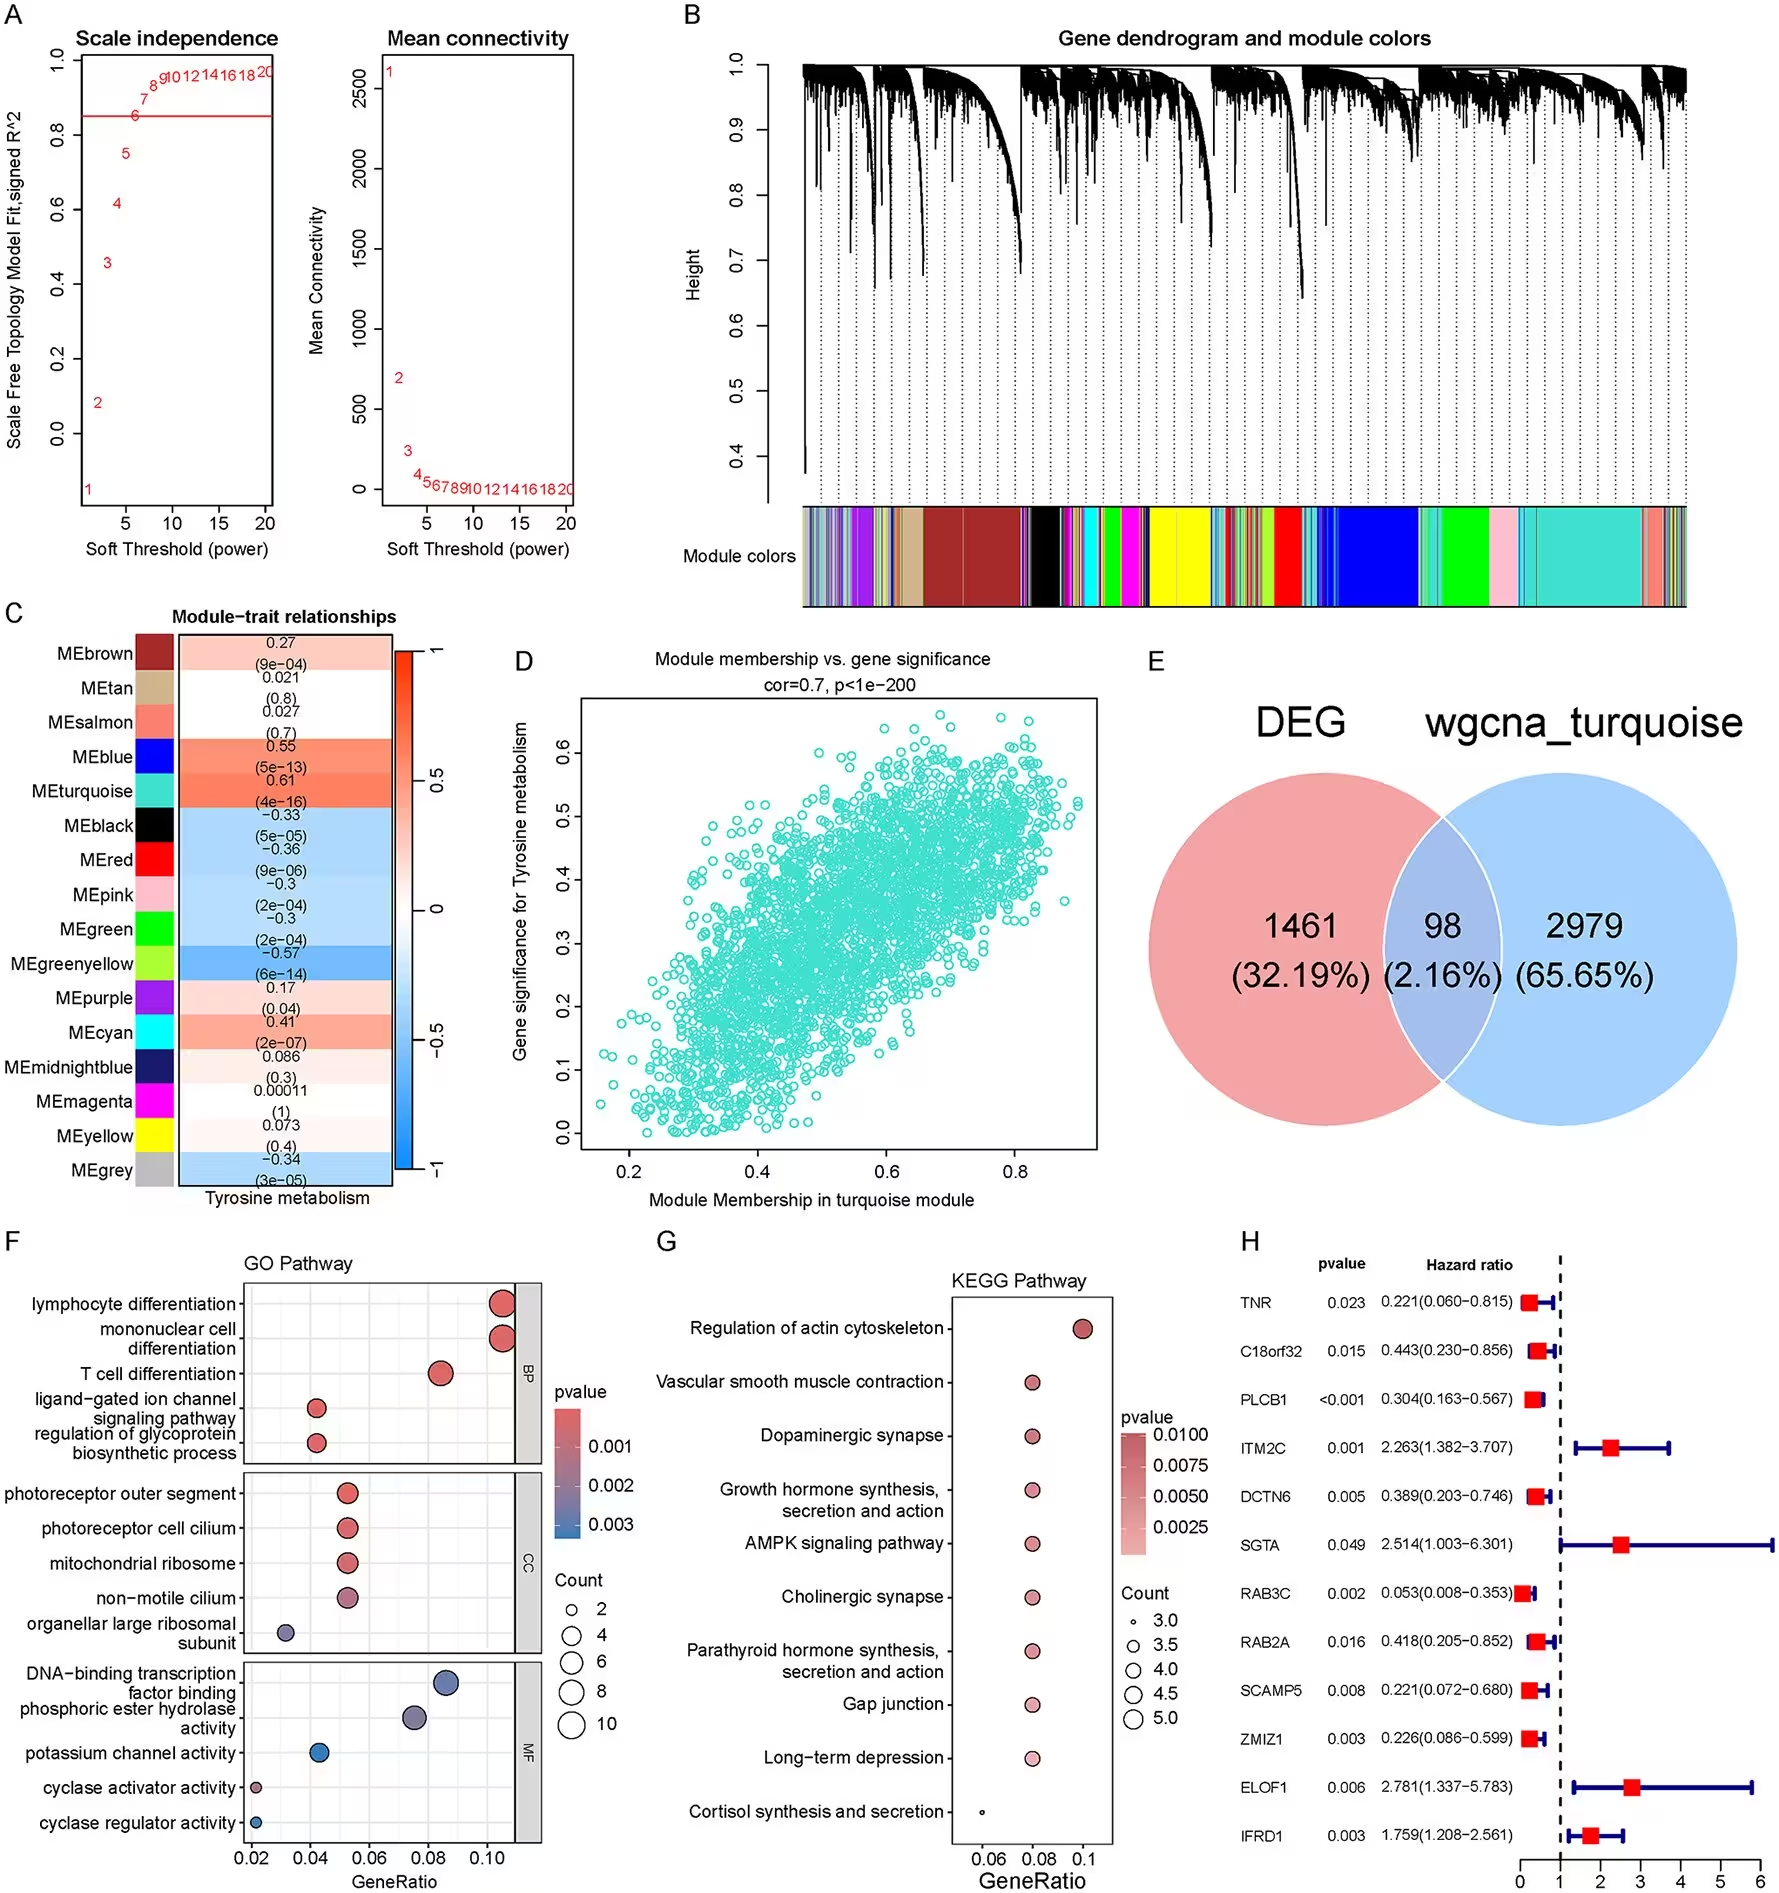
Fig 2: WGCNA identifies key modules and hub genes associated with tyrosine metabolism. A. Soft-thresholding power selection for WGCNA. The left panel shows scale-free topology fit indices across different soft-thresholding powers; the right panel displays mean connectivity. β = 6 was selected as the optimal power. B. Gene hierarchical clustering dendrogram with module color assignment, identifying multiple co-expression modules. C. Module-trait relationship heatmap showing that the turquoise module (MEturquoise) exhibits the strongest positive correlation with tyrosine metabolism (cor = 0.61, p = 4 × 10−16). D. Scatter plot of module membership (MM) versus gene significance (GS) in the turquoise module, demonstrating a significant positive correlation (cor = 0.7, p < 1 × 10−200). E. Venn diagram illustrating the overlap between differentially expressed genes (DEGs) and turquoise module genes, yielding 98 intersecting genes. F. GO enrichment analysis of the intersecting genes. Top panel: biolo
WGCNA identifies key modules and hub genes associated with tyrosine metabolism. A. Soft-thresholding power selection for WGCNA. The left panel shows scale-free topology fit indices across different soft-thresholding powers; the right panel displays mean connectivity. β = 6 was selected as the optimal power. B. Gene hierarchical clustering dendrogram with module color assignment, identifying multiple co-expression modules. C. Module-trait relationship heatmap showing that the turquoise module (MEturquoise) exhibits the strongest positive correlation with tyrosine metabolism (cor = 0.61, p = 4 × 10−16). D. Scatter plot of module membership (MM) versus gene significance (GS) in the turquoise module, demonstrating a significant positive correlation (cor = 0.7, p < 1 × 10−200). E. Venn diagram illustrating the overlap between differentially expressed genes (DEGs) and turquoise module genes, yielding 98 intersecting genes. F. GO enrichment analysis of the intersecting genes. Top panel: biolo Credit: XiaoFeng Lin et al. / PLOS One

Conversely, the study highlighted specific protective factors within the genetic model. Among them, the gene encoding RAB3C, a small GTPase protein responsible for regulating vesicular exocytosis, emerged as a major tumor suppressor. In human astrocytoma cell lines, silencing this gene through targeted small interfering RNA duplexes significantly enhanced cell migration, invasive capacity, and proliferation over a 96-hour period.

Limitations and Next Steps for Precision Oncology

The authors note several limitations to keep in mind. The single-cell datasets utilized for the initial discovery phase involved a small number of patients, and the in vitro experiments relied on a single established astrocytoma cell line that may not capture the full genetic diversity found in human tumors. Furthermore, drug sensitivity differences predicted via pharmacogenomic databases remain in silico estimates that require rigorous laboratory and clinical validation.

Despite these caveats, the newly identified metabolic signature offers a promising tool for risk stratification using routine clinical sequencing. By highlighting how amino acid metabolism dictates immune suppression in brain tumors, the findings point toward novel therapeutic targets for patients facing low-grade astrocytoma progression.

The research was published in PLOS One on November 16, 2026.

Fact Checked

This article has been fact checked for accuracy, with information verified against reputable sources. Learn more about us and our editorial process.

Last reviewed on .

Article history

  • Latest version

Reference(s)

  1. Lin, XiaoFeng. “A ten-gene tyrosine-metabolism signature defines prognosis and reveals metabo-immune suppression in low-grade astrocytoma.” PLOS ONE, vol. 21, no. 11, pp. e0359523, doi: 10.1371/journal.pone.0359523. <https://doi.org/10.1371/journal.pone.0359523>.

Cite this page:

Abbasi, Bilal. “Brain Tumor Cells Exploit Tyrosine Metabolism to Drive Immune Evasion.” BioScience. BioScience ISSN 2521-5760, 16 November 2026. <https://www.bioscience.com.pk/en/subject/chemistry/a-ten-gene-tyrosine-metabolism-signature-defines-prognosis-and-reveals-metabo-immune-suppression-in-low-grade-astrocytoma>. Abbasi, B. (2026, November 16). “Brain Tumor Cells Exploit Tyrosine Metabolism to Drive Immune Evasion.” BioScience. ISSN 2521-5760. Retrieved November 16, 2026 from https://www.bioscience.com.pk/en/subject/chemistry/a-ten-gene-tyrosine-metabolism-signature-defines-prognosis-and-reveals-metabo-immune-suppression-in-low-grade-astrocytoma Abbasi, Bilal. “Brain Tumor Cells Exploit Tyrosine Metabolism to Drive Immune Evasion.” BioScience. ISSN 2521-5760. https://www.bioscience.com.pk/en/subject/chemistry/a-ten-gene-tyrosine-metabolism-signature-defines-prognosis-and-reveals-metabo-immune-suppression-in-low-grade-astrocytoma (accessed November 16, 2026).
End of the article