Mouse Brain Rhythms Fade Under Recursive Data Reduction
Biology

Mouse Brain Rhythms Fade Under Recursive Data Reduction

New mathematical analysis shows that temporal organization in neuronal spike trains contracts sharply as details are stripped away.

By Priya Sharma
Published:
Email this Article
Mouse Brain Rhythms Fade Under Recursive Data Reduction
Photo by Mirella Callage on Unsplash

Brain spike trains in sleeping mice reveal hidden temporal rhythms that vanish as data is repeatedly reduced, exposing how neural organization shifts from low-level detail to background noise. When researchers stripped away individual spike order while keeping overall firing rates intact, the remaining structure contracted sharply across successive levels of a mathematical hierarchy.

How Recursive Data Reduction Reveals Hidden Brain Rhythms

Temporal organization in biological signals is traditionally examined at a fixed observational scale, making it difficult to track how patterns change as details are stripped away. To solve this, investigator Vadim Shlyonsky published in the arXiv preprint server a novel analytical framework called hierarchical maxima-gap statistics, or HMGS, which repeatedly reduces a sequence by keeping only its local peaks. Instead of relying on a preset clock or external window, this method re-indexes surviving peaks to build an endogenous hierarchy of successive scales. At each step, the mean and variance of the gaps between these peaks define a trajectory in a two-dimensional statistical plane, allowing scientists to track whether temporal patterns collapse, persist, or amplify over time.

Testing random independent data streams generated a stable, distribution-independent reference trajectory that served as a baseline. When applied to synthetic neuronal populations and chaotic systems, the results showed that structural organization does not always survive data reduction. Some patterns collapsed immediately, while others persisted or even amplified depending on the underlying temporal structure of the source.
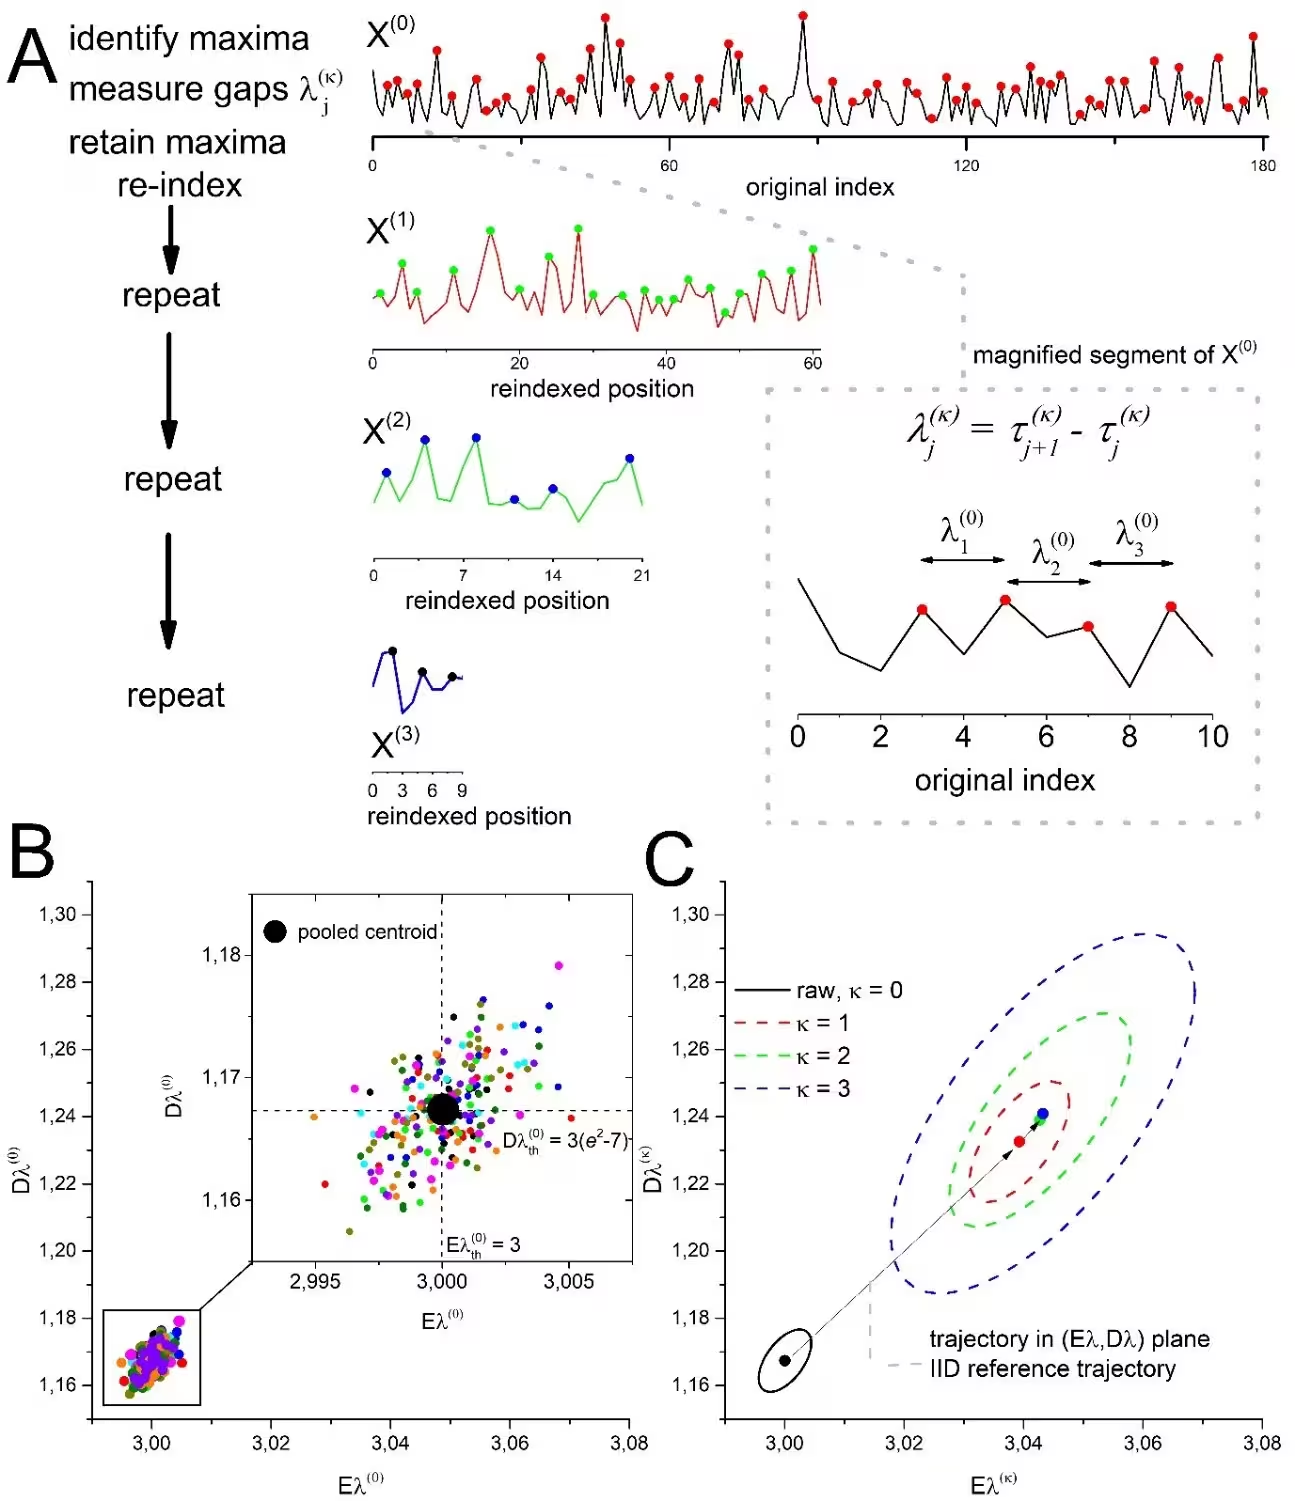
Figure 1: Recursive extrema extraction transforms temporal organization into a trajectory. A, At each hierarchy order κ\kappa, local maxima of X(κ)X^{(\kappa)} are identified and the gaps between their indices are measured as λj(κ)=τj+1(κ)−τj(κ)\lambda_{j}^{(\kappa)}=\tau_{j+1}^{(\kappa)}-\tau_{j}^{(\kappa)}. The retained maxima, preserved in their original order, form X(κ+1)X^{(\kappa+1)} and are consecutively re-indexed before the operation is repeated. Colours show how maxima selected at one level become the sequence analysed at the next; the enlargement illustrates gap measurement at κ=0\kappa=0. B, Raw gap statistics from 200 realizations representing ten continuous IID models. Colors distinguish IID generators. The pooled centroid lies close to the exact distribution-independent values Eλ(0)=3E_{\lambda}^{(0)}=3 and Dλ(0)=3​(e2−7)D_{\lambda}^{(0)}=3\left(e^{2}-7\right). C, Empirical 95% bivariate IID reference regions at hierarchy orders κ=0​–​3\kappa=0\text{\textendash}3. Points indicate
Recursive extrema extraction transforms temporal organization into a trajectory. A, At each hierarchy order κ\kappa, local maxima of X(κ)X^{(\kappa)} are identified and the gaps between their indices are measured as λj(κ)=τj+1(κ)−τj(κ)\lambda_{j}^{(\kappa)}=\tau_{j+1}^{(\kappa)}-\tau_{j}^{(\kappa)}. The retained maxima, preserved in their original order, form X(κ+1)X^{(\kappa+1)} and are consecutively re-indexed before the operation is repeated. Colours show how maxima selected at one level become the sequence analysed at the next; the enlargement illustrates gap measurement at κ=0\kappa=0. B, Raw gap statistics from 200 realizations representing ten continuous IID models. Colors distinguish IID generators. The pooled centroid lies close to the exact distribution-independent values Eλ(0)=3E_{\lambda}^{(0)}=3 and Dλ(0)=3​(e2−7)D_{\lambda}^{(0)}=3\left(e^{2}-7\right). C, Empirical 95% bivariate IID reference regions at hierarchy orders κ=0​–​3\kappa=0\text{\textendash}3. Points indicate Credit: Vadim Shlyonsky / arXiv

Why Neural Spike Trains Lose Order at Deeper Hierarchy Levels

To understand how real neural data behaves, the author analyzed publicly available extracellular recordings from freely moving mice during slow-wave sleep, accessed via the Buzsáki Laboratory dataset. Spike times from recorded clusters were pooled into population sequences and compared against matched surrogate controls that preserved individual firing rates but removed within-source ordering. The median normalized separation between real brain activity and the shuffled control started high at 9.1 times intrinsic variability for the initial level, but dropped to just 1.2 times after three recursive reductions.

This sharp contraction indicates that the bulk of ordering-dependent organization in these sleep recordings is concentrated at shallow hierarchy levels rather than deep scales. While pooling multiple neurons naturally creates non-independent trajectories through superposition alone, the remaining excess structure diminishes as the hierarchy progresses.
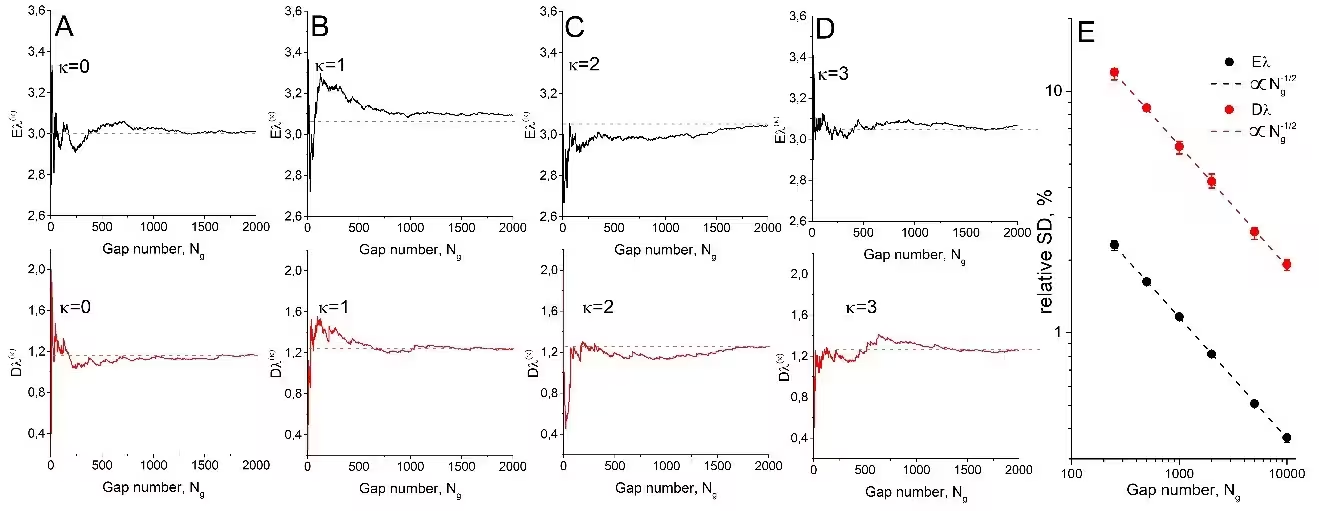
Figure 2: Finite-record behavior and precision of IID hierarchy statistics. A–D, Running estimates of E​λ(κ)E\lambda^{(\kappa)} (black) and D​λ(κ)D\lambda^{(\kappa)} (red) for one representative Gaussian IID realization at κ=0​–​3\kappa=0\text{\textendash}3. Dashed horizontal lines indicate the corresponding complete-record estimates. E, Relative across-realization SD of the estimated mean and variance at fixed order-specific gap count NgN_{g}. Symbols show means across κ=0​–​3\kappa=0\text{\textendash}3, asymmetric error bars span the order-wise minimum and maximum. Dashed lines show unconstrained log-log power-law fits: R​e​l​a​t​i​v​e​S​D​(E^)=36.5​Ng−0.500%Relative{SD}\left(\widehat{E}\right)=36.5N_{g}^{-0.500}\ \%\ \ and R​e​l​a​t​i​v​e​S​D​(D^)=190​Ng−0.501%Relative\ SD\left(\widehat{D}\right)=190N_{g}^{-0.501\ \ }\%, consistent with Ng−1/2N_{g}^{-1/2} finite-sample scaling.
Finite-record behavior and precision of IID hierarchy statistics. A–D, Running estimates of E​λ(κ)E\lambda^{(\kappa)} (black) and D​λ(κ)D\lambda^{(\kappa)} (red) for one representative Gaussian IID realization at κ=0​–​3\kappa=0\text{\textendash}3. Dashed horizontal lines indicate the corresponding complete-record estimates. E, Relative across-realization SD of the estimated mean and variance at fixed order-specific gap count NgN_{g}. Symbols show means across κ=0​–​3\kappa=0\text{\textendash}3, asymmetric error bars span the order-wise minimum and maximum. Dashed lines show unconstrained log-log power-law fits: R​e​l​a​t​i​v​e​S​D​(E^)=36.5​Ng−0.500%Relative{SD}\left(\widehat{E}\right)=36.5N_{g}^{-0.500}\ \%\ \ and R​e​l​a​t​i​v​e​S​D​(D^)=190​Ng−0.501%Relative\ SD\left(\widehat{D}\right)=190N_{g}^{-0.501\ \ }\%, consistent with Ng−1/2N_{g}^{-1/2} finite-sample scaling. Credit: Vadim Shlyonsky / arXiv

What These Trajectories Mean for Complex Biological Systems

The study highlights that standard correlation or entropy measures can miss multi-point ordinal dependencies that only become visible through recursive reduction. However, the technique comes with strict data requirements. Because each extraction retains roughly one third of the observations, analyzing four hierarchy levels demands thousands of initial events to maintain statistical precision.

Ultimately, tracking these trajectories demonstrates that temporal organization cannot be captured by a single coordinate or scale alone. By evaluating both initial displacement and eventual fate under progressive reduction, researchers gain a fresh tool for investigating complex biological and physical dynamics without imposing arbitrary windows.

The study was posted to the arXiv preprint server on November 19, 2026.

Fact Checked

This article has been fact checked for accuracy, with information verified against reputable sources. Learn more about us and our editorial process.

Last reviewed on .

Article history

  • Latest version

Reference(s)

  1. Shlyonsky, Vadim. “Recursive extrema extraction tracks temporal organization through progressive data reduction.” arXiv.org <http://arxiv.org/abs/2611.25957v1>.

Cite this page:

Sharma, Priya. “Mouse Brain Rhythms Fade Under Recursive Data Reduction.” BioScience. BioScience ISSN 2521-5760, 20 November 2026. <https://www.bioscience.com.pk/en/subject/biology/recursive-extrema-extraction-tracks-temporal-organization-through-progressive-data-reduction>. Sharma, P. (2026, November 20). “Mouse Brain Rhythms Fade Under Recursive Data Reduction.” BioScience. ISSN 2521-5760. Retrieved November 20, 2026 from https://www.bioscience.com.pk/en/subject/biology/recursive-extrema-extraction-tracks-temporal-organization-through-progressive-data-reduction Sharma, Priya. “Mouse Brain Rhythms Fade Under Recursive Data Reduction.” BioScience. ISSN 2521-5760. https://www.bioscience.com.pk/en/subject/biology/recursive-extrema-extraction-tracks-temporal-organization-through-progressive-data-reduction (accessed November 20, 2026).
End of the article