Deformable Cells Shape Hidden Force Networks in Crowded Tissues
Biology

Deformable Cells Shape Hidden Force Networks in Crowded Tissues

Active movement and flexibility force cellular interactions to split into bimodal distributions enclosed by topological loops.
By Hassan Raza
Published:
Email this Article
Deformable Cells Shape Hidden Force Networks in Crowded Tissues
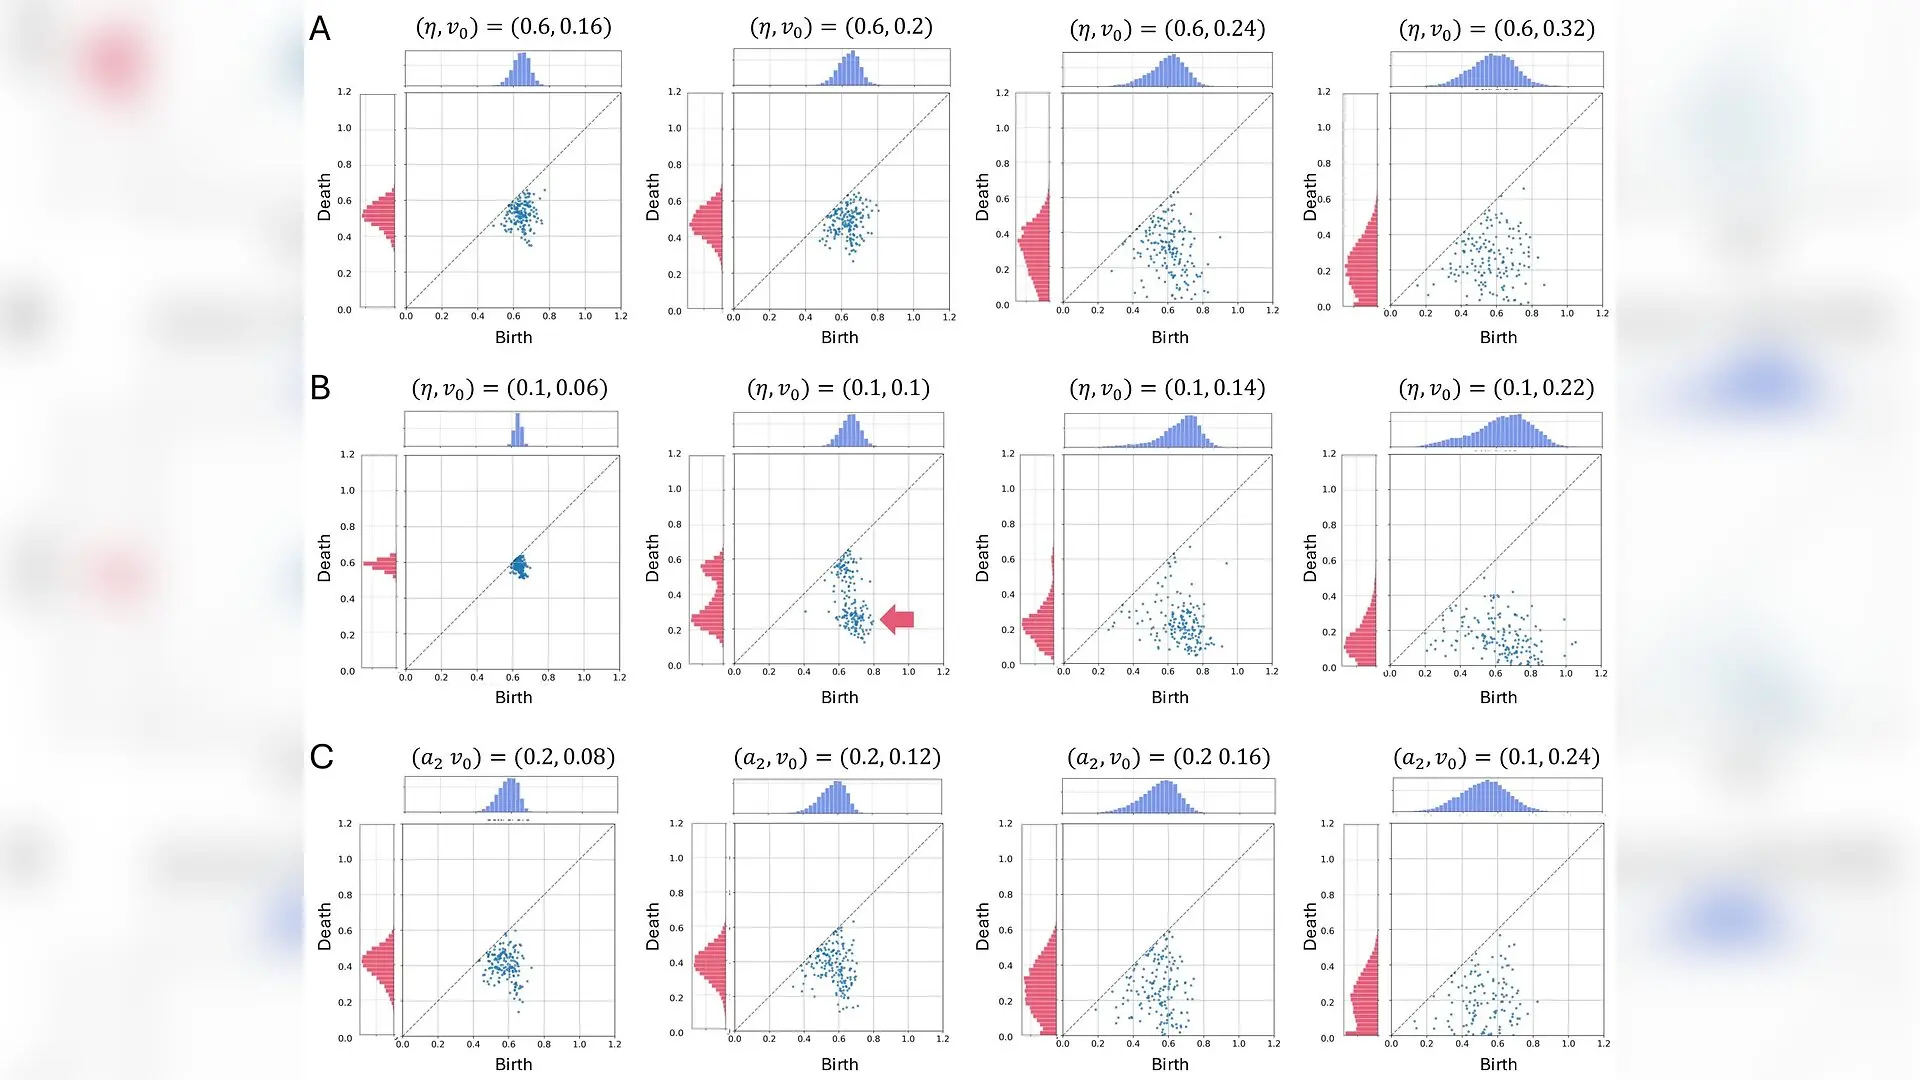
Persistence diagrams (PDs) under rigid, soft, and non-deformable conditions. (A–C) η=0.6\eta=0.6 (A; rigid), η=0.1\eta=0.1 (B; soft), and a2=0.2a_{2}=0.2 (C; non-deformable). Each column corresponds to different values of the self-propulsion strength v0v_{0}. Contact force strengths averaged within Δ​t=1\Delta t=1 are used for PDs. Frequencies of birth and death are shown above and to the left of the PDs, respectively. These distributions are calculated from PDs obtained at 100 different time points. (A, B) At small v0v_{0}, points are clustered near the diagonal (leftmost panels). At intermediate v0v_{0}, the arrow in the second panel of (B) indicates the distinct off-diagonal cluster. As v0v_{0} increases, the PDs for both rigid and soft cells become increasingly dispersed (right two panels), consistent with the broadening of the contact-force distributions (Figure 2A-b, B-b). (C) The PDs of non-deformable cells show patterns similar to those of rigid cells. Koshi Yoshida et al. / arXiv

Living cells in dense biological tissues can organize themselves into unexpected force networks where weak contacts cluster at sharp tips while strong interactions form surrounding loops. A team of researchers has uncovered how cell deformability and active movement drive this strange mechanical pattern in crowded cell assemblies. When cells have enough room and flexibility to change shape, their physical interactions take on a distinct bimodal structure, meaning they feature two completely separate populations of force strengths rather than a single average distribution.

The study, published in the arXiv preprint server, was conducted by Koshi Yoshida, Nen Saito, Shuji Ishihara, and Kaoru Sugimura from the University of Tokyo and the University of Tsukuba. Traditional physics models of granular matter often treat particles as rigid, unchanging shapes that passively transmit pressure. Living tissues, however, operate under entirely different rules because cells can actively migrate and deform in response to surrounding mechanical pressures.

How Flexible Cell Contours Create Split Force Distributions

To understand how force travels across crowded biological layers, the authors utilized a computational framework called the Fourier Contour Cell model. This simulation approach tracks the complex outlines of 256 deformable cells interacting through excluded volume effects and cortical tension. By adjusting variables like self-propulsion velocity and membrane stiffness, the team simulated both rigid cell states and fluid-like soft states packed at high density.

In rigid systems with high cortical tension, contact force distributions remain unimodal with symmetric tails, matching the behavior of compressed inert disks. But when the researchers introduced soft, deformable cell properties at intermediate self-propulsion strengths, the force profile shifted dramatically. A second peak emerged around a force value of 0.2, creating a clear bimodal distribution alongside the stronger interactions centered near 0.65.
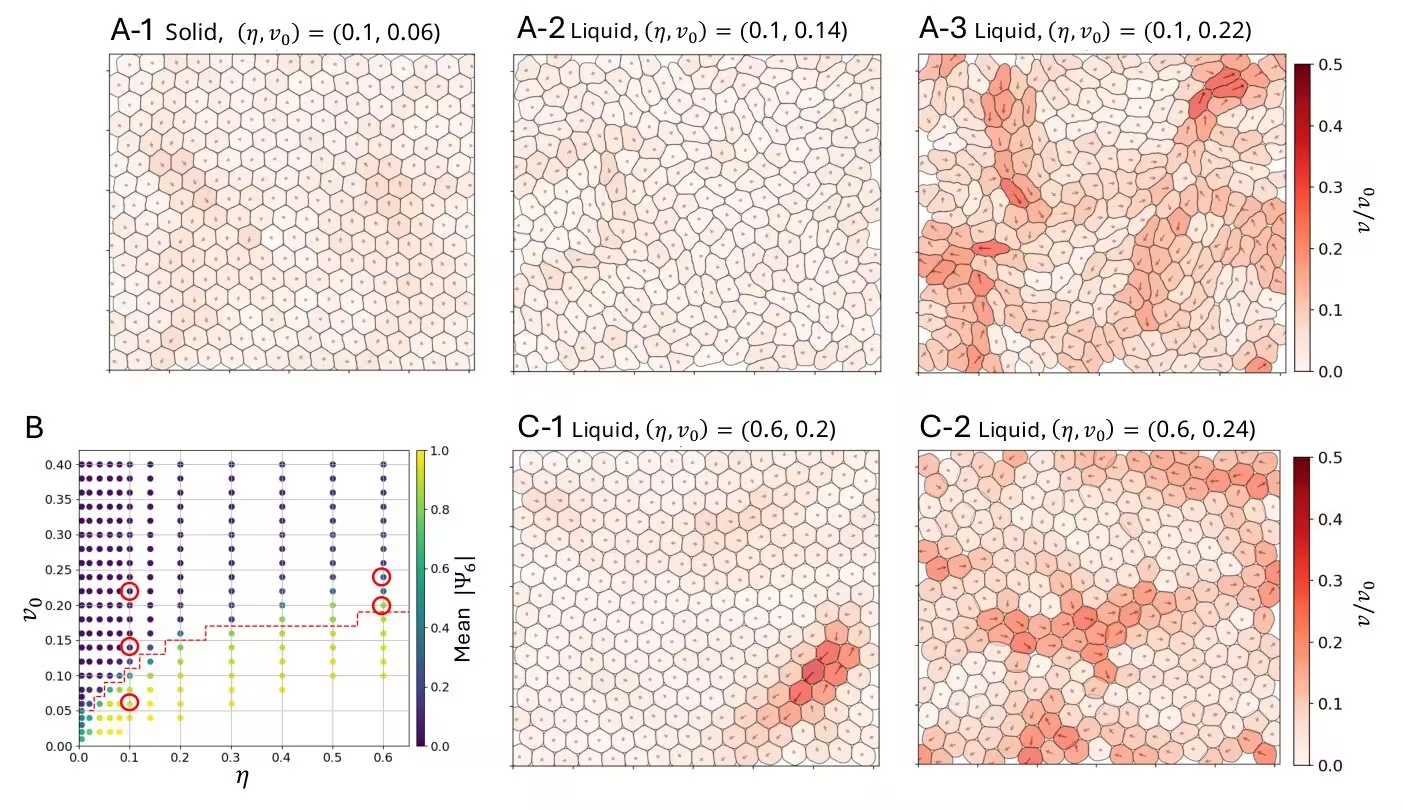
Figure 1: Dynamics and phases at high packing density for different cortical tension and self-propulsion velocity. (A-1)–(A-3) Typical snapshots from numerical simulations with weak cortical tension. Cells are colored according to their normalized velocity (color-bar). The system exhibits a solid phase in (A-1) and a liquid phase in (A-2) and (A-3). The parameters used (cortical tension η\eta and self-propulsion velocity v0v_{0}) are indicated at the top of each panel. (B) Phase diagram in the (η,v0)(\eta,v_{0}) parameter space. The global orientational order parameter |Ψ6||\Psi_{6}| (Sec. 2.3) is shown as an indicator of phase (color-bar). The phase boundary is depicted by the red dashed line. The red circles mark the locations in parameter space corresponding to the snapshots shown in (A) and (C). (C-1)–(C-2) Typical snapshots from numerical simulations with strong cortical tension in the liquid regime close to the solid–liquid phase boundary. Cells are colored according to their normalized ve
Dynamics and phases at high packing density for different cortical tension and self-propulsion velocity. (A-1)–(A-3) Typical snapshots from numerical simulations with weak cortical tension. Cells are colored according to their normalized velocity (color-bar). The system exhibits a solid phase in (A-1) and a liquid phase in (A-2) and (A-3). The parameters used (cortical tension η\eta and self-propulsion velocity v0v_{0}) are indicated at the top of each panel. (B) Phase diagram in the (η,v0)(\eta,v_{0}) parameter space. The global orientational order parameter |Ψ6||\Psi_{6}| (Sec. 2.3) is shown as an indicator of phase (color-bar). The phase boundary is depicted by the red dashed line. The red circles mark the locations in parameter space corresponding to the snapshots shown in (A) and (C). (C-1)–(C-2) Typical snapshots from numerical simulations with strong cortical tension in the liquid regime close to the solid–liquid phase boundary. Cells are colored according to their normalized ve Credit: Koshi Yoshida et al. / arXiv

Persistent Homology Reveals Hidden Loops of Strong and Weak Forces

To look deeper into how these forces are arranged across the tissue, the team applied topological data analysis using persistent homology. This mathematical approach tracks geometric features like loops and holes as force thresholds change from maximum to zero. In rigid tissues, the resulting persistence diagrams showed little structural organization. In contrast, soft cell assemblies displayed a striking off-diagonal cluster representing an intricate network motif.

This topological signature revealed that weak tip-to-tip contacts do not scatter randomly throughout the tissue. Instead, they become enclosed by continuous loops of strong side-to-side contacts. Additional tests involving elongated yet non-deformable cells confirmed that simply having an elongated shape is not enough to produce this network. Cell deformability is strictly required for the bimodal force split and the associated topological loops to form.
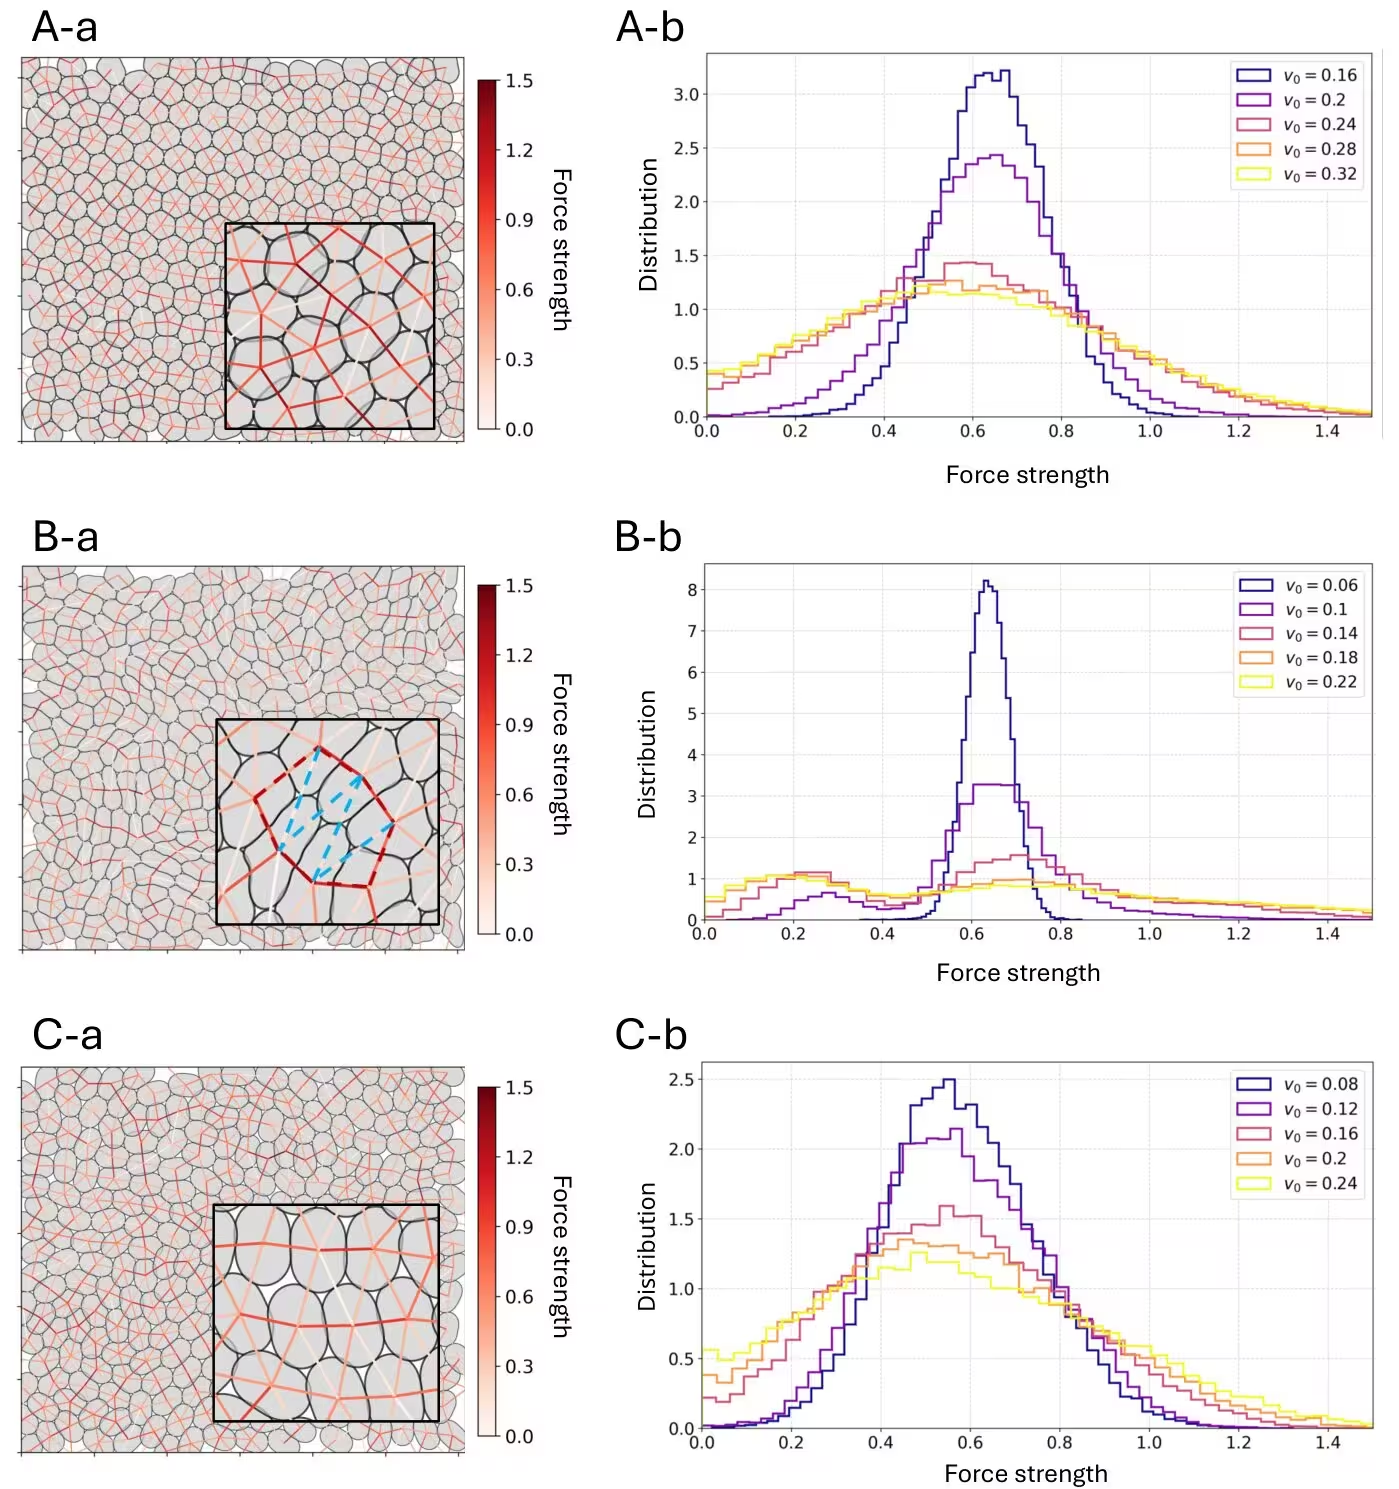
Figure 2: Force distributions under rigid, soft, and non-deformable conditions. (A-a), (B-a), (C-a) Snapshots from the simulations showing the intercellular force network. Edges are drawn between the centroids of contacting cell pairs and colored according to the magnitude of the contact force (color bar); the edges indicate contact pairs rather than force directions, as the contact forces act locally normal to the cell contours. The parameters used are (η,v0)=(0.6,0.24)(\eta,v_{0})=(0.6,0.24) (A-a; rigid), (η,v0)=(0.1,0.14)(\eta,v_{0})=(0.1,0.14) (B-a; soft), and (a2,v0)=(0.2,0.16)(a_{2},v_{0})=(0.2,0.16) (C-a; non-deformable). In (B-a), strong interactions forming loops and the weak interactions enclosed by these loops are highlighted by red and light-blue dashed lines, respectively. (A-b), (B-b), (C-b) Corresponding force distributions. Different colors indicate different values of the self-propulsion strength v0v_{0} used in the simulations.
Force distributions under rigid, soft, and non-deformable conditions. (A-a), (B-a), (C-a) Snapshots from the simulations showing the intercellular force network. Edges are drawn between the centroids of contacting cell pairs and colored according to the magnitude of the contact force (color bar); the edges indicate contact pairs rather than force directions, as the contact forces act locally normal to the cell contours. The parameters used are (η,v0)=(0.6,0.24)(\eta,v_{0})=(0.6,0.24) (A-a; rigid), (η,v0)=(0.1,0.14)(\eta,v_{0})=(0.1,0.14) (B-a; soft), and (a2,v0)=(0.2,0.16)(a_{2},v_{0})=(0.2,0.16) (C-a; non-deformable). In (B-a), strong interactions forming loops and the weak interactions enclosed by these loops are highlighted by red and light-blue dashed lines, respectively. (A-b), (B-b), (C-b) Corresponding force distributions. Different colors indicate different values of the self-propulsion strength v0v_{0} used in the simulations. Credit: Koshi Yoshida et al. / arXiv

Local Curvature Constraints Shape Tip-to-Tip Interactions

The researchers also discovered that the sharpness of cell contours dictates the exact magnitude of weak interactions. By altering the number of Fourier modes used in the simulation, they found that higher resolution leads to sharper tip regions, which reduces cell overlap and makes weak contacts even weaker. To mirror biological limits found in real plasma membranes and cytoskeletal cortices, the team introduced a curvature-constraint potential.

When local contour curvature was restricted above a threshold of 4.2, the weak-force peak shifted back toward the values seen in lower-resolution models. This suggests that biological limitations on membrane bending help tune force transmission inside multicellular assemblies. Furthermore, the clustering of sharp tips observed in these simulations bears a strong resemblance to multicellular rosettes, which are transient structures that drive tissue remodeling and embryonic development.

These findings suggest an alternative physical mechanism for rosette-like organization that relies entirely on cell deformability and active motility rather than traditional junction contractility. While the exact physiological role of this self-organized force architecture requires further study, the insights could help explain how compressed tissues like tumors maintain structural integrity even when individual cancer cells are remarkably soft.

The study was posted to the arXiv preprint server on November 13, 2026.

Fact Checked

This article has been fact checked for accuracy, with information verified against reputable sources. Learn more about us and our editorial process.

Last reviewed on .

Article history

  • Latest version

Reference(s)

  1. Yoshida, Koshi. “Emergent intercellular contact-force networks shaped by deformability.” arXiv.org <http://arxiv.org/abs/2611.18414v1>.

Cite this page:

Raza, Hassan. “Deformable Cells Shape Hidden Force Networks in Crowded Tissues.” BioScience. BioScience ISSN 2521-5760, 16 November 2026. <https://www.bioscience.com.pk/en/subject/biology/emergent-intercellular-contact-force-networks-shaped-by-deformability>. Raza, H. (2026, November 16). “Deformable Cells Shape Hidden Force Networks in Crowded Tissues.” BioScience. ISSN 2521-5760. Retrieved November 16, 2026 from https://www.bioscience.com.pk/en/subject/biology/emergent-intercellular-contact-force-networks-shaped-by-deformability Raza, Hassan. “Deformable Cells Shape Hidden Force Networks in Crowded Tissues.” BioScience. ISSN 2521-5760. https://www.bioscience.com.pk/en/subject/biology/emergent-intercellular-contact-force-networks-shaped-by-deformability (accessed November 16, 2026).
End of the article