How Flattened Space Pancakes Drive Earth’s Most Extreme Solar Storms
Astronomy

How Flattened Space Pancakes Drive Earth’s Most Extreme Solar Storms

High-resolution simulations reveal that physical squeezing between colliding solar eruptions prevents magnetic field decay and powers severe geomagnetic storms.
By Nida Rehman
Published:
Email this Article
How Flattened Space Pancakes Drive Earth’s Most Extreme Solar Storms
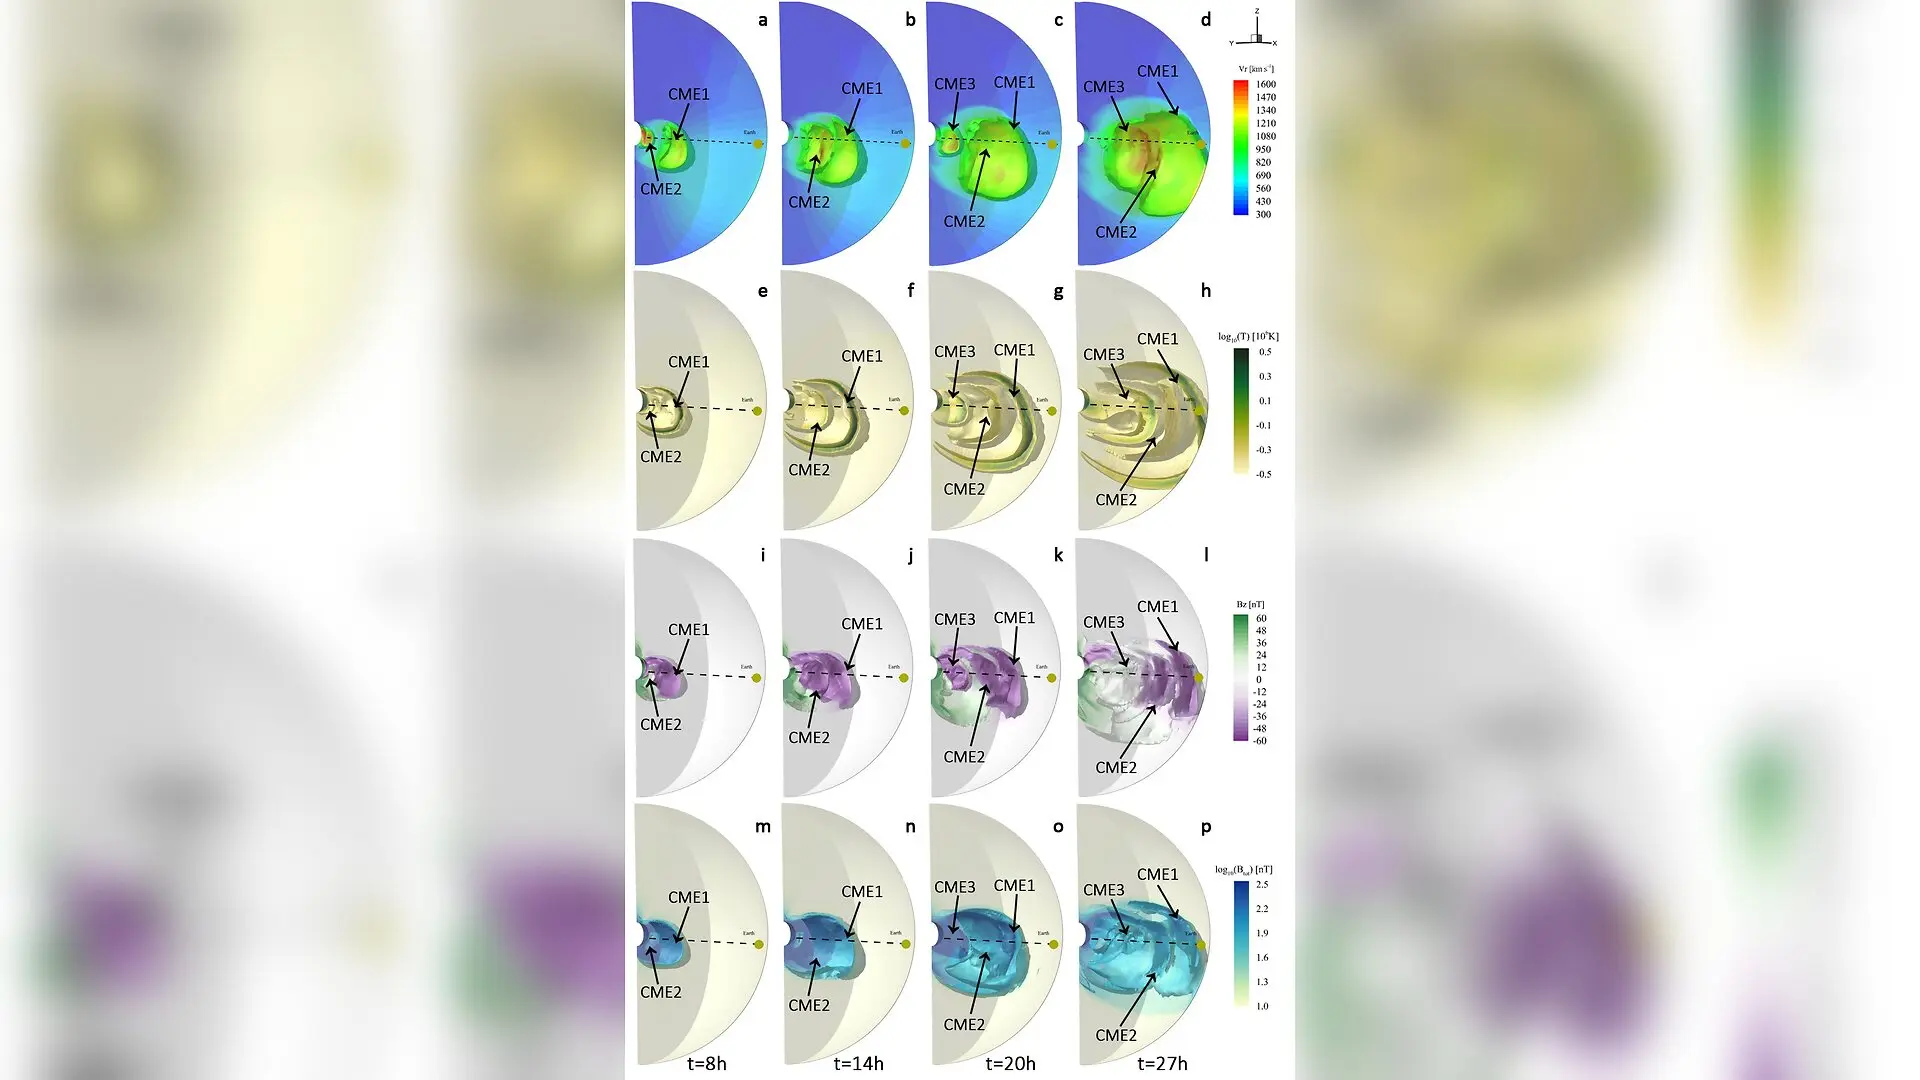
Propagation and interaction of the three CMEs from 20 RsR_{s} to 250 RsR_{s}. Panels a-d show the radial velocity (VrV_{r}), panels e-h present the temperature (TT), panels i-l display the southward magnetic field component (BzB_{z}), and panels m-p show the total magnetic field strength (BtotB_{\rm tot}) at different times for the case labeled “Merged CME1 and CME2”. An animation of this figure is available. The animation runs in parallel (mosaicked into three rows) to compare three different cases simultaneously: the “Merged CME 1 and CME 2” scenario, the “Squeezed CME 1 and CME 2” scenario, and the “Only CME 1” scenario. It displays the evolution of the radial velocity (VrV_{r}), temperature (TT), magnetic field component (BzB_{z}), and total magnetic field strength (BtotB_{\rm tot}) in the interplanetary space from 20 RsR_{s} to 250 RsR_{s}. Ziwei Wang et al. / arXiv

When giant eruptions from the Sun collide in deep space, they can flatten into pancake shapes and squeeze their internal magnetic fields to extreme levels that trigger severe disruptions back on Earth. An international team of researchers investigated how multiple solar storms interact during interplanetary travel, focusing on the historic sequence of events on May 8 and 9, 2024, that ultimately generated the most powerful geomagnetic storm in over two decades.

Coronal mass ejections, or CMEs, are colossal clouds of magnetized plasma weighing between 10 to the 15th and 10 to the 16th grams that blast outward from the solar atmosphere into the heliosphere. Space weather forecasters know that when these erupting plasma clouds carry a southward-pointing magnetic field, they can efficiently couple with Earth’s magnetic shield and cause intense geomagnetic storms that threaten power grids, satellite communications, and navigation systems. However, predicting the exact intensity of these storms has remained a persistent challenge because successive solar eruptions frequently crash into one another during their journey across interplanetary space, altering their internal structures in complex ways.

To uncover the driving physical mechanisms behind these intense fields, the authors combined multi-spacecraft observations with high-resolution numerical simulations published in an arXiv preprint. The team tracked three consecutive coronal mass ejections originating from solar active region 13664, reconstructing their three-dimensional shapes using coronagraph data from the Solar and Heliospheric Observatory and the Solar Terrestrial Relations Observatory. They implemented a sophisticated solar wind model featuring adaptive mesh refinement to simulate the propagation of the plasma structures all the way from the solar corona to Earth at one astronomical unit.
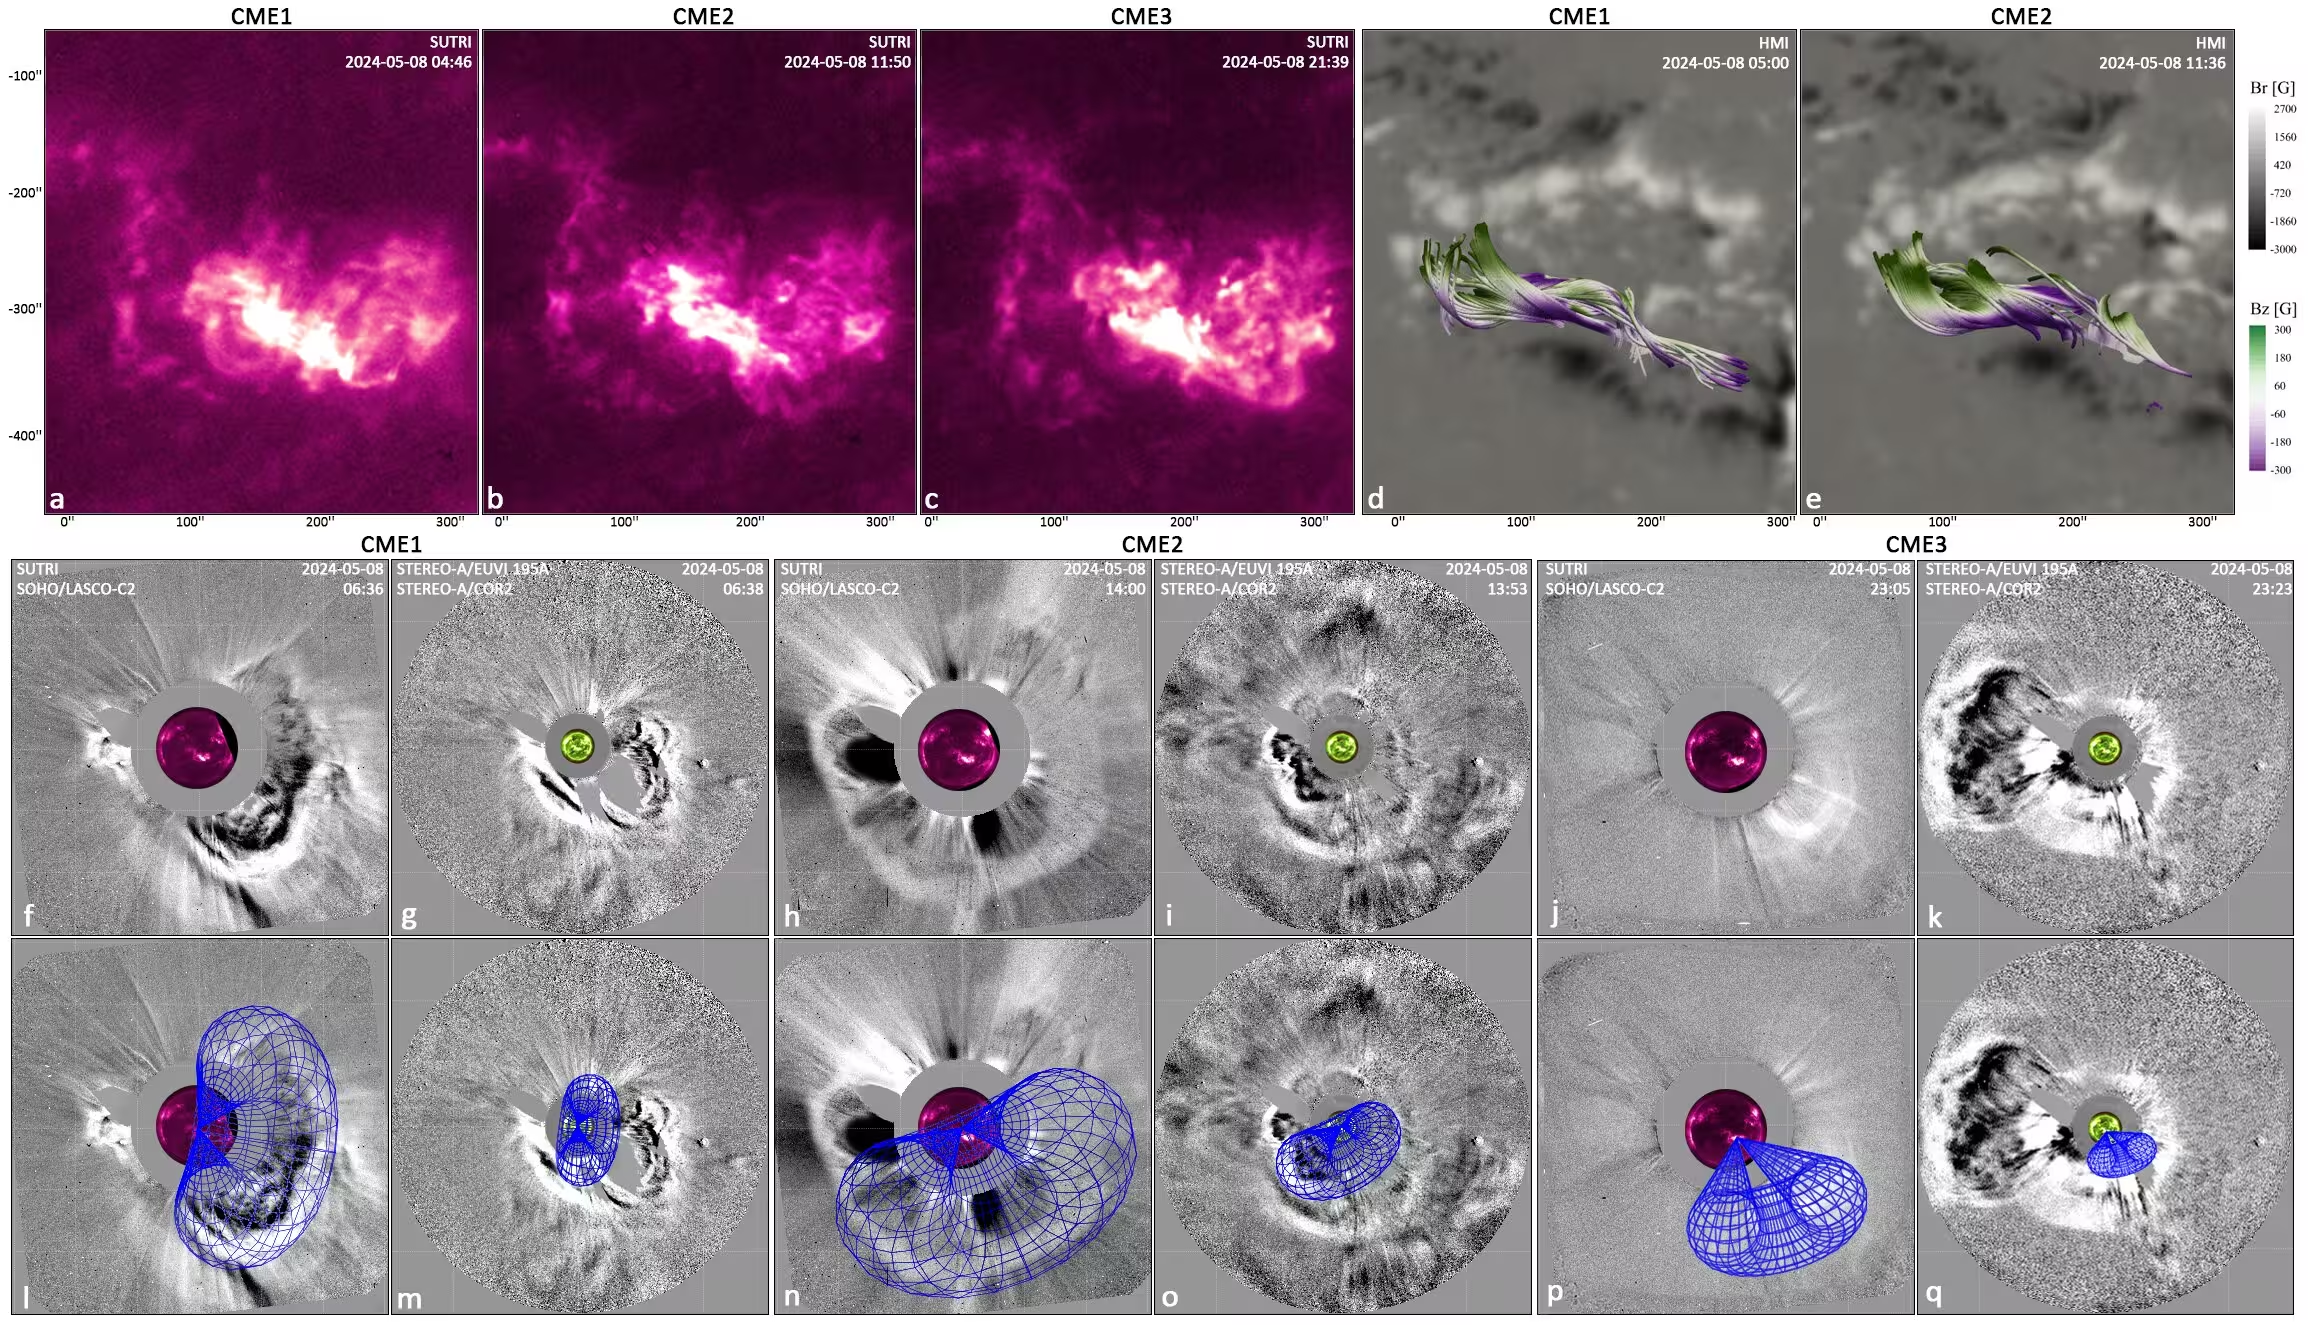
Figure 1: Eruption and propagation of CME1, CME2, and CME3 in the solar corona. Panels a-c show the EUV imagery from SUTRI for each event on 8 May 2024. Panels d and e present field lines overlaid on the SHARP (Space‑weather HMI Active Region Patch) magnetogram. The field lines are derived from NLFFF extrapolations, revealing flux-rope structures. The color of the field lines indicates the z−z-component of the magnetic field BzB_{z}. Panels f-k display running-difference images of CME1, CME2, and CME3 from SOHO/LASCO-C2 and STEREO-A/COR2, together with EUV observations from SUTRI and STEREO-A/EUVI 195  Å. Panels l-q illustrate the fitted GCS model overlaid as blue wireframes based on the observations in panels f-k. An animation of this figure is available. It shows the EUV observations from SDO/AIA 94 Å depicting the eruption of the three successive CMEs from AR 13664 on 2024 May 8.
Eruption and propagation of CME1, CME2, and CME3 in the solar corona. Panels a-c show the EUV imagery from SUTRI for each event on 8 May 2024. Panels d and e present field lines overlaid on the SHARP (Space‑weather HMI Active Region Patch) magnetogram. The field lines are derived from NLFFF extrapolations, revealing flux-rope structures. The color of the field lines indicates the z−z-component of the magnetic field BzB_{z}. Panels f-k display running-difference images of CME1, CME2, and CME3 from SOHO/LASCO-C2 and STEREO-A/COR2, together with EUV observations from SUTRI and STEREO-A/EUVI 195  Å. Panels l-q illustrate the fitted GCS model overlaid as blue wireframes based on the observations in panels f-k. An animation of this figure is available. It shows the EUV observations from SDO/AIA 94 Å depicting the eruption of the three successive CMEs from AR 13664 on 2024 May 8. Credit: Ziwei Wang et al. / arXiv

How Do Successive Solar Eruptions Create Extreme Magnetic Fields?

By comparing different numerical scenarios involving matching and reversed magnetic orientations, the investigators discovered that mutual physical squeezing between colliding plasma clouds plays the dominant role in amplifying and sustaining southward magnetic fields. When a faster trailing eruption catches up to a slower preceding eruption, it exerts tremendous dynamic pressure, compressing the front structure from a bulky cloud into a flattened pancake shape. This mechanical squeezing prevents the normal expansion-induced decay that usually weakens magnetic fields as they travel through interplanetary space.

The analysis revealed that the interaction unfolds in distinct stages driven by shifting physical pressures. Initially, the dynamic pressure of the oncoming plasma cloud serves as the primary compressive force. Once the two structures travel at roughly matched speeds, the interface between them maintains high magnetic and thermal pressures that sustain the compressed state over long distances. In the modeled event representing the May 2024 storm, this sustained squeezing maintained a southward magnetic field magnitude exceeding 60 nanoteslas near Earth, roughly doubling the field strength compared to a control scenario with a single isolated eruption.
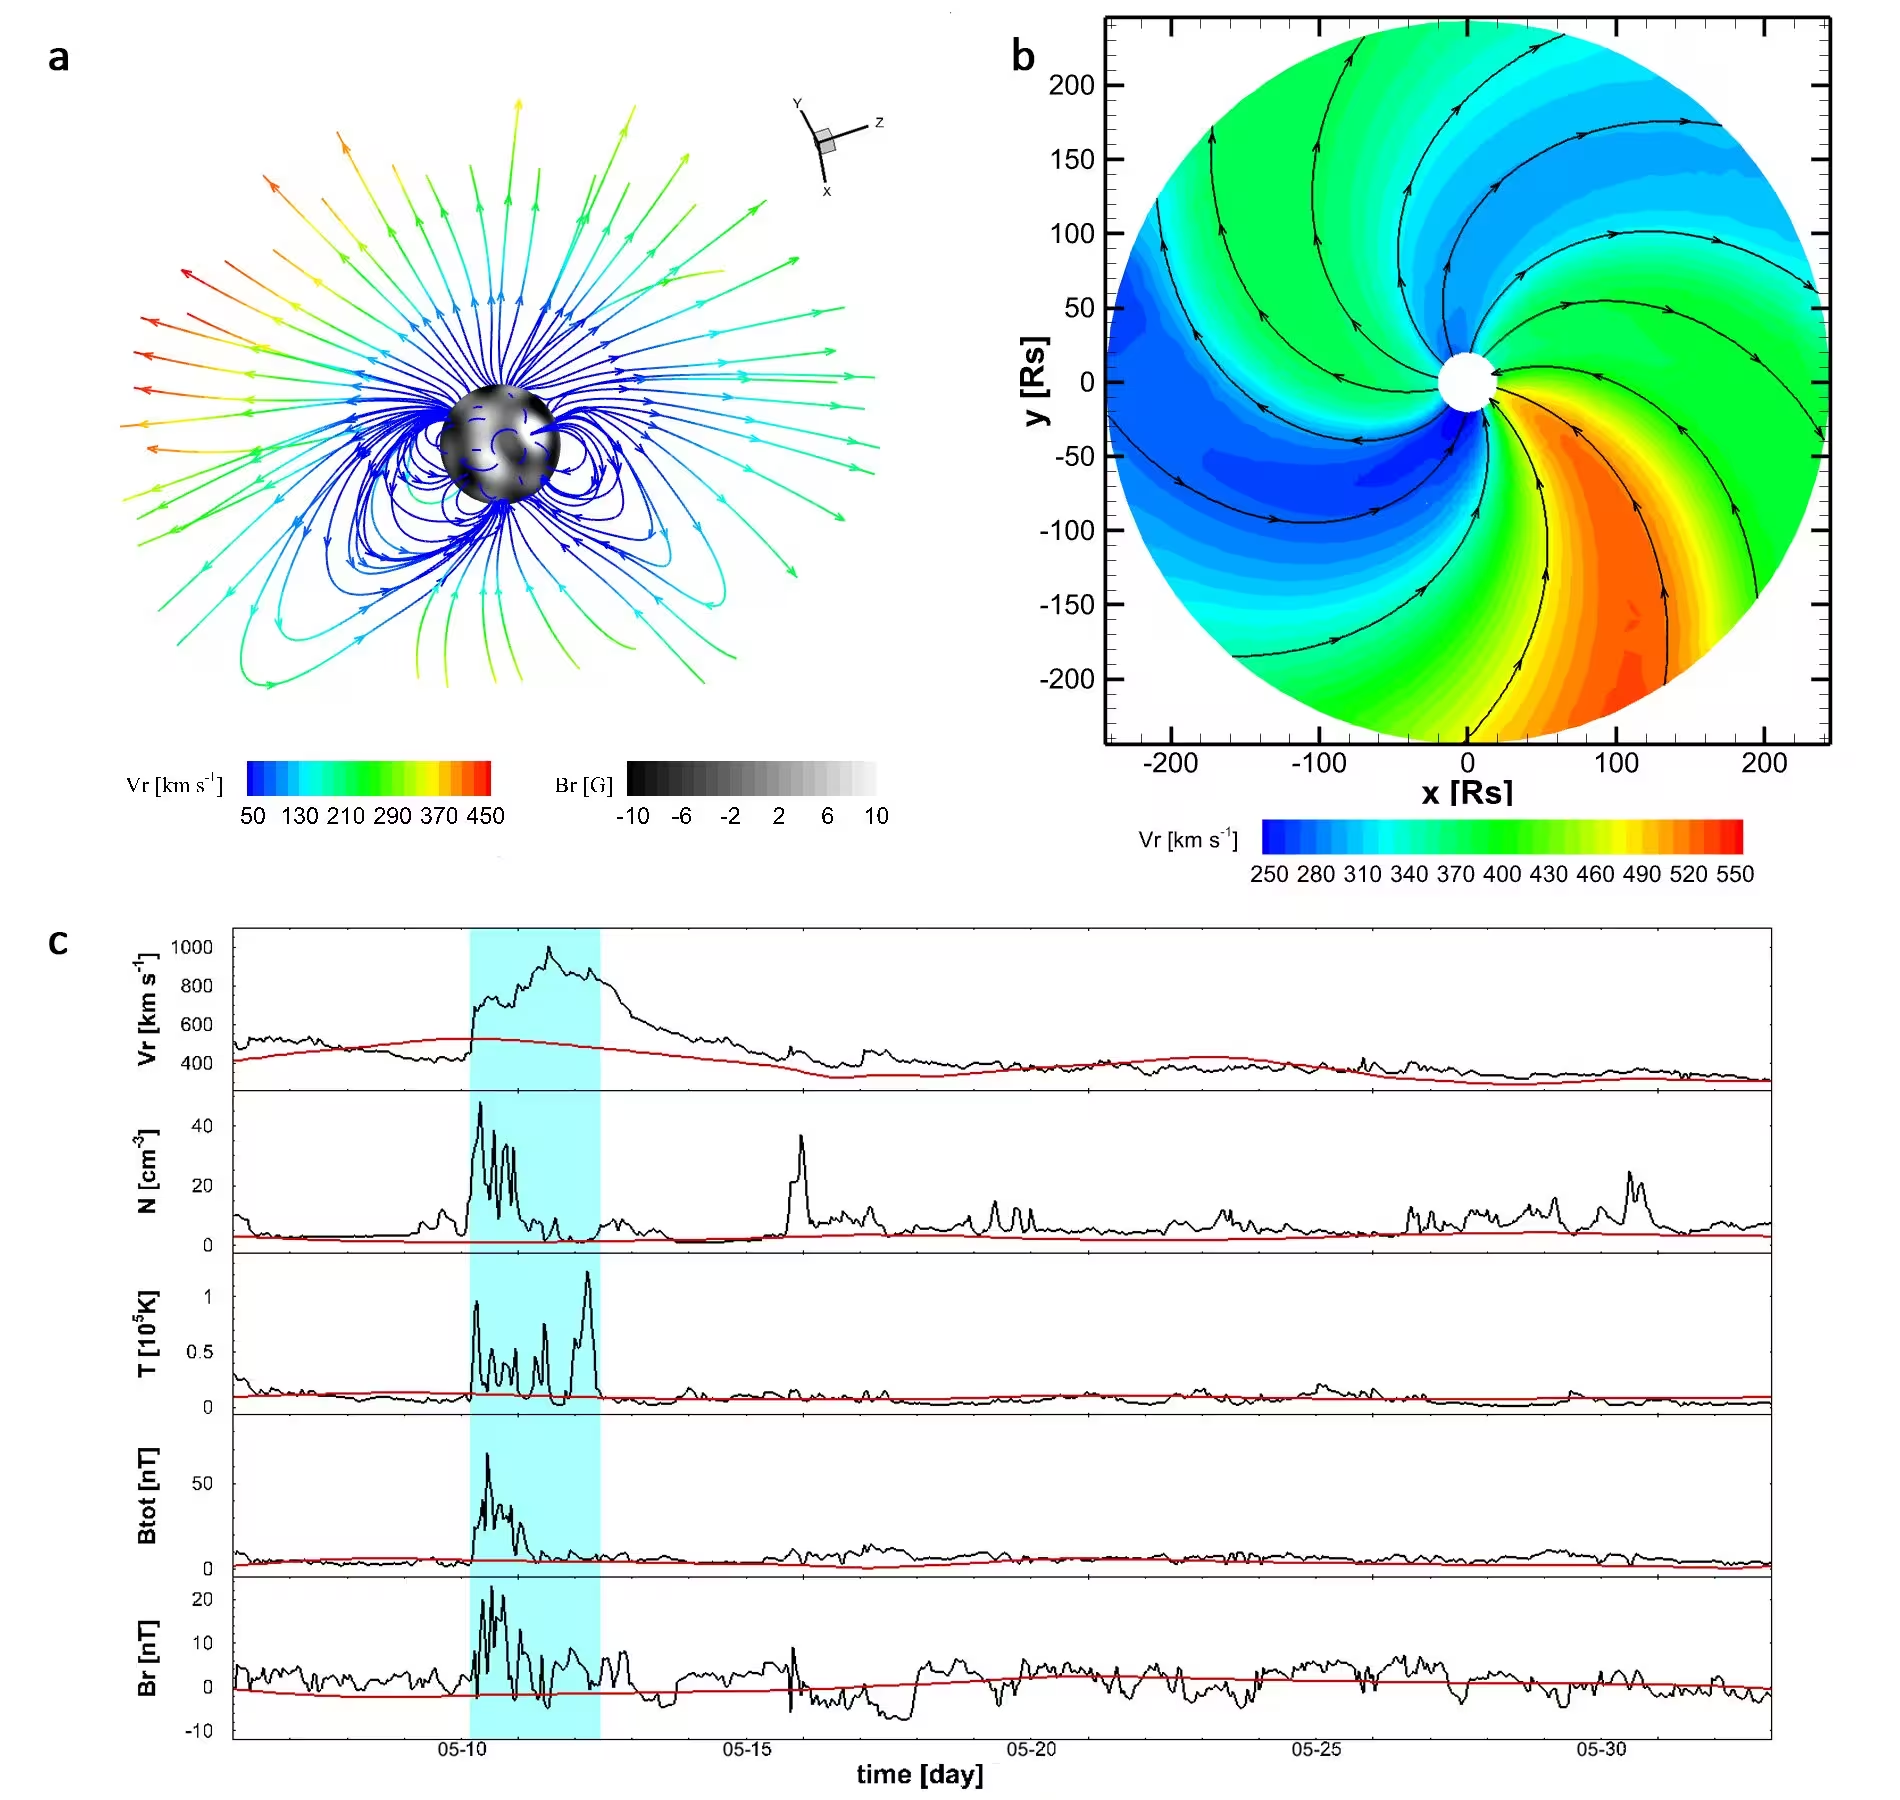
Figure 2: Background solar wind simulation results. Panel a shows the distribution of three-dimensional magnetic field lines from 1 to 6 RsR_{s}. Panel b shows the velocity distribution in the ecliptic plane within 20–215 RsR_{s}. Panel c presents the time series comparison between the simulated results (radial velocity VrV_{r}, number density NN, temperature TT, total magnetic field strength Bt​o​tB_{tot}, and radial magnetic field component BrB_{r}) and the OMNI data. The simulated results are shown as red solid lines, and the OMNI data as black solid lines. The shaded regions indicate the intervals of CME disturbances at 1 AU.
Background solar wind simulation results. Panel a shows the distribution of three-dimensional magnetic field lines from 1 to 6 RsR_{s}. Panel b shows the velocity distribution in the ecliptic plane within 20–215 RsR_{s}. Panel c presents the time series comparison between the simulated results (radial velocity VrV_{r}, number density NN, temperature TT, total magnetic field strength Bt​o​tB_{tot}, and radial magnetic field component BrB_{r}) and the OMNI data. The simulated results are shown as red solid lines, and the OMNI data as black solid lines. The shaded regions indicate the intervals of CME disturbances at 1 AU. Credit: Ziwei Wang et al. / arXiv

What Does This Mean for Future Space Weather Forecasting?

The resulting complex interplanetary structure slammed directly into Earth, driving a disturbance that produced a minimum Disturbed Storm Time index of approximately minus 412 nanoteslas. This extreme value accounts for why the May 2024 storm reached a severe Kp index of 9, matching the intensity of historical superstorms. The findings demonstrate that CME-CME interactions are not merely chaotic collisions, but follow discernible physical rules where the degree of squeezing directly scales with the resulting magnetic field amplification.

The authors note several technical limitations in their current model, including minor discrepancies in arrival times at Earth and the complexity of isolating every contributing factor from limited observational vantage points. Future work will require statistical surveys across multiple solar events using advanced heliospheric imagers and refined numerical models to improve space weather forecasting accuracy for extreme geomagnetic hazards.

The study was posted to the arXiv preprint server on November 13, 2026.

Fact Checked

This article has been fact checked for accuracy, with information verified against reputable sources. Learn more about us and our editorial process.

Last reviewed on .

Article history

  • Latest version

Reference(s)

  1. Wang, Ziwei. “Squeezing Drives Southward Magnetic Field Enhancement During 10 May 2024 CME-CME Interaction.” arXiv.org <http://arxiv.org/abs/2611.17807v1>.

Cite this page:

Rehman, Nida. “How Flattened Space Pancakes Drive Earth’s Most Extreme Solar Storms.” BioScience. BioScience ISSN 2521-5760, 16 November 2026. <https://www.bioscience.com.pk/en/subject/astronomy/squeezing-drives-southward-magnetic-field-enhancement-during-10-may-2024-cme-cme-interaction>. Rehman, N. (2026, November 16). “How Flattened Space Pancakes Drive Earth’s Most Extreme Solar Storms.” BioScience. ISSN 2521-5760. Retrieved November 16, 2026 from https://www.bioscience.com.pk/en/subject/astronomy/squeezing-drives-southward-magnetic-field-enhancement-during-10-may-2024-cme-cme-interaction Rehman, Nida. “How Flattened Space Pancakes Drive Earth’s Most Extreme Solar Storms.” BioScience. ISSN 2521-5760. https://www.bioscience.com.pk/en/subject/astronomy/squeezing-drives-southward-magnetic-field-enhancement-during-10-may-2024-cme-cme-interaction (accessed November 16, 2026).
End of the article