Single Sensor Forecasts Towering Rogue Waves 38 Wave Periods Early
Mathematicians and oceanographers combined deep learning and wave equations to predict destructive water walls from sparse point observations.
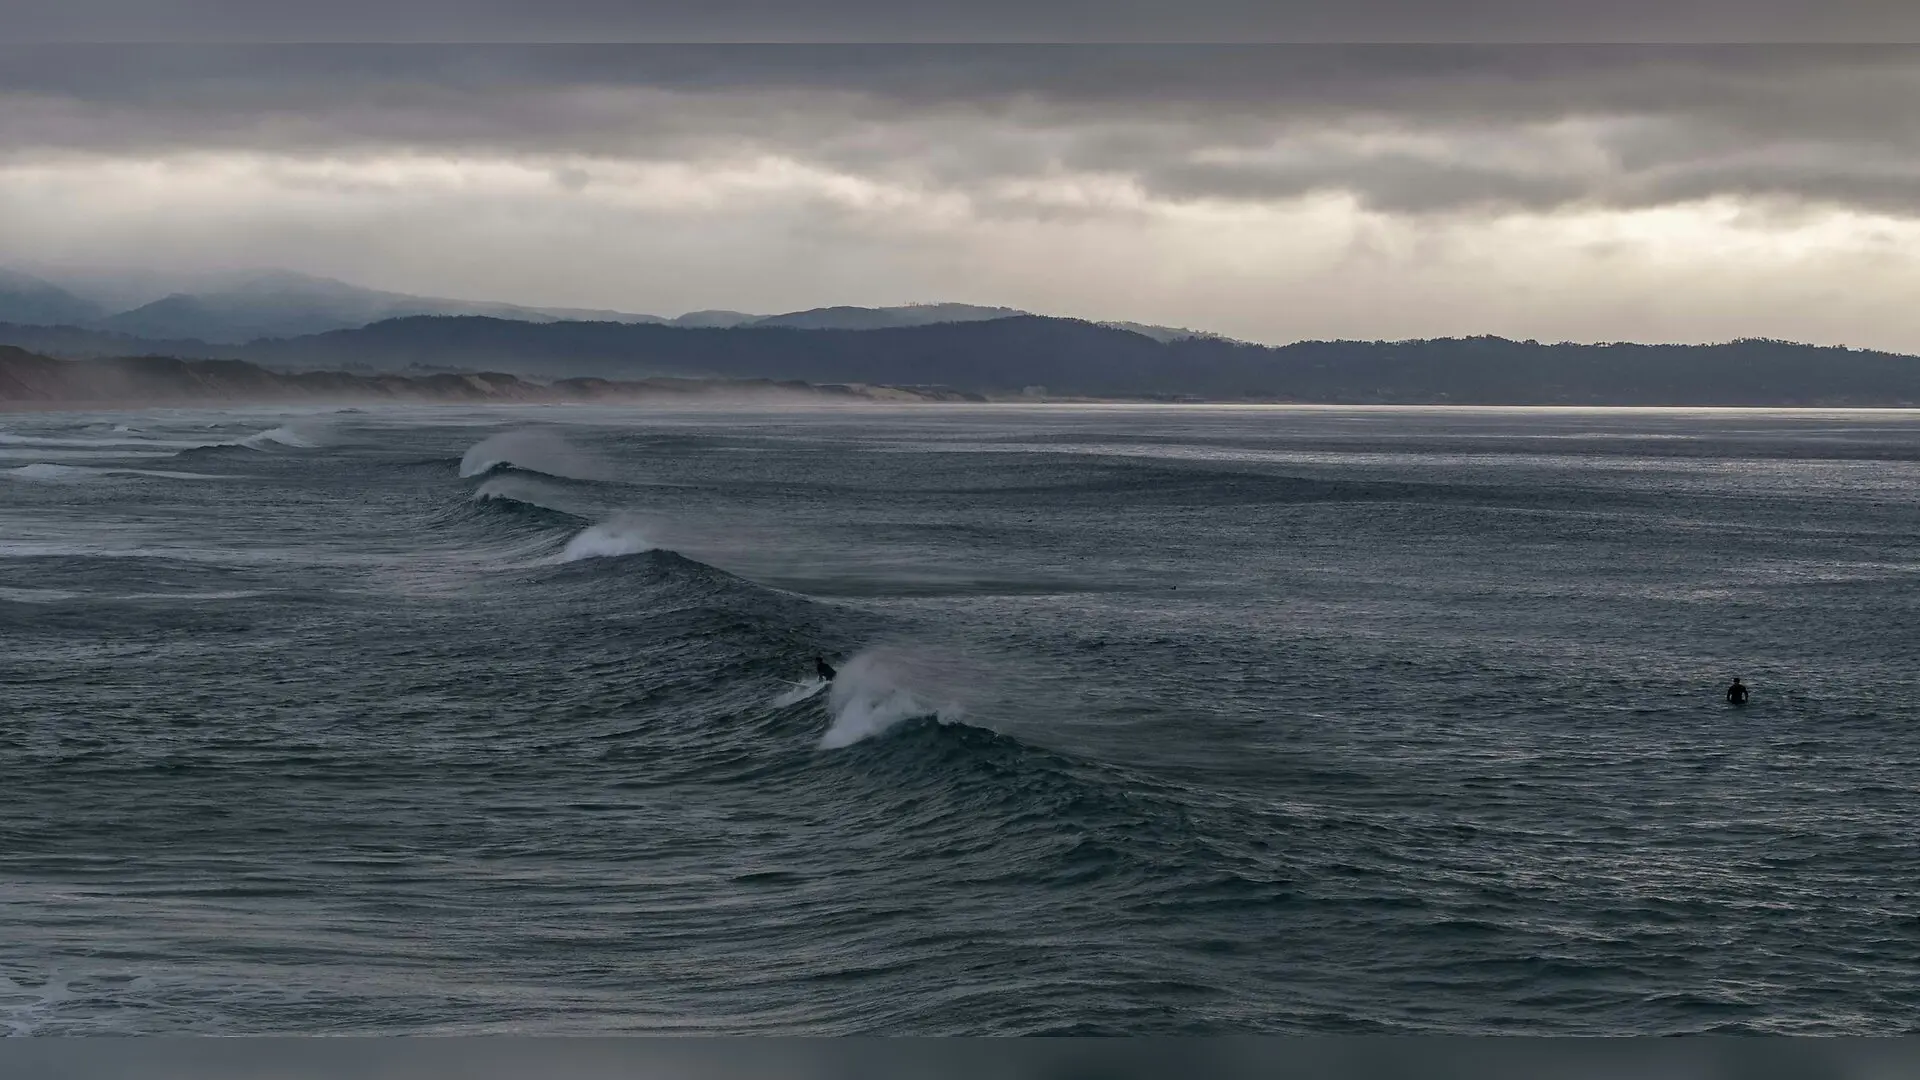
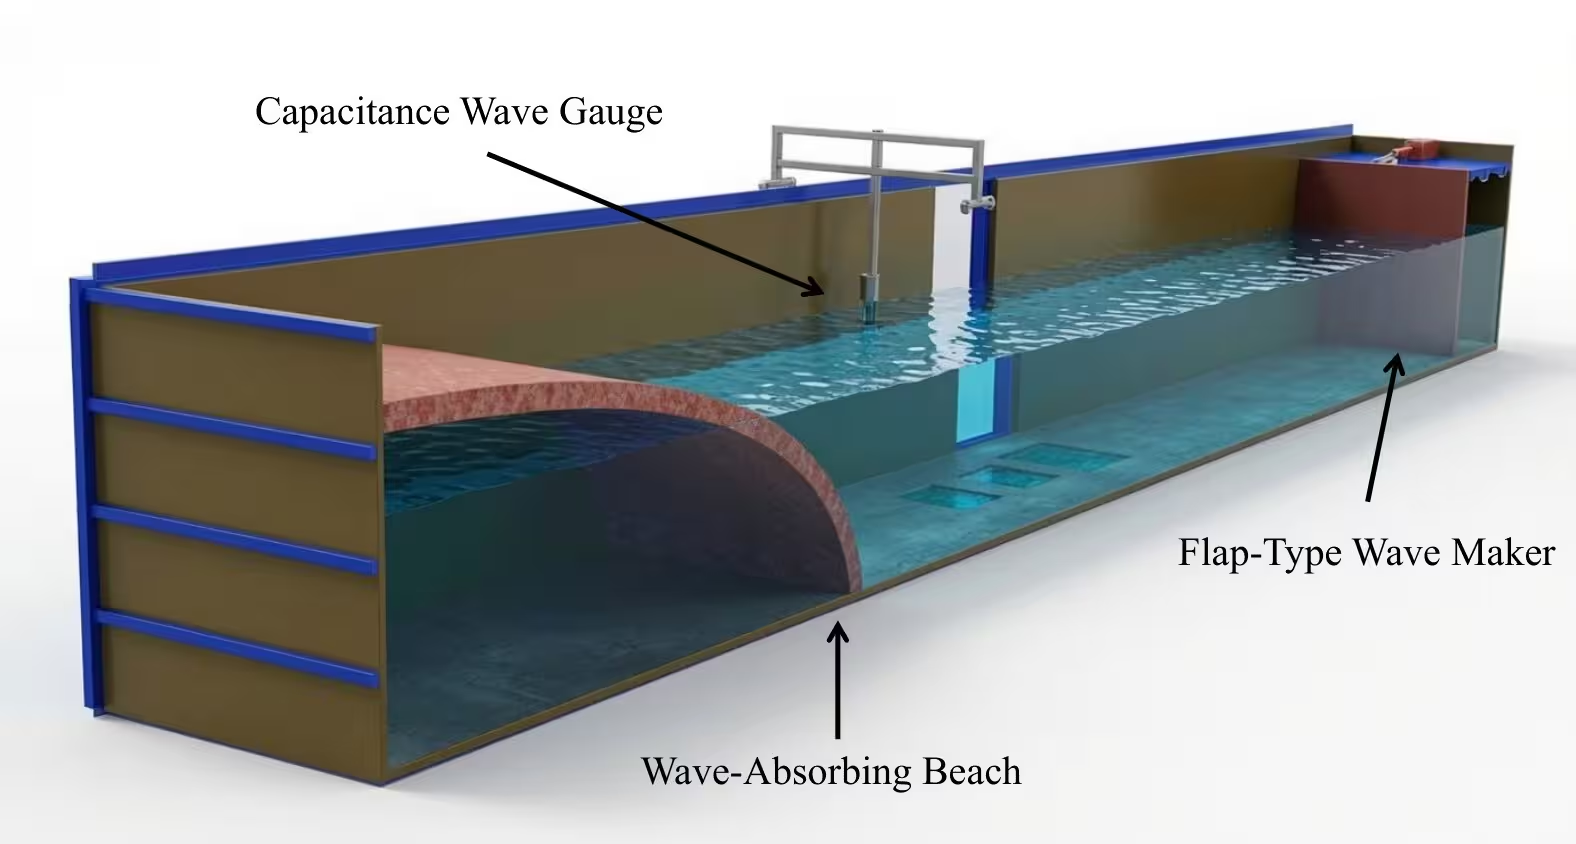
A single stationary sensor placed inside a 15-meter-long water tank successfully recorded data that allowed researchers to forecast towering rogue waves up to 38 wave periods in advance. Oceanographers and mathematicians have long struggled to predict these sudden, destructive walls of water because they emerge from deep water without any obvious warning signs.
How Can One Sensor Predict a Giant Wave?
In a controlled study published in arXiv, researchers Zachary T. Hilliard, Amin Chabchoub, and Mohammad Farazmand demonstrated that sparse point observations can reconstruct an entire evolving wave field. While traditional mathematics states that dissipative systems can be mapped from a single time series using delay-coordinate embedding, water wave tanks represent a conservative system where direct reconstruction is exceptionally difficult.
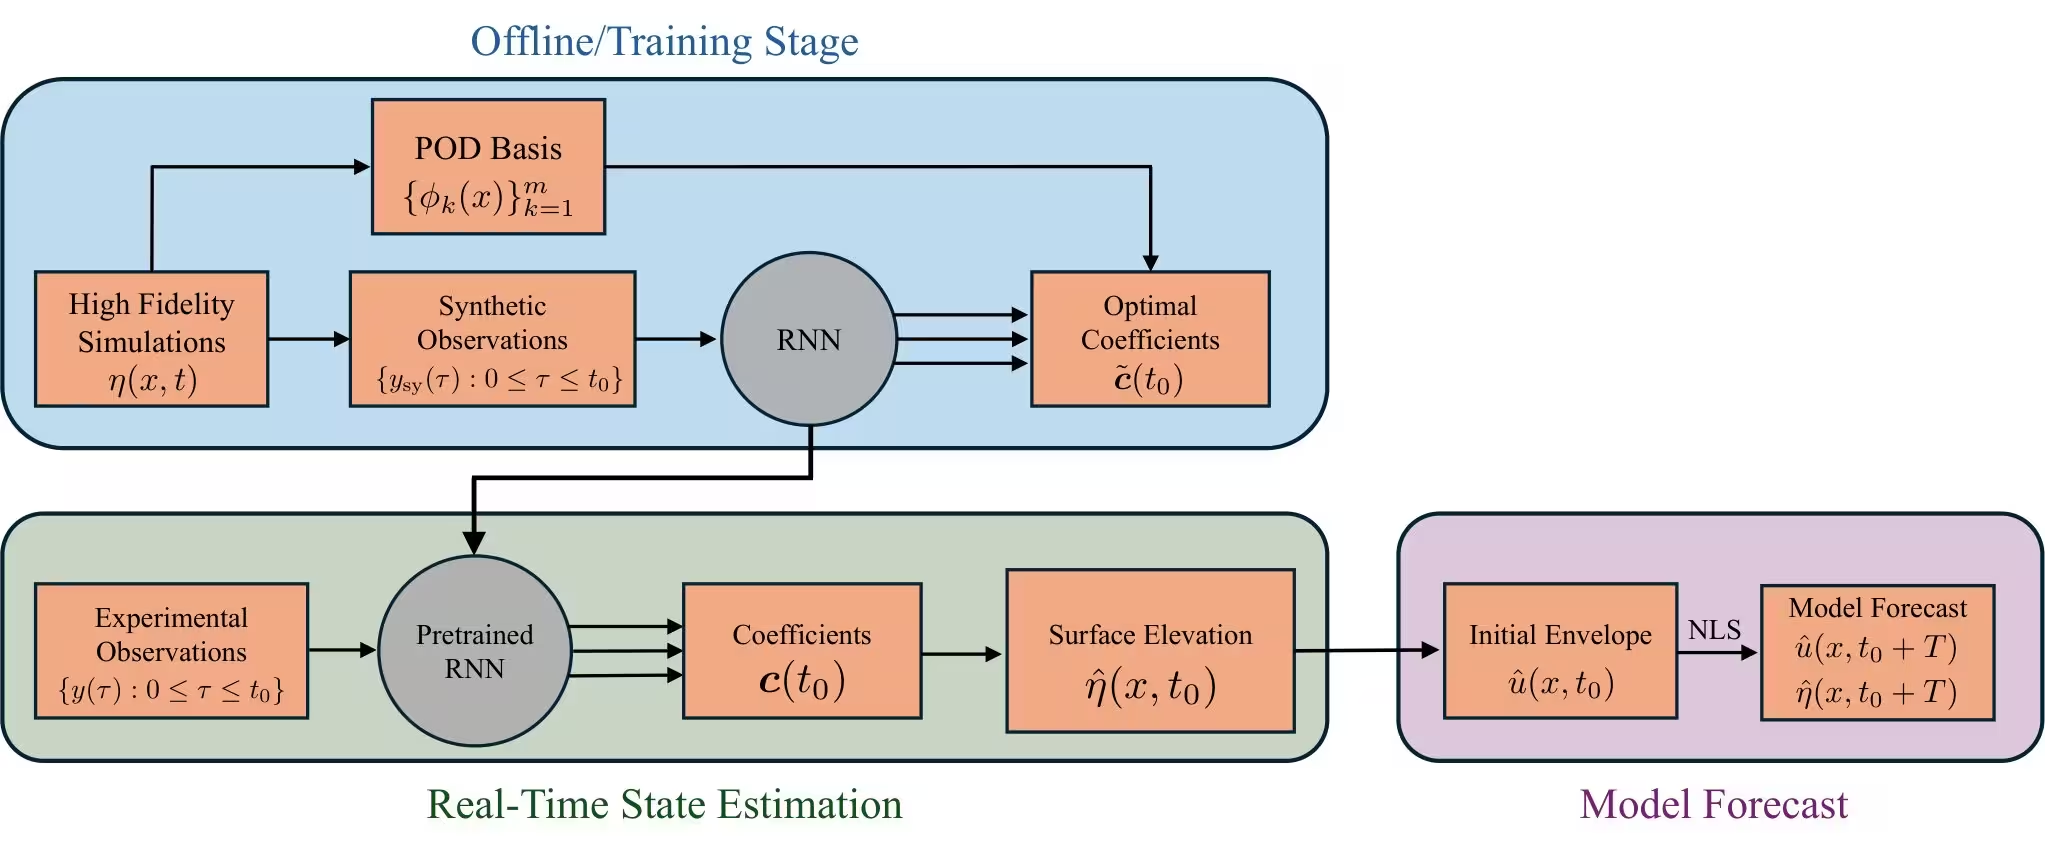
To overcome this limitation, the team combined deep learning, compressed sensing, and mathematical scaling symmetries. They trained a recurrent neural network using synthetic data that simulated wave tank experiments governed by the nonlinear Schrödinger equation, a fundamental mathematical model for slowly modulating deep-water waves.
The training dataset comprised 121 numerical solutions representing two-soliton dynamics, which are known to mimic extreme wave formations. By shifting these simulations into a co-moving frame that travels alongside the wave group velocity, the team avoided the slow error decay typically plaguing such spatial systems.
Testing the Forecast Against Laboratory Reality
The researchers fed time-series water elevation data gathered from a single sensor located 1.8 meters away from the wave maker into their pre-trained neural network. The network output predicted specific proper orthogonal decomposition coefficients, which describe the spatial structure of the wave field.
Using the Hilbert transform and a Fourier-based phase optimization routine, the team translated these surface elevations into a precise wave envelope. This reconstructed envelope then served as the initial condition for the nonlinear Schrödinger equation to forecast downstream wave propagation across eight additional sensor locations spaced one meter apart.
When the predicted values were compared against actual measurements in the wave tank, the results showed remarkable accuracy. The framework successfully forecast an upcoming rogue wave 14 seconds before it peaked, corresponding to roughly 38 wave periods in advance.
What Are the Margins of Error and Future Steps?
The forecasted wave heights and arrival timings matched laboratory observations with very tight error margins. At the seventh sensor location, where the rogue wave reached its maximum height at around 18 seconds, the model predicted the wave amplitude with an error of approximately 8 percent.
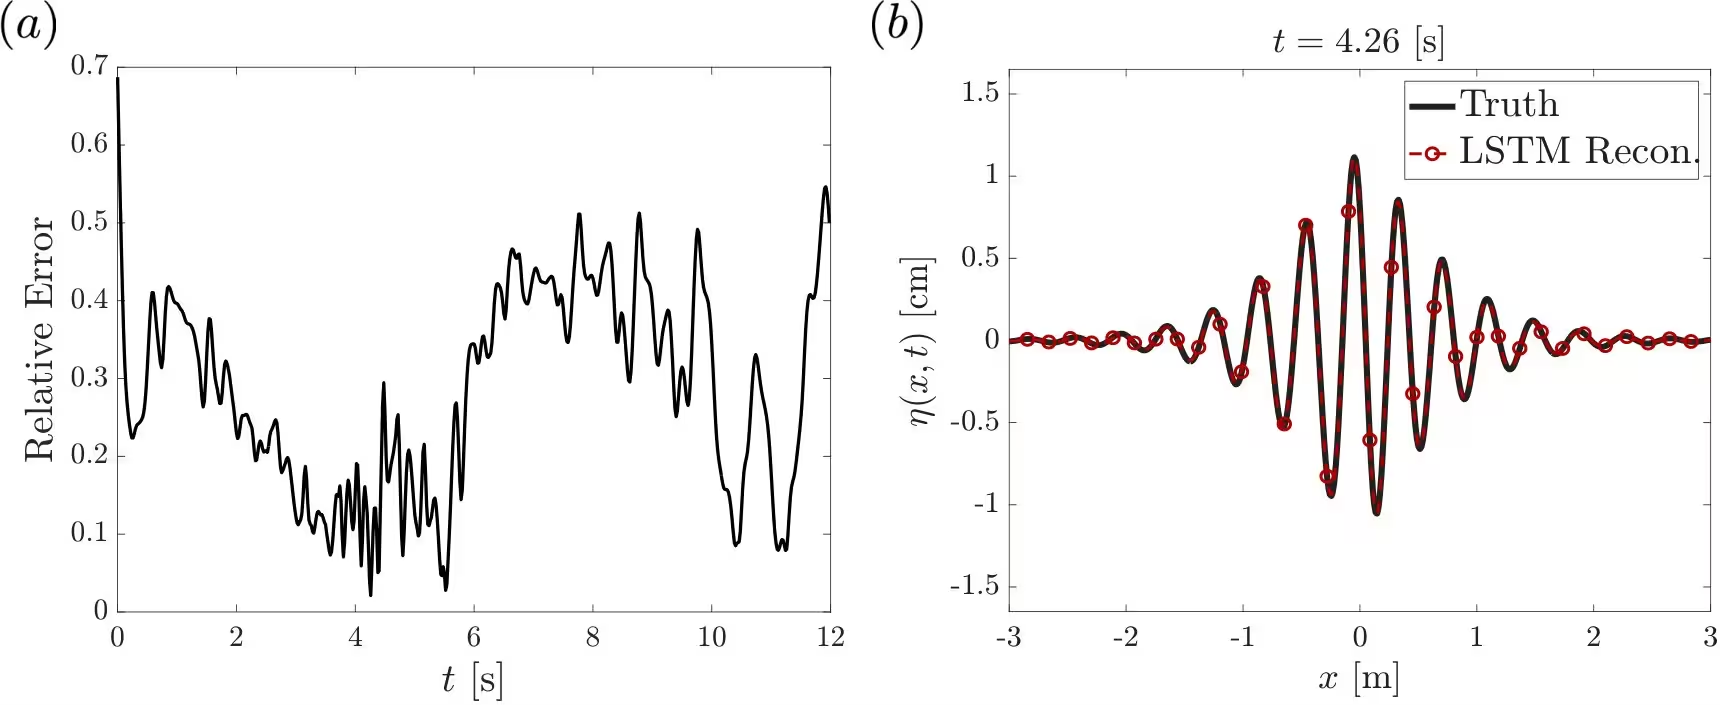
Even more impressively, the timing of the extreme wave formation was predicted with an accuracy of roughly 0.5 percent error. The authors note that minor discrepancies between forecasts and experimental observations stem primarily from higher-order physical effects ignored by the baseline model, such as mean flow effects and amplitude-dependent corrections to group velocity.
While the laboratory tests were limited to unidirectional, narrow-band waves, the authors suggest that extending this framework to broadband and directionally spread ocean waves is an important next step. The underlying methodology could ultimately apply to other nonlinear dispersive systems where extreme events emerge from the interplay between dispersion and nonlinearity.
The study was posted to the arXiv preprint server on November 16, 2026.
This article has been fact checked for accuracy, with information verified against reputable sources. Learn more about us and our editorial process.
Last reviewed on .
Article history
- Latest version
Reference(s)
- Hilliard, Zachary. “Reconstruction and Forecast of Extreme Waves from a Single Observation.” arXiv.org <http://arxiv.org/abs/2611.21068v1>.
Cite this page:
- Posted by Kamran Akhtar