North Sea Study Maps Hidden Distribution of Key Seabird Prey
Combining two decades of complex fisheries data reveals shifting biomass patterns for sandeels and sprats across the Greater North Sea.
Millions of seabirds across the North Sea depend on tiny schooling fish known as forage fish, yet researchers have long struggled to map where these prey species actually live across fine spatial and temporal scales. A team of scientists led by Sylvan Benaksas from the University of Sheffield tackled this persistent ecological blind spot by combining multiple large-scale fisheries surveys spanning a twenty-one-year period from 2000 to 2020. The resulting models offer unprecedented detail on the hidden distribution patterns of two vital seabird meal sources, the lesser sandeel (published in Ecology and Evolution), and the European sprat.
How Researchers Combined Disparate Fisheries Data Across the North Sea
Studying forage fish dynamics has historically proved challenging because traditional survey methods were never designed to capture every species equally. Lesser sandeels (Ammodytes marinus) spend months buried in the seabed sediment and lack swim bladders, making them nearly invisible to standard acoustic echo-sounders. European sprats (Sprattus sprattus) swim higher in the water column and are sampled differently through acoustic surveys and bottom trawls.
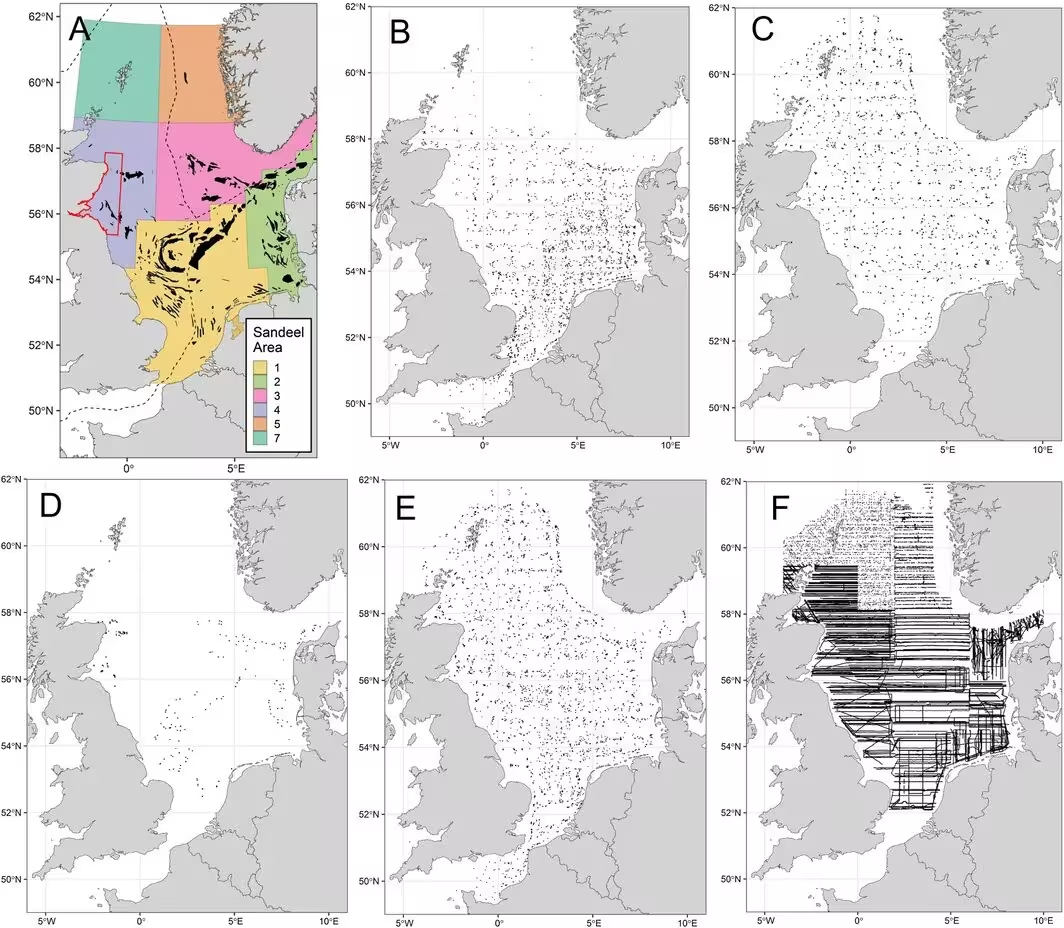
To overcome these hurdles, the research team employed hierarchical Bayesian spatiotemporal models using a computational method called Integrated Nested Laplace Approximation. They pooled data from winter dredge surveys, acoustic monitoring campaigns, and bottom trawl programs administered by the International Council for the Exploration of the Sea. By correcting for catchability differences and adjusting for gear efficiency, the authors generated robust biomass estimates across the entire Greater North Sea basin on a ten-kilometer grid.
What Environmental Factors Control Forage Fish Populations?
The statistical models revealed distinct environmental preferences governing where each fish species thrives. For sandeel populations, seabed characteristics and depth proved critical, with biomass clustering heavily in shallow coastal waters less than 75 meters deep where sandy substrates allow the fish to burrow safely. The authors found that sandeel distribution was negatively associated with fine silt and high mixed layer depths, but positively linked to seabed slope and dissolved oxygen levels.
European sprat distributions showed different environmental drivers, displaying high densities in waters shallower than 200 meters where phytoplankton concentrations exceeded 8 millimoles per cubic meter. Unlike sandeels, which remained relatively tied to fixed sandbank habitats, sprat populations exhibited considerable mobility and dynamic shifts across the marine environment over the two-decade study window.
Where Are These Crucial Fish Populations Expanding or Declining?
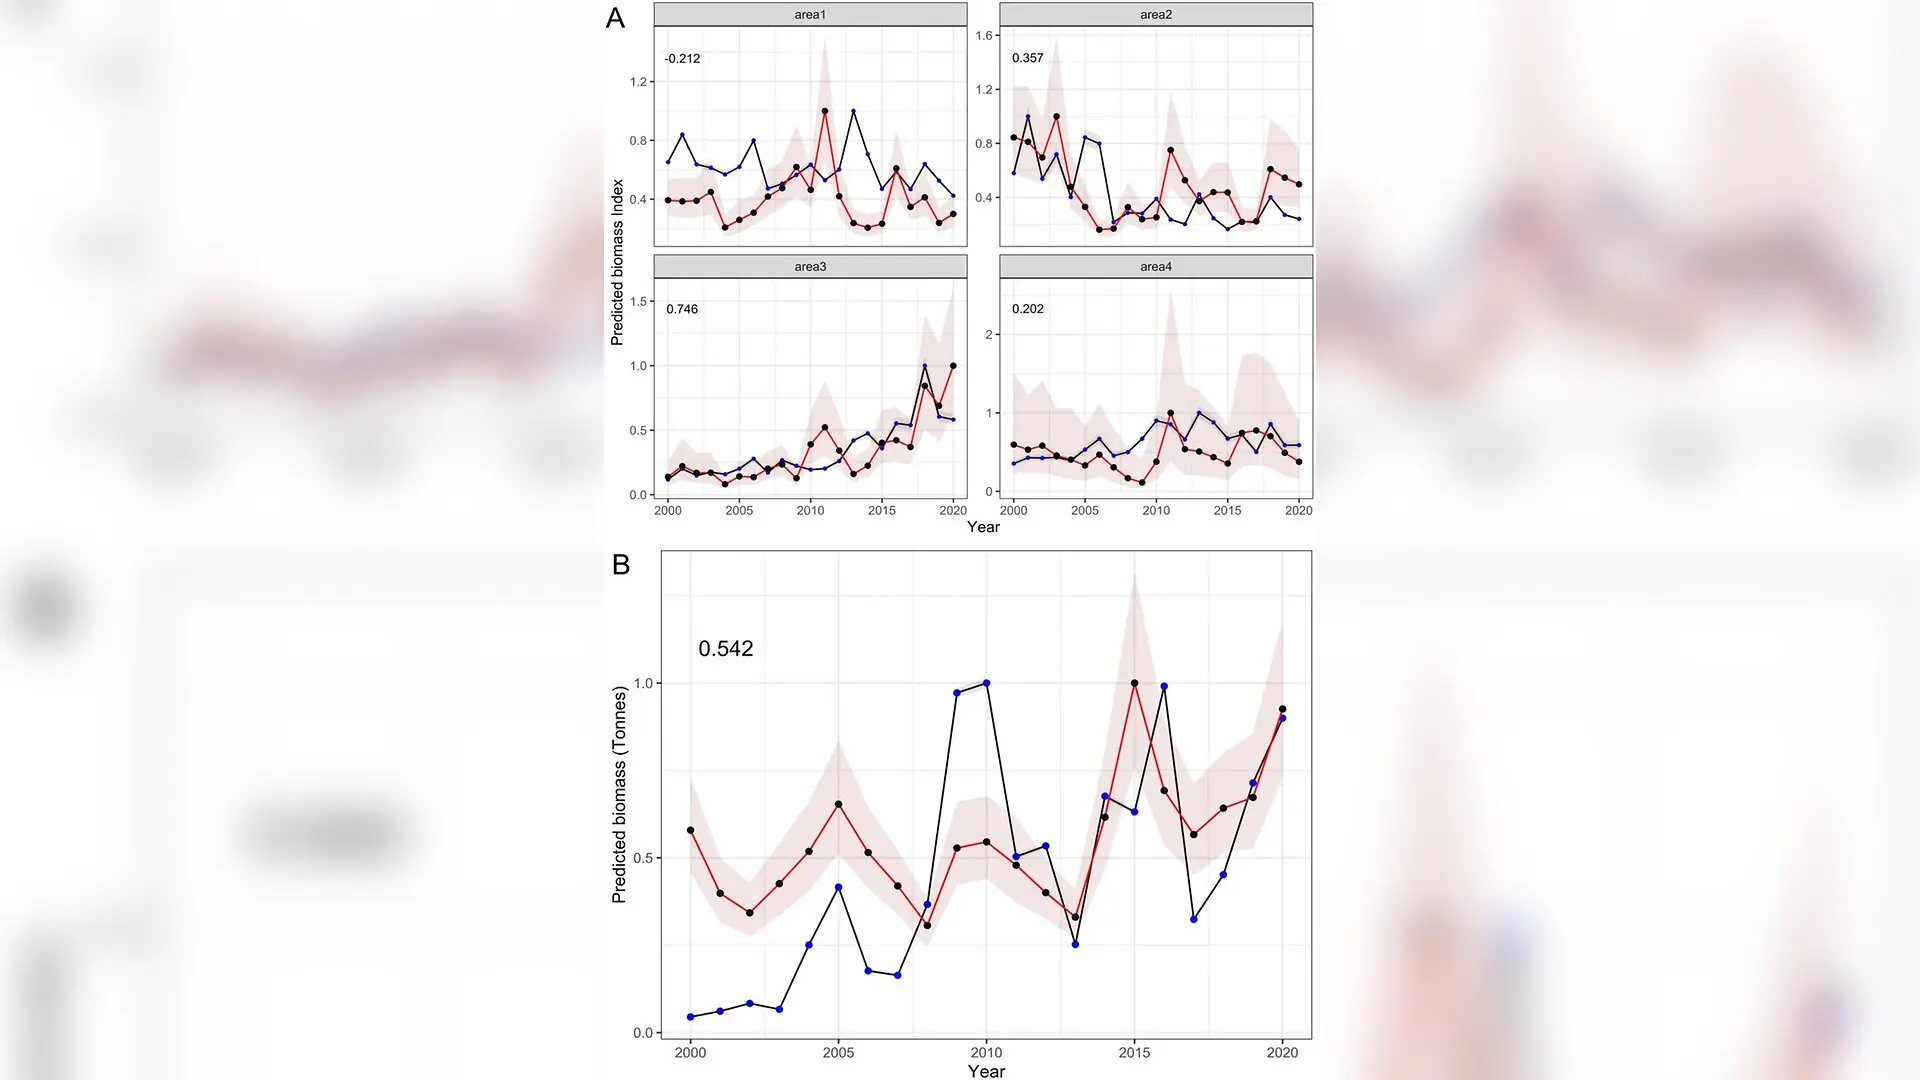
The regional trends uncovered by the models show striking contrasts between the two species. Sandeel biomass fluctuated wildly through boom and bust cycles characteristic of short-lived forage fish, with significant regional variations. While populations increased notably in Management Area 3 within the Norwegian Exclusive Economic Zone following targeted local management, they declined across Areas 1 and 2 and fluctuated in Area 4 off Scotland.
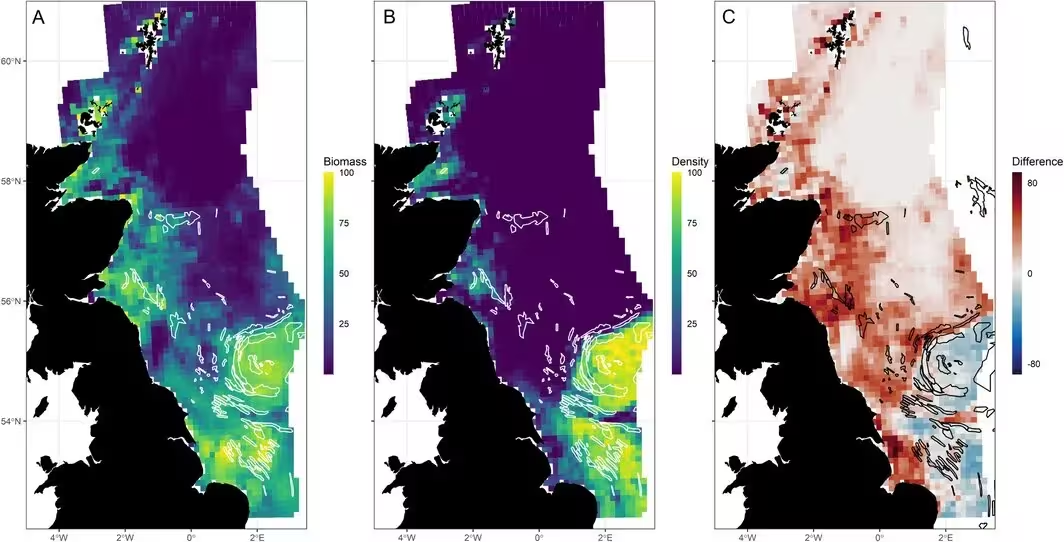
By contrast, European sprat biomass showed a broad upward trend across the North Sea over the twenty-one-year timeline. The models tracked a gradual northward and westward expansion of sprat populations, moving from initial concentrations in the south-eastern North Sea toward the United Kingdom coast and into waters near Aberdeen Bay and the southern Moray Firth.
What These Findings Mean for Marine Conservation and Fisheries
The spatial biomass datasets generated in this study provide a foundational tool for marine ecologists trying to understand why seabird populations along the United Kingdom’s east coast have struggled over the past three decades. Breeding seabirds like black-legged kittiwakes (Rissa tridactyla) and various auk species require reliable, high-density prey patches within foraging range of their nesting colonies during the spring and summer breeding seasons.
The authors note important limitations in their approach, including the challenge of combining acoustic and trawl methodologies and the reliance on historical survey data that occasionally required seasonal shifts. Nevertheless, by making their predicted distribution maps openly available to researchers, the team hopes to improve future marine spatial planning, help regulators evaluate the ecosystem effects of commercial fishing closures, and shed light on how climate change may reshape North Sea food webs.
The research was published in Ecology and evolution on November 1, 2026.
This article has been fact checked for accuracy, with information verified against reputable sources. Learn more about us and our editorial process.
Last reviewed on .
Article history
- Latest version
Reference(s)
- Benaksas, Sylvan., et al. “Seabird Prey in Space and Time: Combining Multiple Datasets to Model the Distribution of Sandeel ( Ammodytes marinus ) and Sprat ( Sprattus sprattus ) in the North Sea.” Ecology and Evolution, vol. 16, no. 11, October 29, 2026 Wiley, doi: 10.1002/ece3.74570. <https://doi.org/10.1002/ece3.74570>.
Cite this page:
- Posted by Divya Iyer