Hidden Phytoplankton Chemistry Reveals Why Ocean Oxygen Is Dwindling Faster Than Expected
Cellular adaptation shifts plankton stoichiometry across latitudes, shrinking global oxygen inventories and altering deep-ocean carbon estimates by hundreds of petagrams.
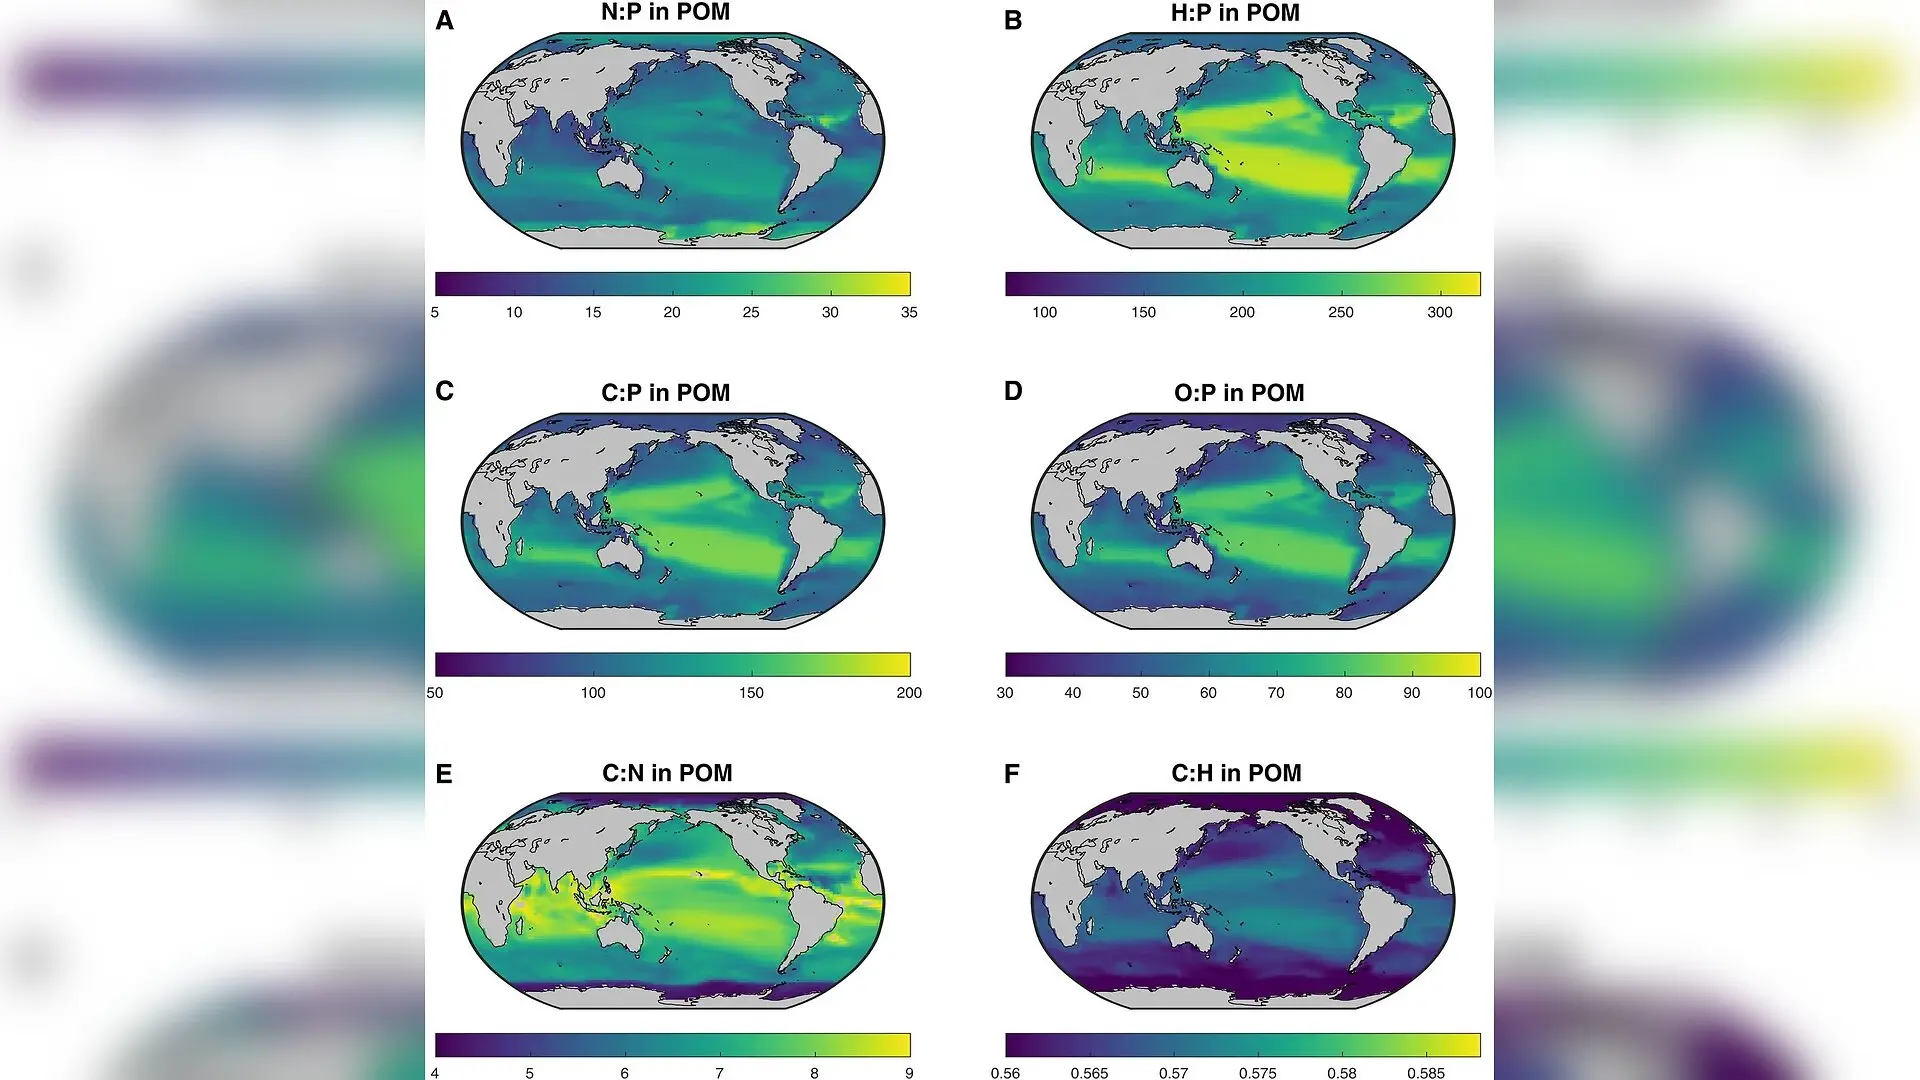
Marine phytoplankton across the global ocean adjust their cellular chemistry based on local light and nutrient conditions, fundamentally altering how oxygen and carbon cycle through deep waters. For decades, global climate and ocean models have relied on the assumption that marine organic matter maintains a fixed, uniform elemental ratio known as the Redfield-Ketchum-Richards equation, which treats plankton largely as a standard mixture of carbohydrates and nutrients. Now, a study published in Science Advances reveals that physiological adaptation drives widespread latitudinal variations in the carbon, hydrogen, nitrogen, oxygen, and phosphorus composition of planktonic cells. These hidden biochemical shifts significantly impact global oxygen demand and deep-ocean respiration estimates.
How Environmental Stress Rewires Phytoplankton Cells
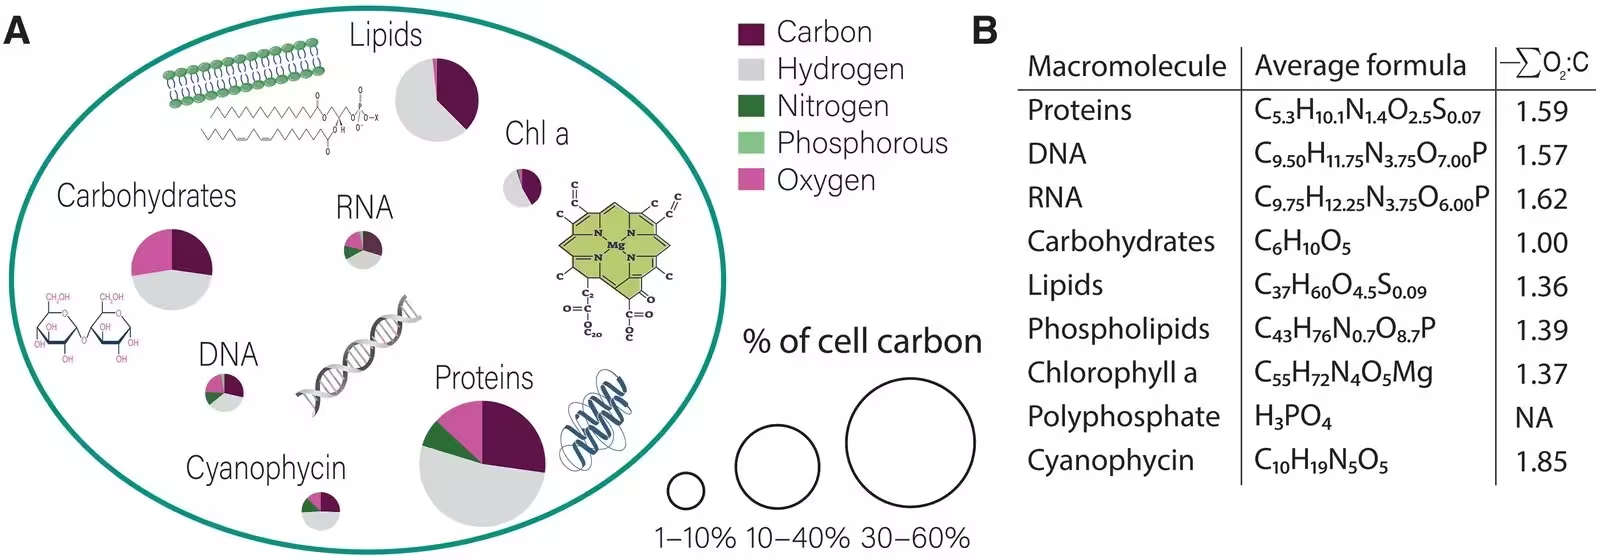
To uncover these global patterns, lead researcher Shlomit Sharoni of the Hebrew University of Jerusalem and an international team of oceanographers integrated a cellular allocation model into the Massachusetts Institute of Technology general circulation model (MITgcm). This mechanistic framework simulates how phytoplankton adjust the proportions of proteins, lipids, carbohydrates, nucleic acids, and storage molecules in response to environmental factors such as temperature, light availability, and nutrient concentrations. The simulations tracked how small, nutrient-adapted cells in subtropical gyres differ from larger, fast-growing eukaryotic phytoplankton found in high-latitude upwelling zones.
The results demonstrate that subtropical phytoplankton living in nutrient-depleted oligotrophic waters invest heavily in carbon-rich storage macromolecules like carbohydrates and lipids, which contain more carbon-oxygen bonds and require less oxygen to decompose. Conversely, phytoplankton thriving in nutrient-rich, low-light polar and subpolar waters allocate more energy toward light-harvesting and biosynthetic proteins. Because proteins are rich in reduced nitrogen and hydrogen chains, high-latitude plankton possess a more reduced chemical structure. When these cells die and sink, their decomposition consumes considerably more oxygen than standard biogeochemical models typically account for.
Revisiting Global Oxygen Demand and Respiration Quotients
The researchers calculated that the global average chemical formula for freshly produced marine phytoplankton is C107H190N16O53P, yielding an average total oxygen demand of 149 moles of oxygen per mole of phosphorus, and a total respiration quotient of 1.40 moles of oxygen per mole of carbon. This oxygen demand value sits higher than the classical Redfield baseline of 138, but lower than the uniform value of 170 frequently implemented in Earth system simulations. By explicitly tracking proteins and lipids, the authors identified an additional, non-negligible oxygen sink driven by excess hydrogen in reduced macromolecules.
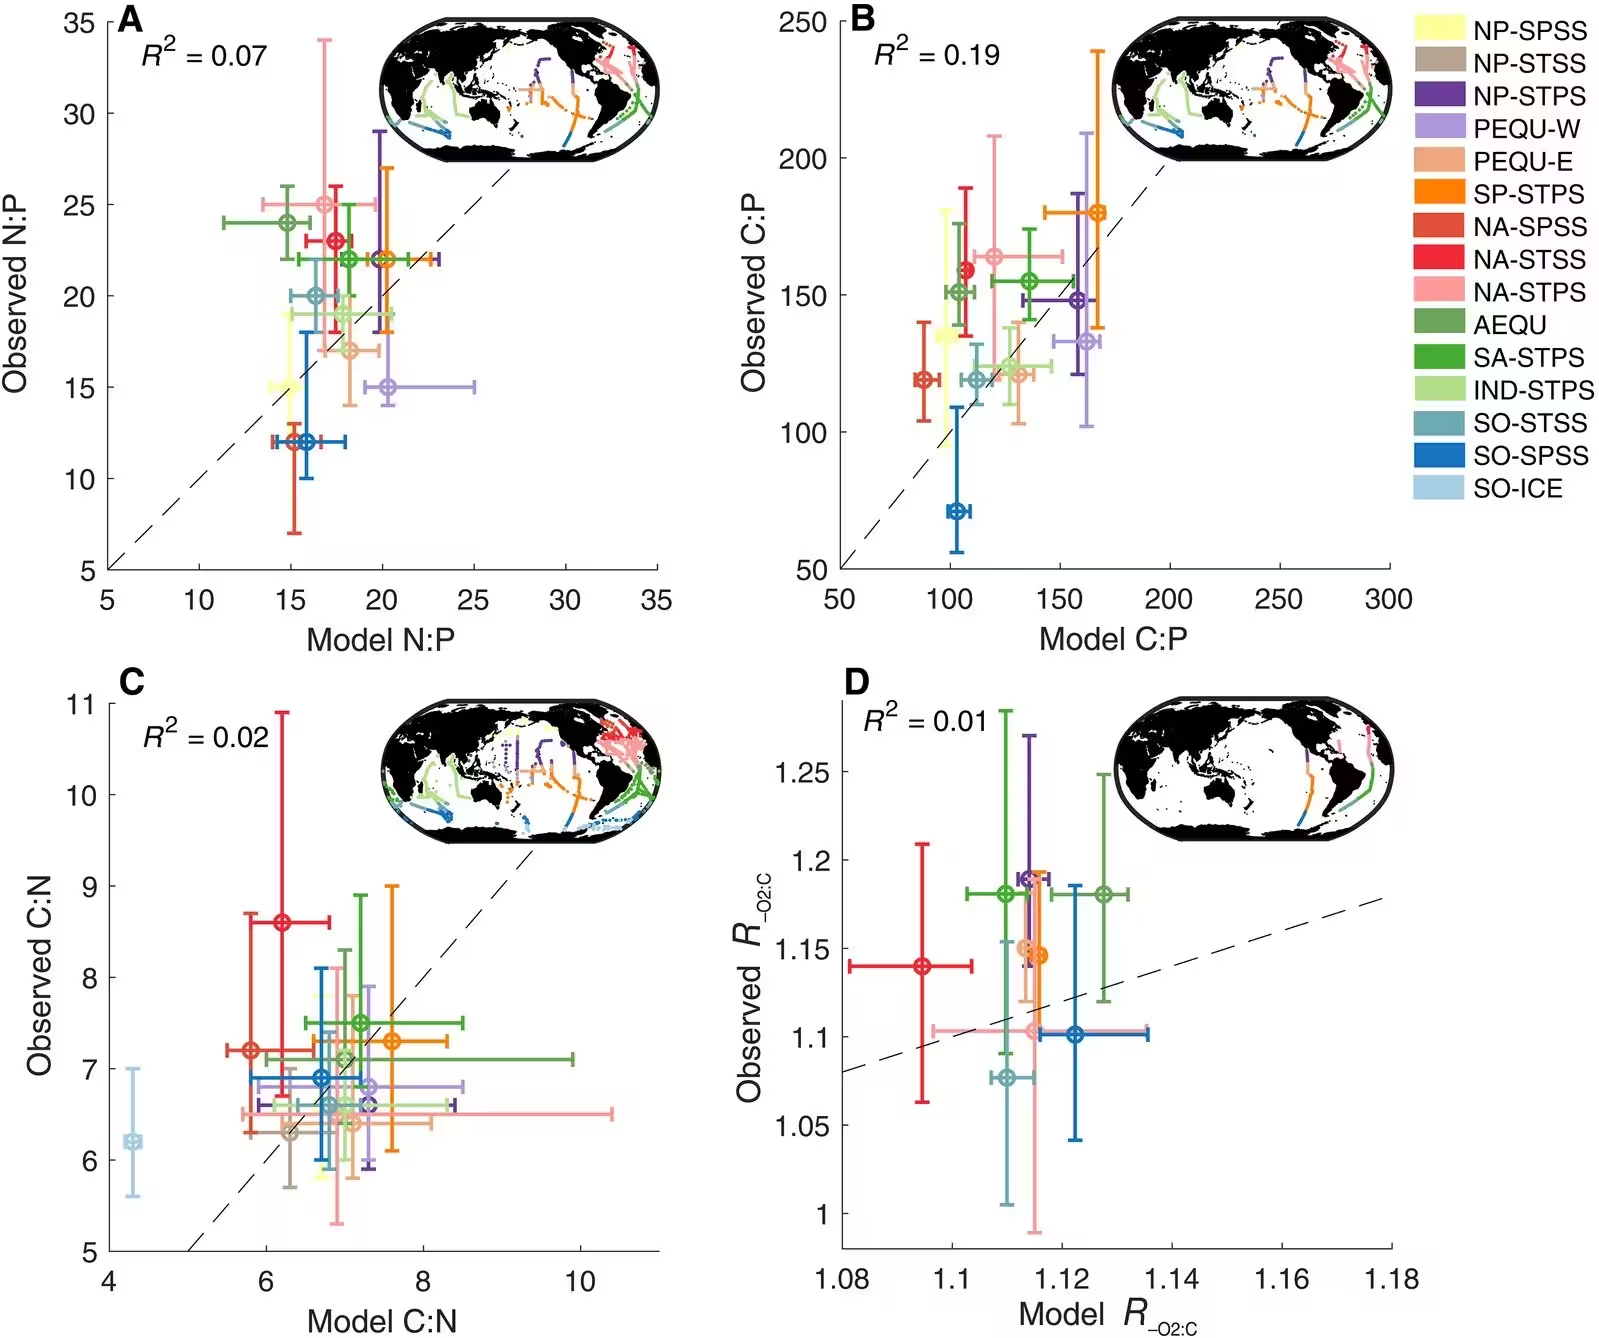
Spatial variations in these ratios have profound consequences for the global ocean oxygen budget. When the authors tested the sensitivity of their circulation model to these biochemical shifts over a 2,000-year simulation, they found that shifting cellular composition from carbohydrate-rich to protein-rich states caused the total oceanic oxygen inventory to shrink by 11 percent. Furthermore, this deoxygenation drove substantial expansions in hypoxic zones, where dissolved oxygen concentrations drop below critical thresholds. The volume of waters with oxygen levels below 62 micromoles expanded by a factor of 1.75, while severely oxygen-depleted zones below 25 micromoles increased by a factor of 2.8.
Implications for the Biological Carbon Pump
These biochemical adjustments also alter how scientists calculate the export and remineralization of carbon via the biological soft tissue pump, known as Csoft. By applying spatially variable respiration quotients to observed apparent oxygen utilization data, the team estimated a global apparent biological carbon pump inventory of 1,515 petagrams of carbon. Assuming a uniform respiration quotient of 1.5 across the entire ocean led to an underestimation of regenerated carbon by 130 petagrams, representing an error of nearly 9 percent. Conversely, applying a lower uniform quotient of 1.3 overestimated the carbon inventory by 83 petagrams.
The authors note that while their forward model successfully captures broad basin-scale trends that align with independent inverse nutrient models, certain limitations remain. The current framework represents phytoplankton in only two size classes and omits specialized nitrogen-fixing organisms that possess distinct trace-metal requirements and unique biochemical traits. Expanding taxonomic and biochemical diversity in future models will help refine these estimates. Nevertheless, the findings highlight that cellular-level biochemical reorganization under changing environmental conditions plays a powerful role in shaping large-scale oceanic cycles of carbon and oxygen.
The research was published in Science advances on October 30, 2026.
This article has been fact checked for accuracy, with information verified against reputable sources. Learn more about us and our editorial process.
Last reviewed on .
Article history
- Latest version
Reference(s)
- Sharoni, Shlomit., et al. “C:H:N:O:P stoichiometry and oxygen demand of marine organic matter are driven by phytoplankton ecophysiology.” Science Advances, vol. 12, no. 44, October 30, 2026 American Association for the Advancement of Science (AAAS), doi: 10.1126/sciadv.aeg6228. <https://doi.org/10.1126/sciadv.aeg6228>.
Cite this page:
- Posted by Divya Iyer