AI Runs Weather Forecasts Backward to Uncover Hurricane Origins
A new backward-in-time machine learning model traces the atmospheric precursors of historic extreme weather events over 66-hour windows.

A new artificial intelligence model can run weather forecasts backward in time to pinpoint the exact atmospheric conditions that sparked historic extreme events, researchers report. By stepping backward through 66-hour windows, the system maps out diverse pathways leading up to major disasters.
Extreme weather events such as intense heatwaves and powerful hurricanes are projected to become more severe and frequent in a warming climate. Traditional computer simulations struggle to trace these rare events because generating massive ensembles of potential futures is computationally expensive and scales poorly with time. Furthermore, conventional methods fail to show how a single extreme outcome can arise from completely different starting conditions.
To address this challenge, researchers developed a backward-in-time probabilistic model called Rewind-AR, which is built on a FourCastNet 3 architecture containing roughly 273.5 million parameters. The details of this system were published on the arXiv preprint server by computer scientists Jerry Lin and Elizabeth A. Barnes from Boston University. Instead of trying to reverse physical laws, which can cause small calculation errors to blow up exponentially, the model learns the conditional antecedent distribution to reconstruct past states step by step in six-hour intervals.
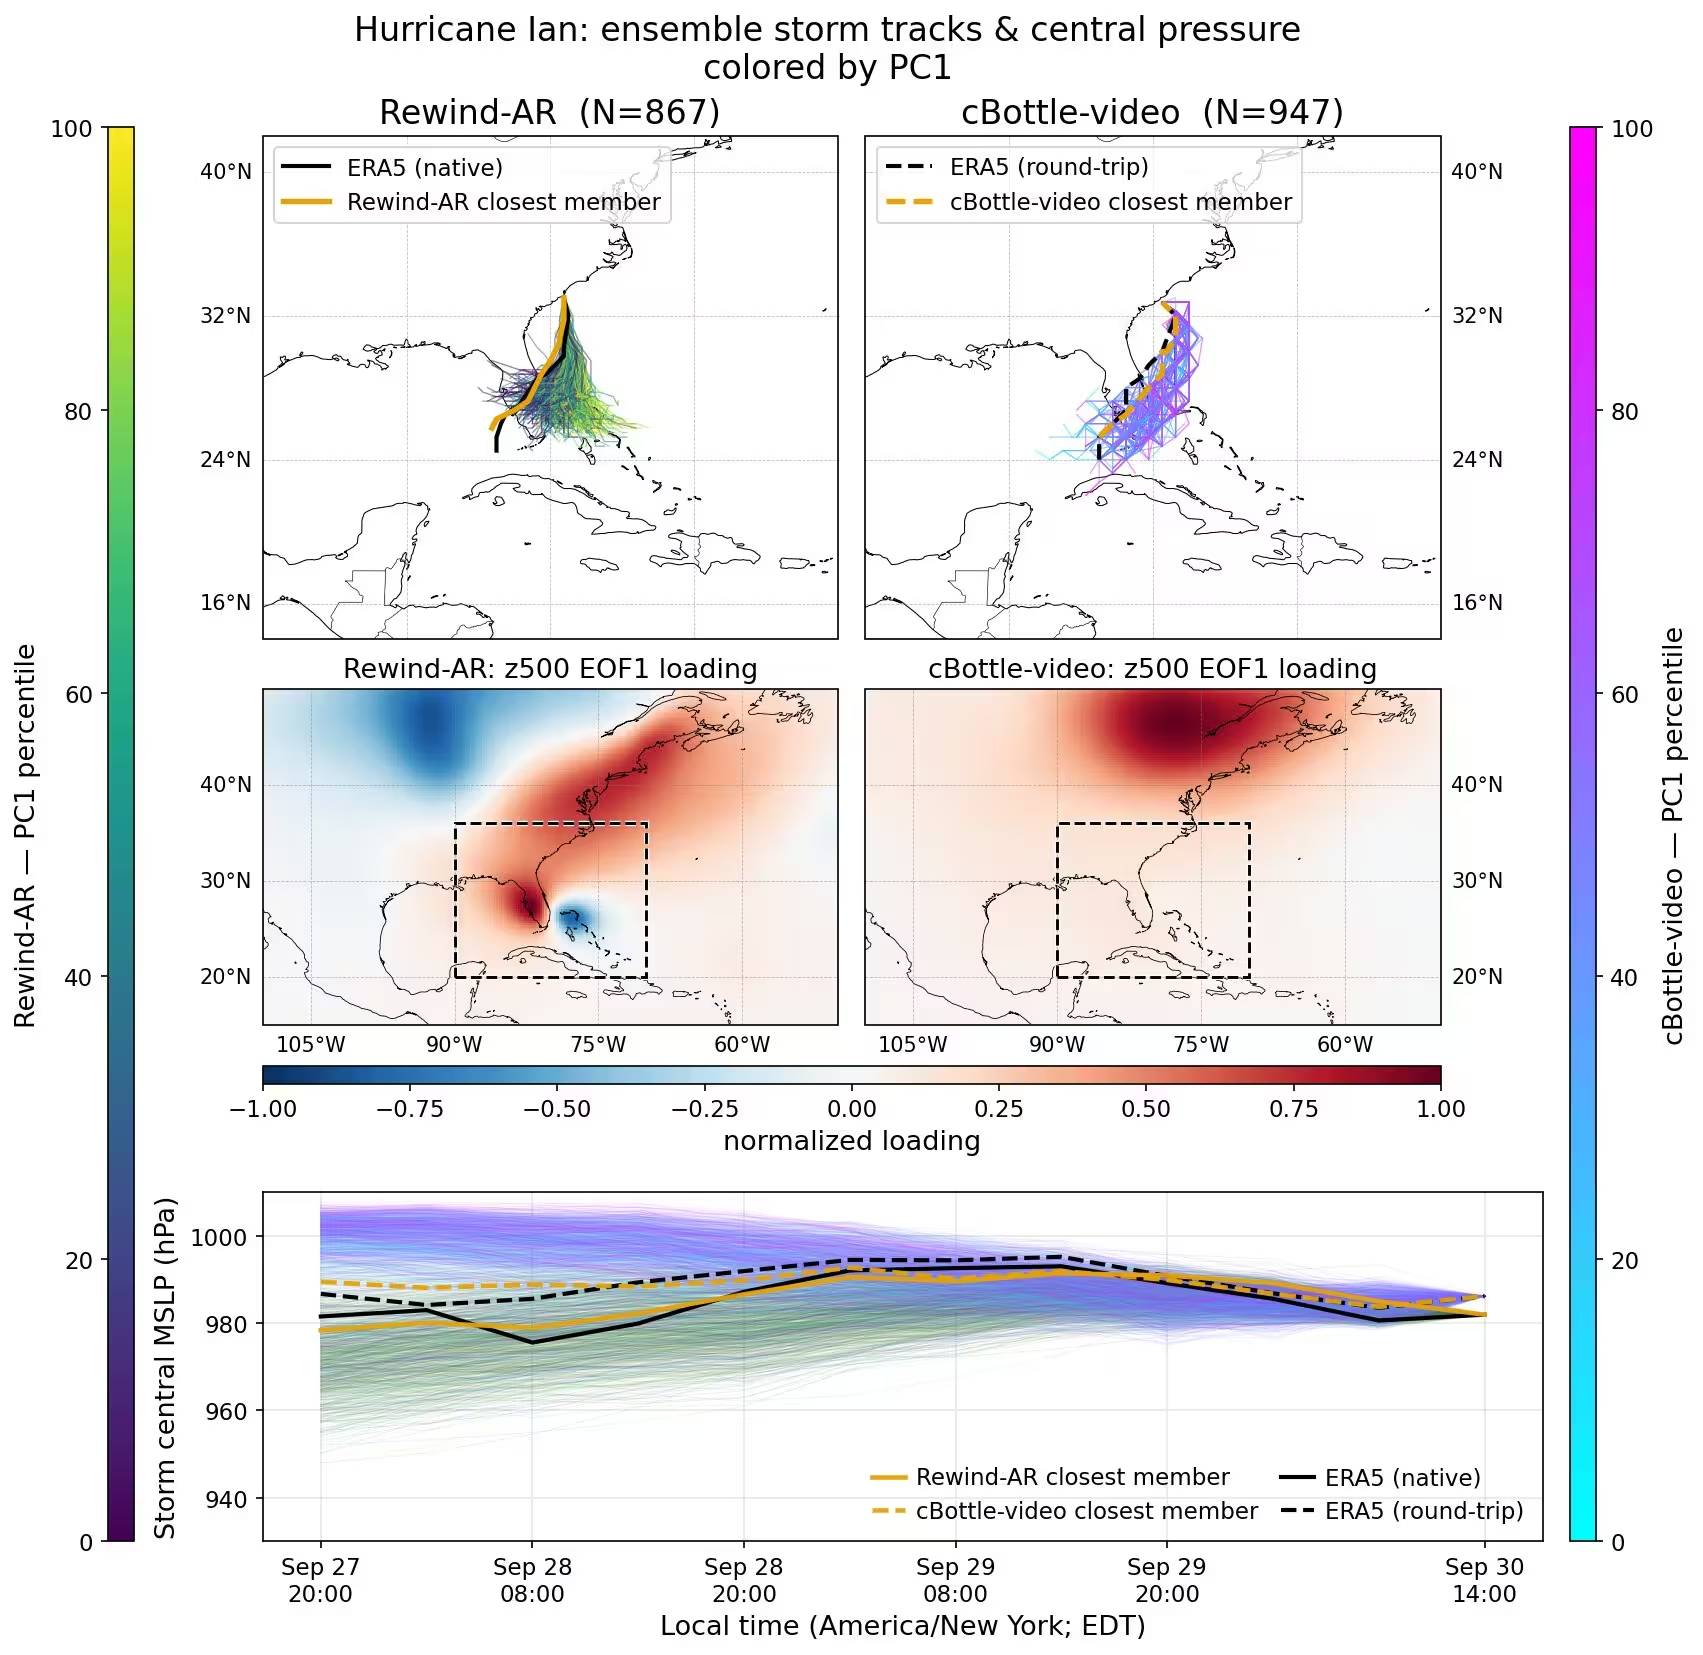
The team tested the system on three major historical events, including Hurricane Ian from 2022 and the 2021 Pacific Northwest heatwave. For Hurricane Ian, the model generated 1,000 backward trajectories starting from the storm’s landfall in South Carolina. After screening out numerical instabilities, which affected roughly 13 percent of the hurricane members and 22 percent of the heatwave members, the remaining trajectories offered a clearer picture of storm precursors than previous video diffusion emulators.
How Backward AI Tracks Hurricane Paths
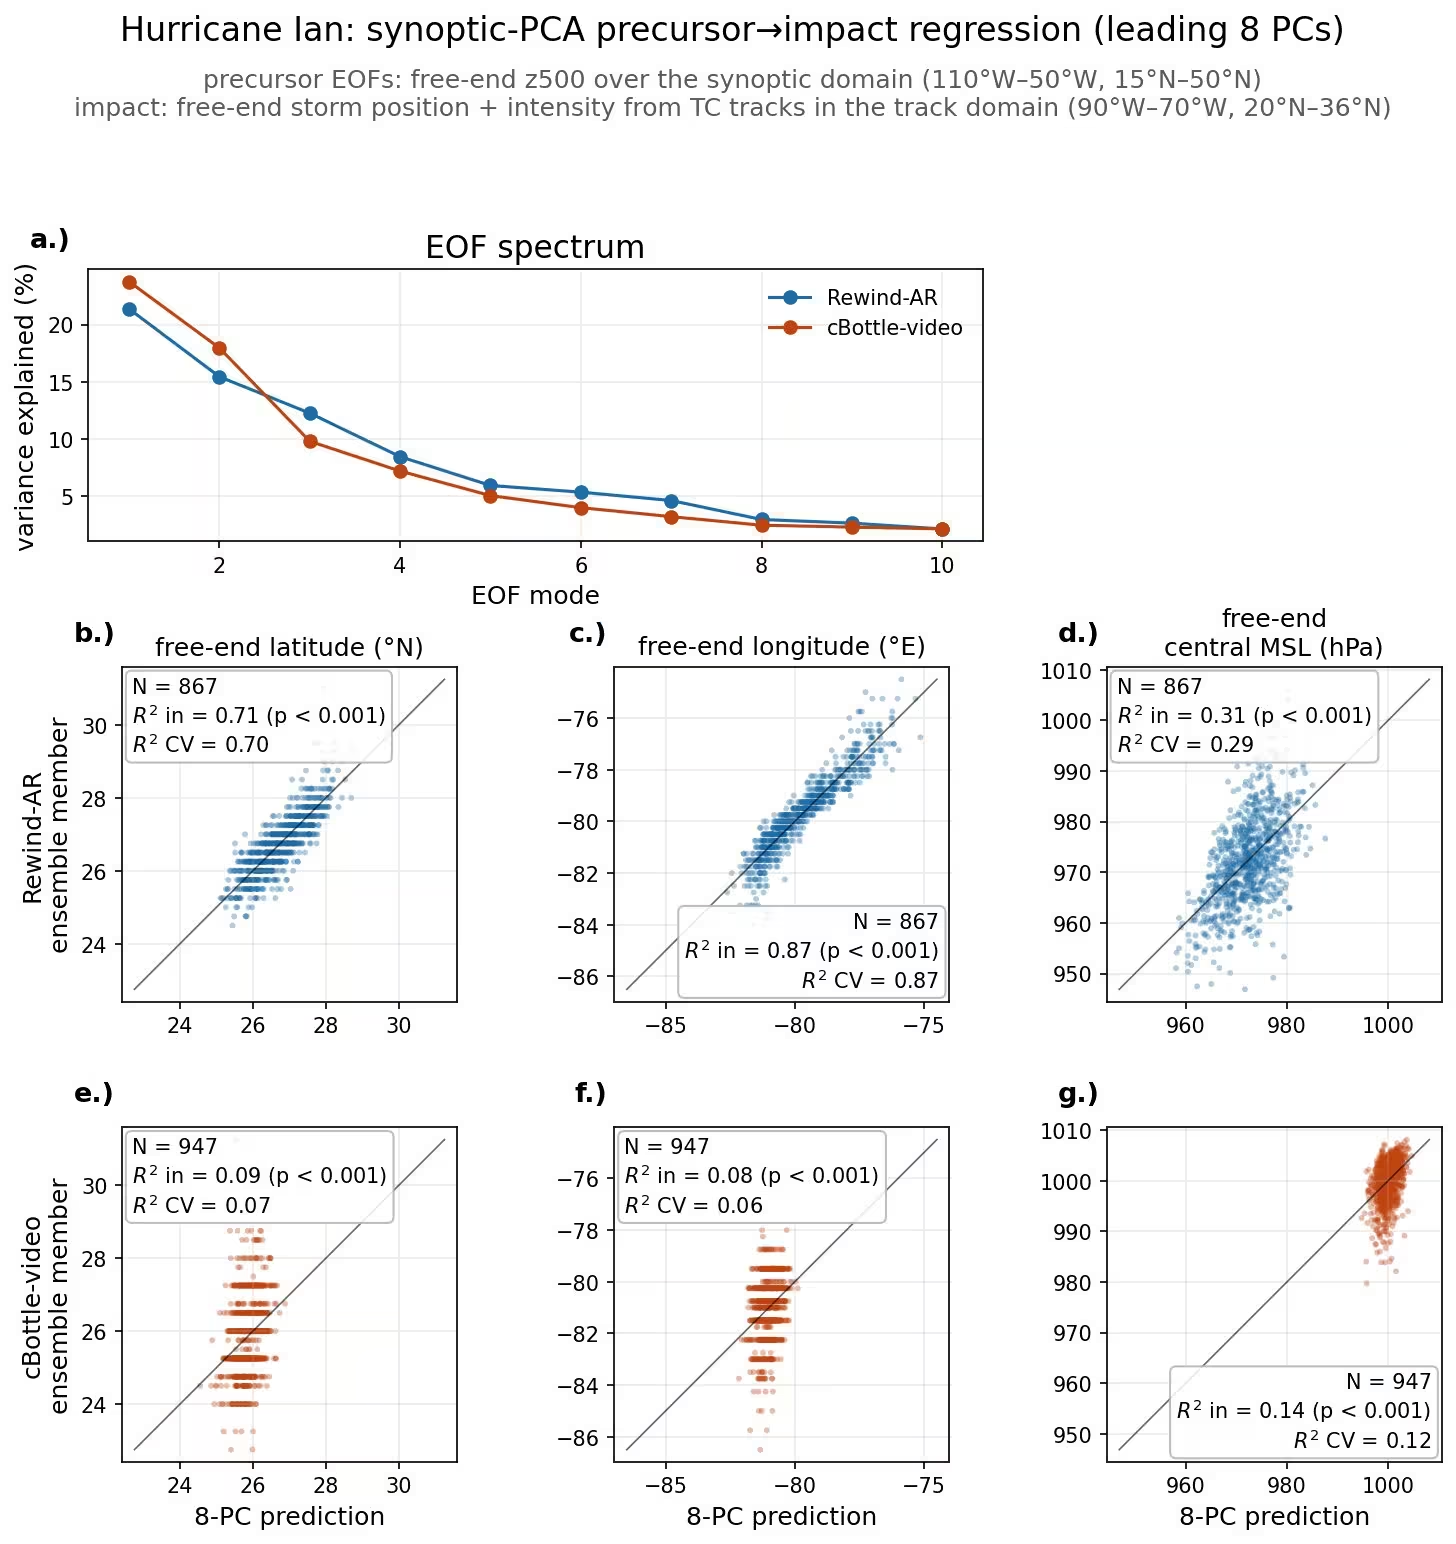
The leading patterns of 500 hPa geopotential height, which measure atmospheric pressure levels roughly 5.5 kilometers above sea level, explained between 71 and 87 percent of the variance in the storm’s starting position. This means the backward model successfully linked atmospheric pressure configurations to specific storm tracks. For instance, low pressure anomaly patterns reliably separated western storm origins in the Gulf of Mexico from eastern origins over the Atlantic.
By contrast, previous video diffusion models such as cBottle-video showed much weaker statistical links between pressure patterns and storm tracks. However, the new autoregressive approach is not without flaws. Up to 22 percent of its ensemble members became numerically unstable or produced physically impossible states within the 66-hour window, and some simulated storms for Superstorm Sandy began unrealistically far inland.
Simulating the 2021 Pacific Northwest Heatwave
When applied to the deadly 2021 heatwave that broke temperature records across western North America, Rewind-AR performed better than previous models at capturing day-over-day atmospheric warming. While older video diffusion models missed the gradual temperature buildup leading up to the June 27 peak, the new autoregressive model successfully captured the intensification trend, even though its daytime heating estimates remained slightly too cool compared to reanalysis data.
The study highlights a fundamental tension in climate modeling between physical consistency and mathematical stability. While Rewind-AR maintained realistic geopotential wind balances much better than diffusion-based alternatives, its tendency to drift into numerical instability over long lead times indicates that further refinement is necessary for operational risk assessment.
The study was posted to the arXiv preprint server on November 16, 2026.
This article has been fact checked for accuracy, with information verified against reputable sources. Learn more about us and our editorial process.
Last reviewed on .
Article history
- Latest version
Reference(s)
- Lin, Jerry. “Run it Back: Autoregression vs. Video Diffusion for Final-Conditioned Weather Trajectories.” arXiv.org <http://arxiv.org/abs/2611.21521v1>.
Cite this page:
- Posted by Vikram Desai