Ten-Year Study Reveals How Weather Triggers Dysentery Surges in Ethiopia
Researchers link temperature, rainfall, and humidity shifts to waterborne illness rates in a flood-prone region.

A decade-long analysis of health records in western Ethiopia shows that monthly dysentery cases rise and fall in lockstep with shifts in temperature, rainfall, and humidity. The study examined data collected from September 2012 to December 2021 across three districts in the flood-prone Gambella Region, capturing 6,723 routine surveillance-reported cases of the waterborne illness.
Researchers focused on the lowland region bordering South Sudan because its mix of seasonal flooding, population movement, and limited infrastructure makes communities exceptionally vulnerable to climate-sensitive infections. The findings were published in PLOS One by investigator Geteneh Moges Assefa.
How Weather Shapes Dysentery Risks
Dysentery is commonly identified in public health tracking as diarrhea containing visible blood, signaling severe intestinal infection. Environmental factors heavily influence these outbreaks because heavy rains and overflowing rivers can easily compromise drinking water sources and spread pathogens through the fecal-oral route.
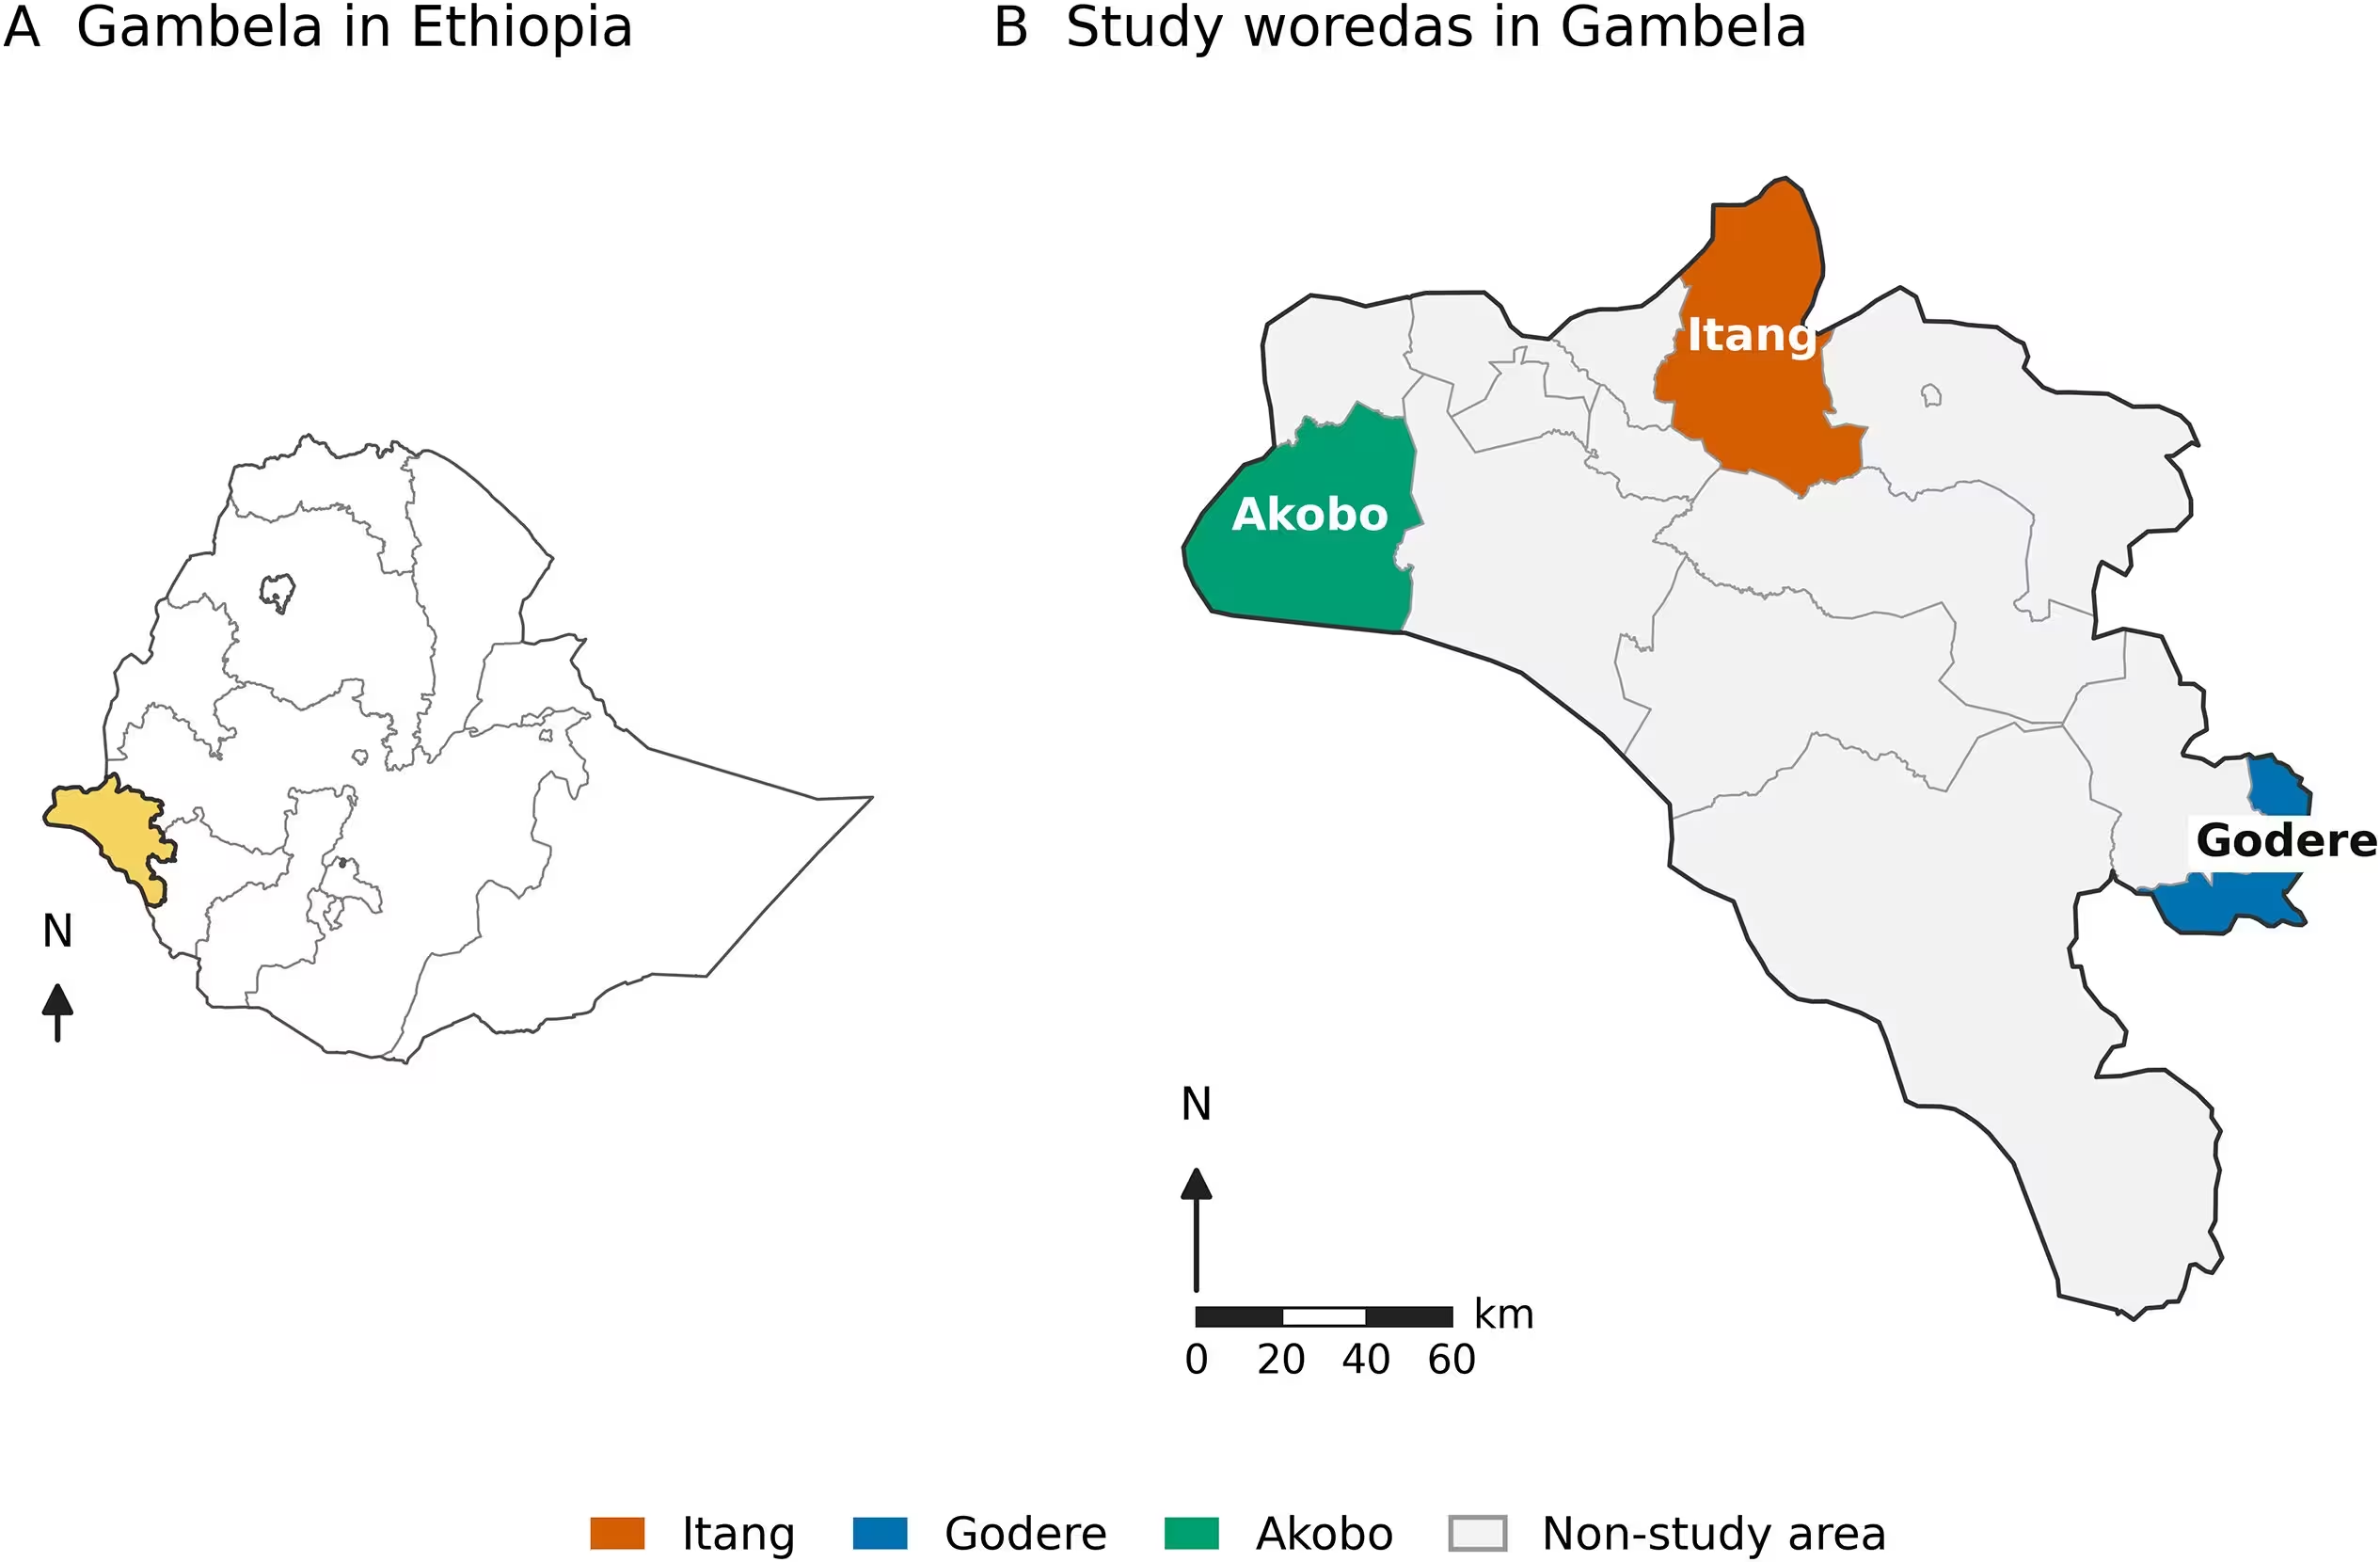
To uncover the connection between weather and disease, the author utilized satellite-derived climate data alongside monthly district health reports. Using statistical models that accounted for seasonal shifts and population sizes, the analysis revealed that temperature, rainfall, and relative humidity all share distinct, nonlinear links with dysentery rates.
The Surprising Patterns of Rainfall and Heat
When looking at rainfall, the data revealed an unexpected curve. Predicted dysentery incidence was much lower during extremely dry months, surged sharply as rainfall approached moderate levels around 98 millimeters per month, and then leveled off across the higher end of the rainfall spectrum.
Temperature also played a critical role. While disease rates remained relatively steady across mild and moderate temperatures, they climbed sharply at the upper end of the observed thermometer readings. At the 90th percentile of monthly mean temperature, predicted dysentery incidence jumped by roughly 23 percent compared to the median temperature.
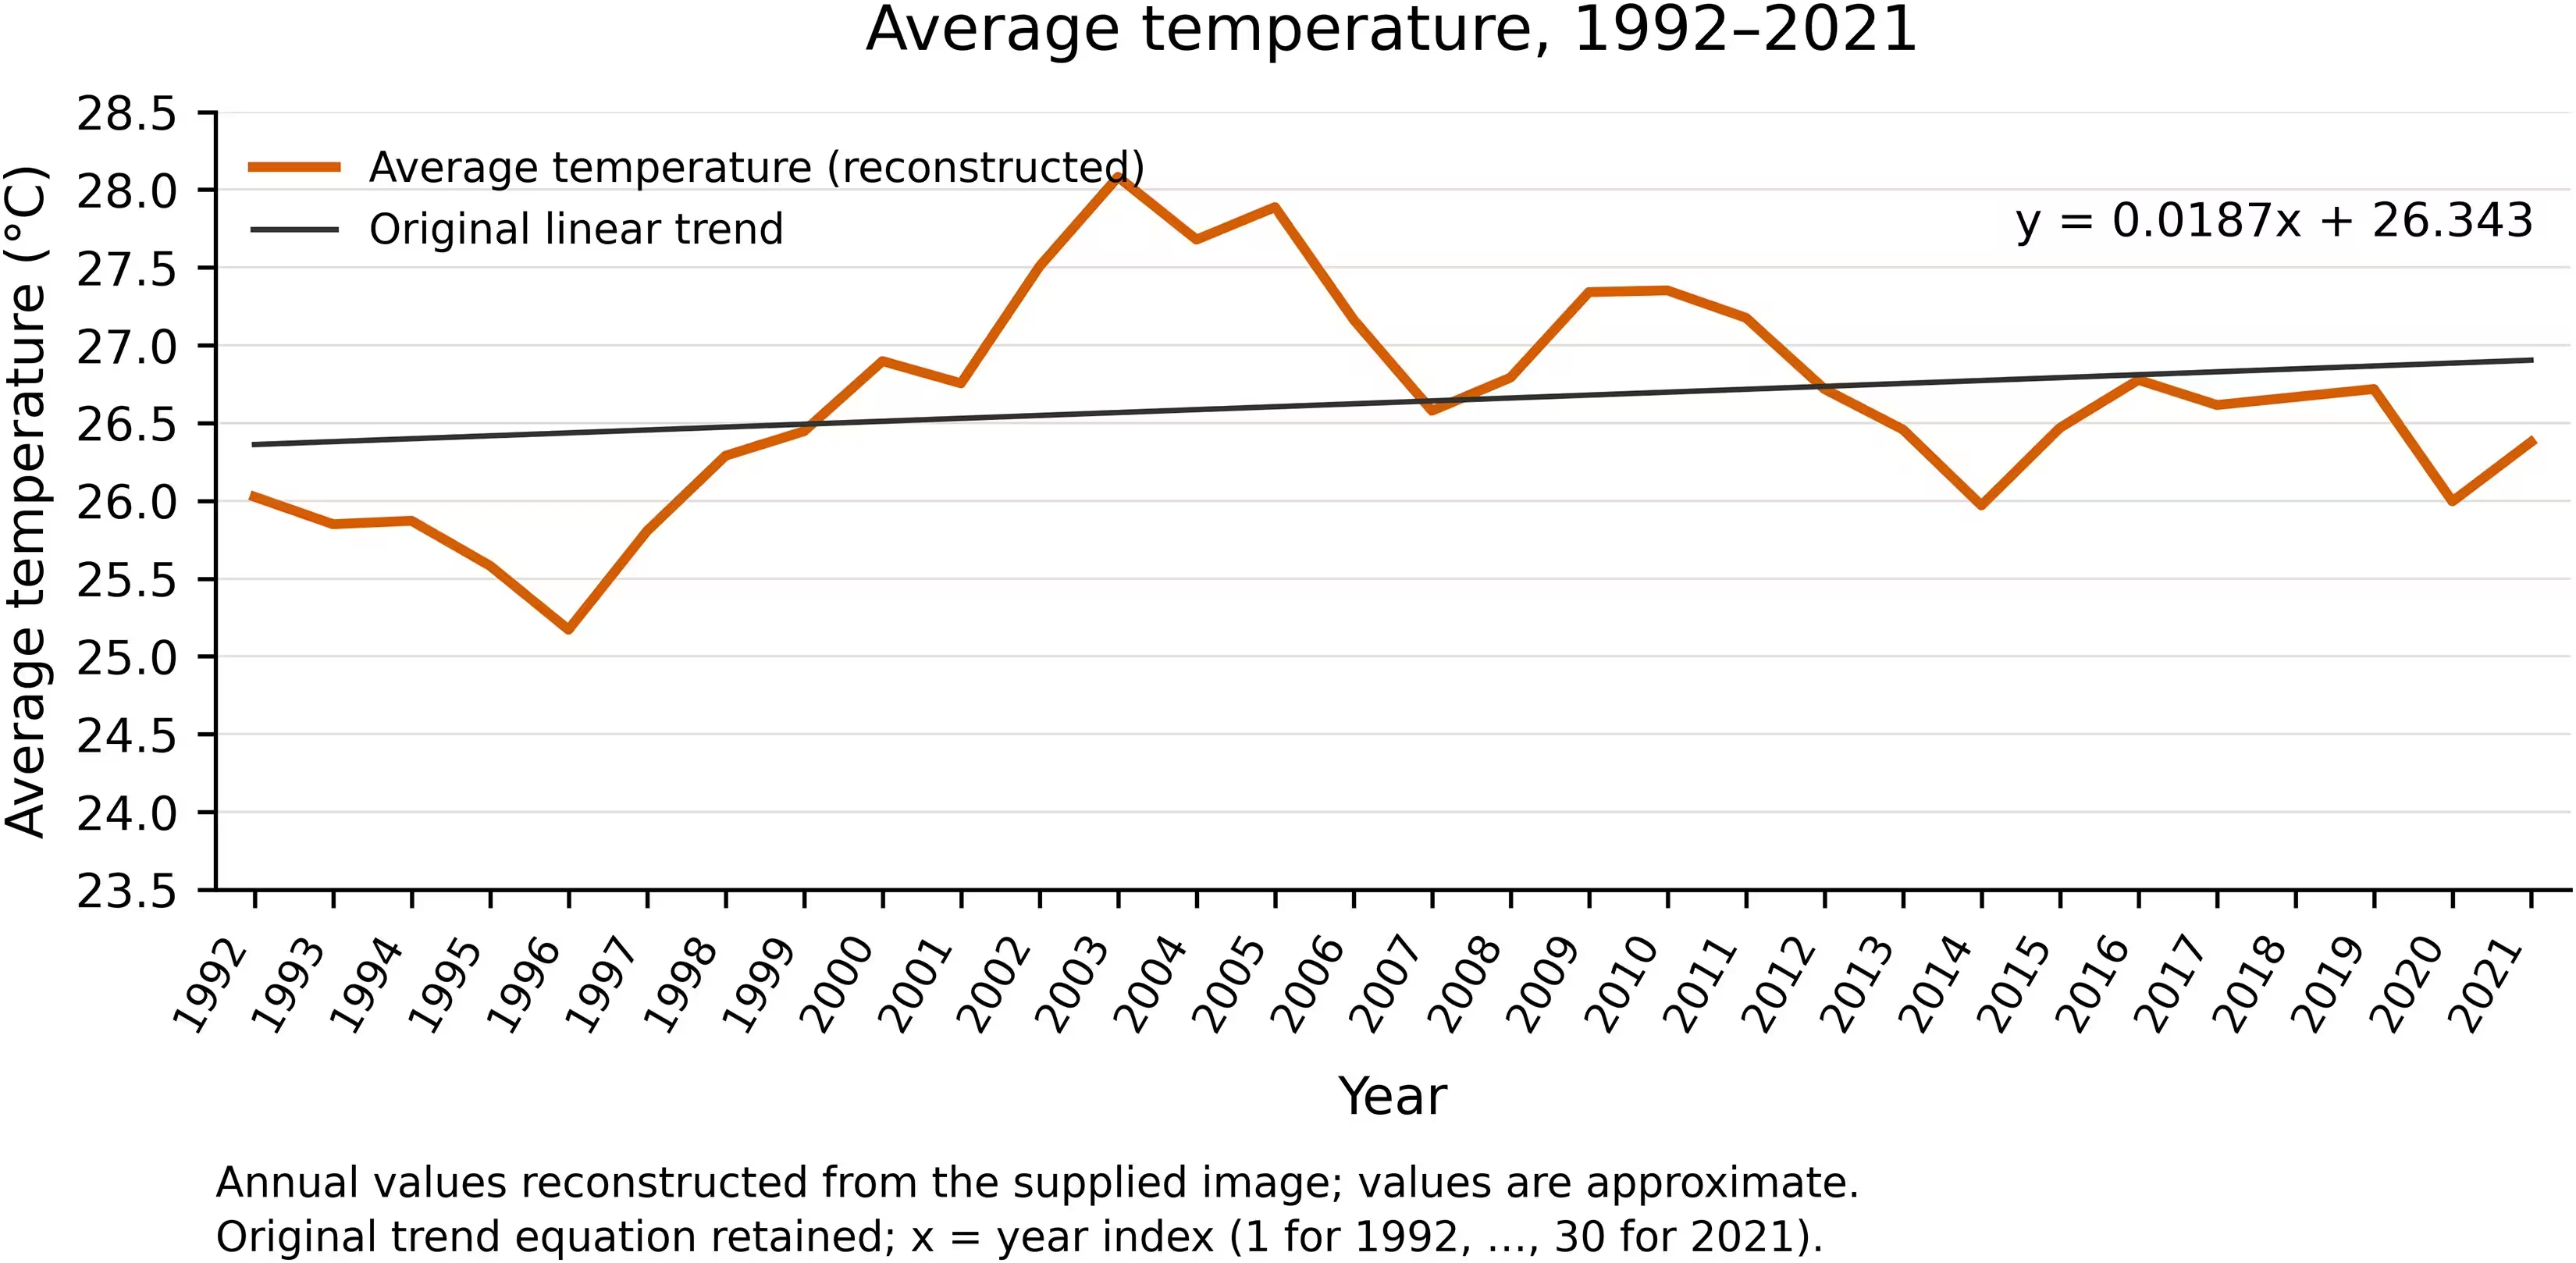
Meanwhile, relative humidity showed a steady upward trend. Higher moisture levels in the air coincided with increased disease rates, likely because humid conditions help enteric pathogens survive longer in the environment while also reflecting the wet conditions tied to rainy seasons.
What These Findings Mean for Early Warning Systems
The author tested the robustness of these results by running sensitivity analyses that excluded the COVID-19 pandemic years and accounted for year-to-year correlations in the data. The broad patterns remained consistent, though the temperature link weakened slightly when removing the 2020 to 2021 records.
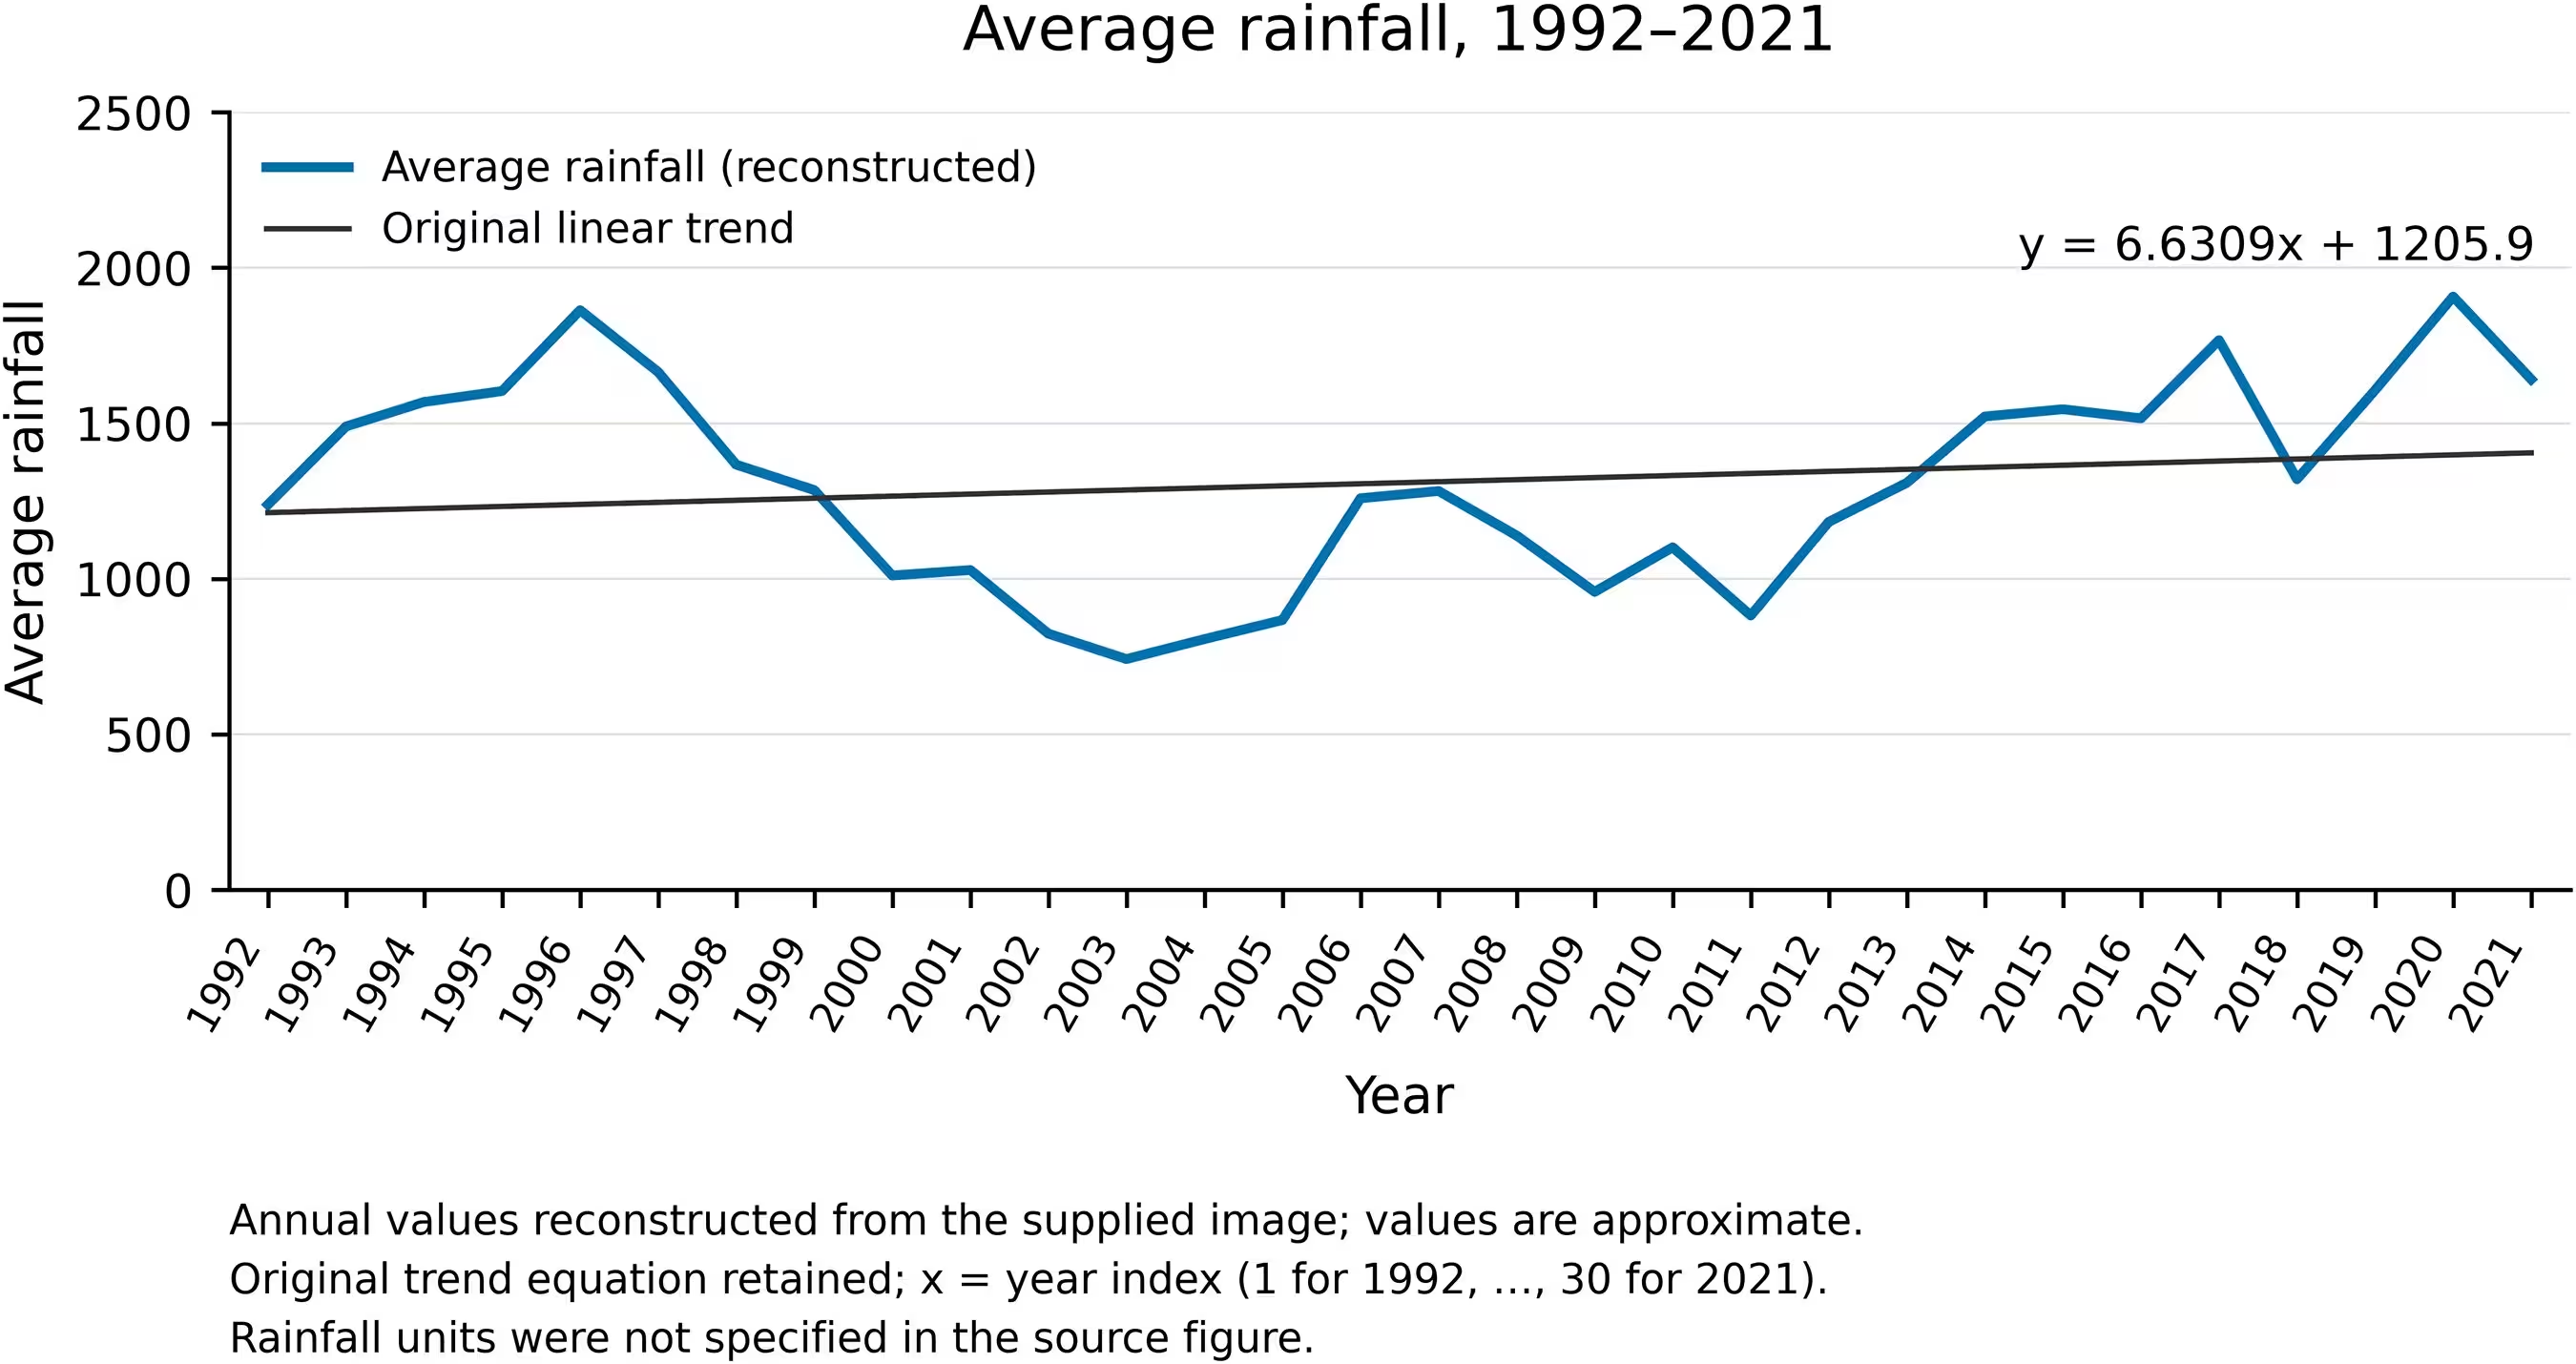
Despite these insights, the study carries important limitations. Because the research relied on aggregated monthly district data rather than individual patient records, it cannot prove direct cause and effect. Furthermore, the data lacked monthly measurements for local sanitation conditions, water treatment practices, or displacement, which also shape disease transmission.
Ultimately, the work suggests that tracking routine weather indicators could help regional health authorities anticipate high-risk periods for waterborne illness. The author emphasizes that future preparedness efforts should combine meteorological monitoring with real-time data on flooding, sanitation disruptions, and safe water access to protect vulnerable communities.
The research was published in PLOS One on November 18, 2026.
This article has been fact checked for accuracy, with information verified against reputable sources. Learn more about us and our editorial process.
Last reviewed on .
Article history
- Latest version
Reference(s)
- Assefa, Geteneh Moges. “Climate variability and dysentery morbidity in Gambella Region, Ethiopia: A retrospective ecological time-series analysis, 2012–2021.” PLOS One, vol. 21, no. 11, November 18, 2026, pp. e0363086 Public Library of Science (PLoS), doi: 10.1371/journal.pone.0363086. <https://doi.org/10.1371/journal.pone.0363086>.
Cite this page:
- Posted by Michael Ellison