Why Traditional Statistics Classes Miss Complex Biological Realities
Researchers show how flexible nonlinear models outperform rigid straight lines in biomedical data analysis

When statisticians re-examined seemingly routine data sets using flexible curve-fitting techniques, they found that traditional linear equations often mask complex biological realities. Standard introductory statistics courses rely heavily on straight lines and uniform assumptions, yet many real-world measurements follow curved trajectories that demand a different mathematical toolkit. In a methodological study published in PLOS One, researchers Timothy E. O’Brien and Jack W. Silcox demonstrate how nonlinear models can transform standard analyses such as paired comparisons, covariance adjustments, and interaction tests.
Why Simple Straight Lines Miss the Mark in Paired Data
Many scientific experiments measure subjects twice, such as before and after a medical treatment, and analyze the results using a paired t-test. This classic method assumes that any change caused by an intervention is completely uniform across all participants, regardless of their initial measurements. The authors illustrate the limitation of this assumption by examining pulse rate data collected from 15 animals given a stimulant-relaxant drug. When plotted with baseline pulse on the horizontal axis and post-treatment pulse on the vertical axis, a standard paired t-test forces a slope of exactly one onto the data. However, an unrestricted simple linear regression reveals a slope of 0.562, showing that the drug had a minimal effect on animals with low starting heart rates but caused significant drops in animals with higher initial readings.
In another illustration involving simulated systolic blood pressure readings from 18 individuals, a traditional paired t-test found no statistically significant shift in mean values. When the authors applied a three-parameter simple exponential nonlinear model instead, the underlying dynamics became immediately clear. This exponential curve revealed how follow-up blood pressure values transitioned from lower to upper asymptotes, providing actionable insights that a simple linear average completely overlooked.
Uncovering Ratios and Percentage Changes Without Data Transformations
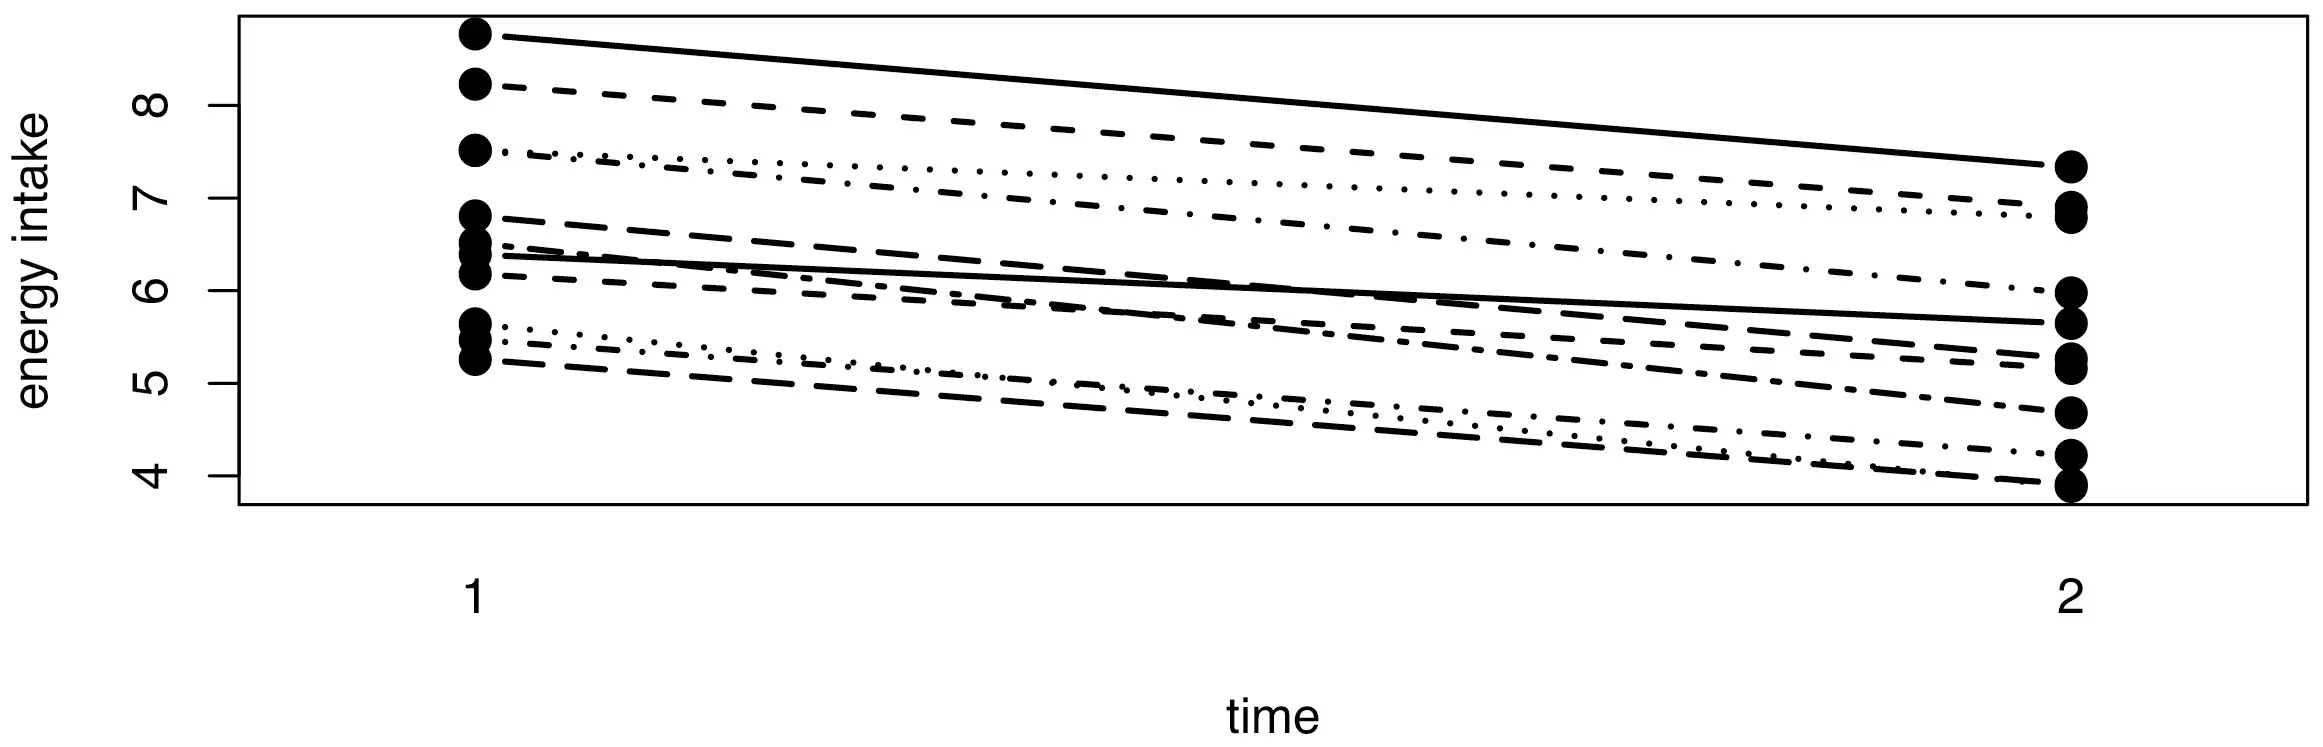
Researchers frequently want to know the proportional change or ratio between two group means rather than an absolute difference, such as assessing whether a therapeutic drug is twice as effective as a placebo. By extending linear mixed effects models into nonlinear mixed effects frameworks, scientists can directly estimate percentage changes. For instance, re-analyzing energy intake among 11 women pre- and post-menstruation using a nonlinear mixed model showed a 24 percent increase in dietary intake, moving past a simple additive difference of 1.32 units.
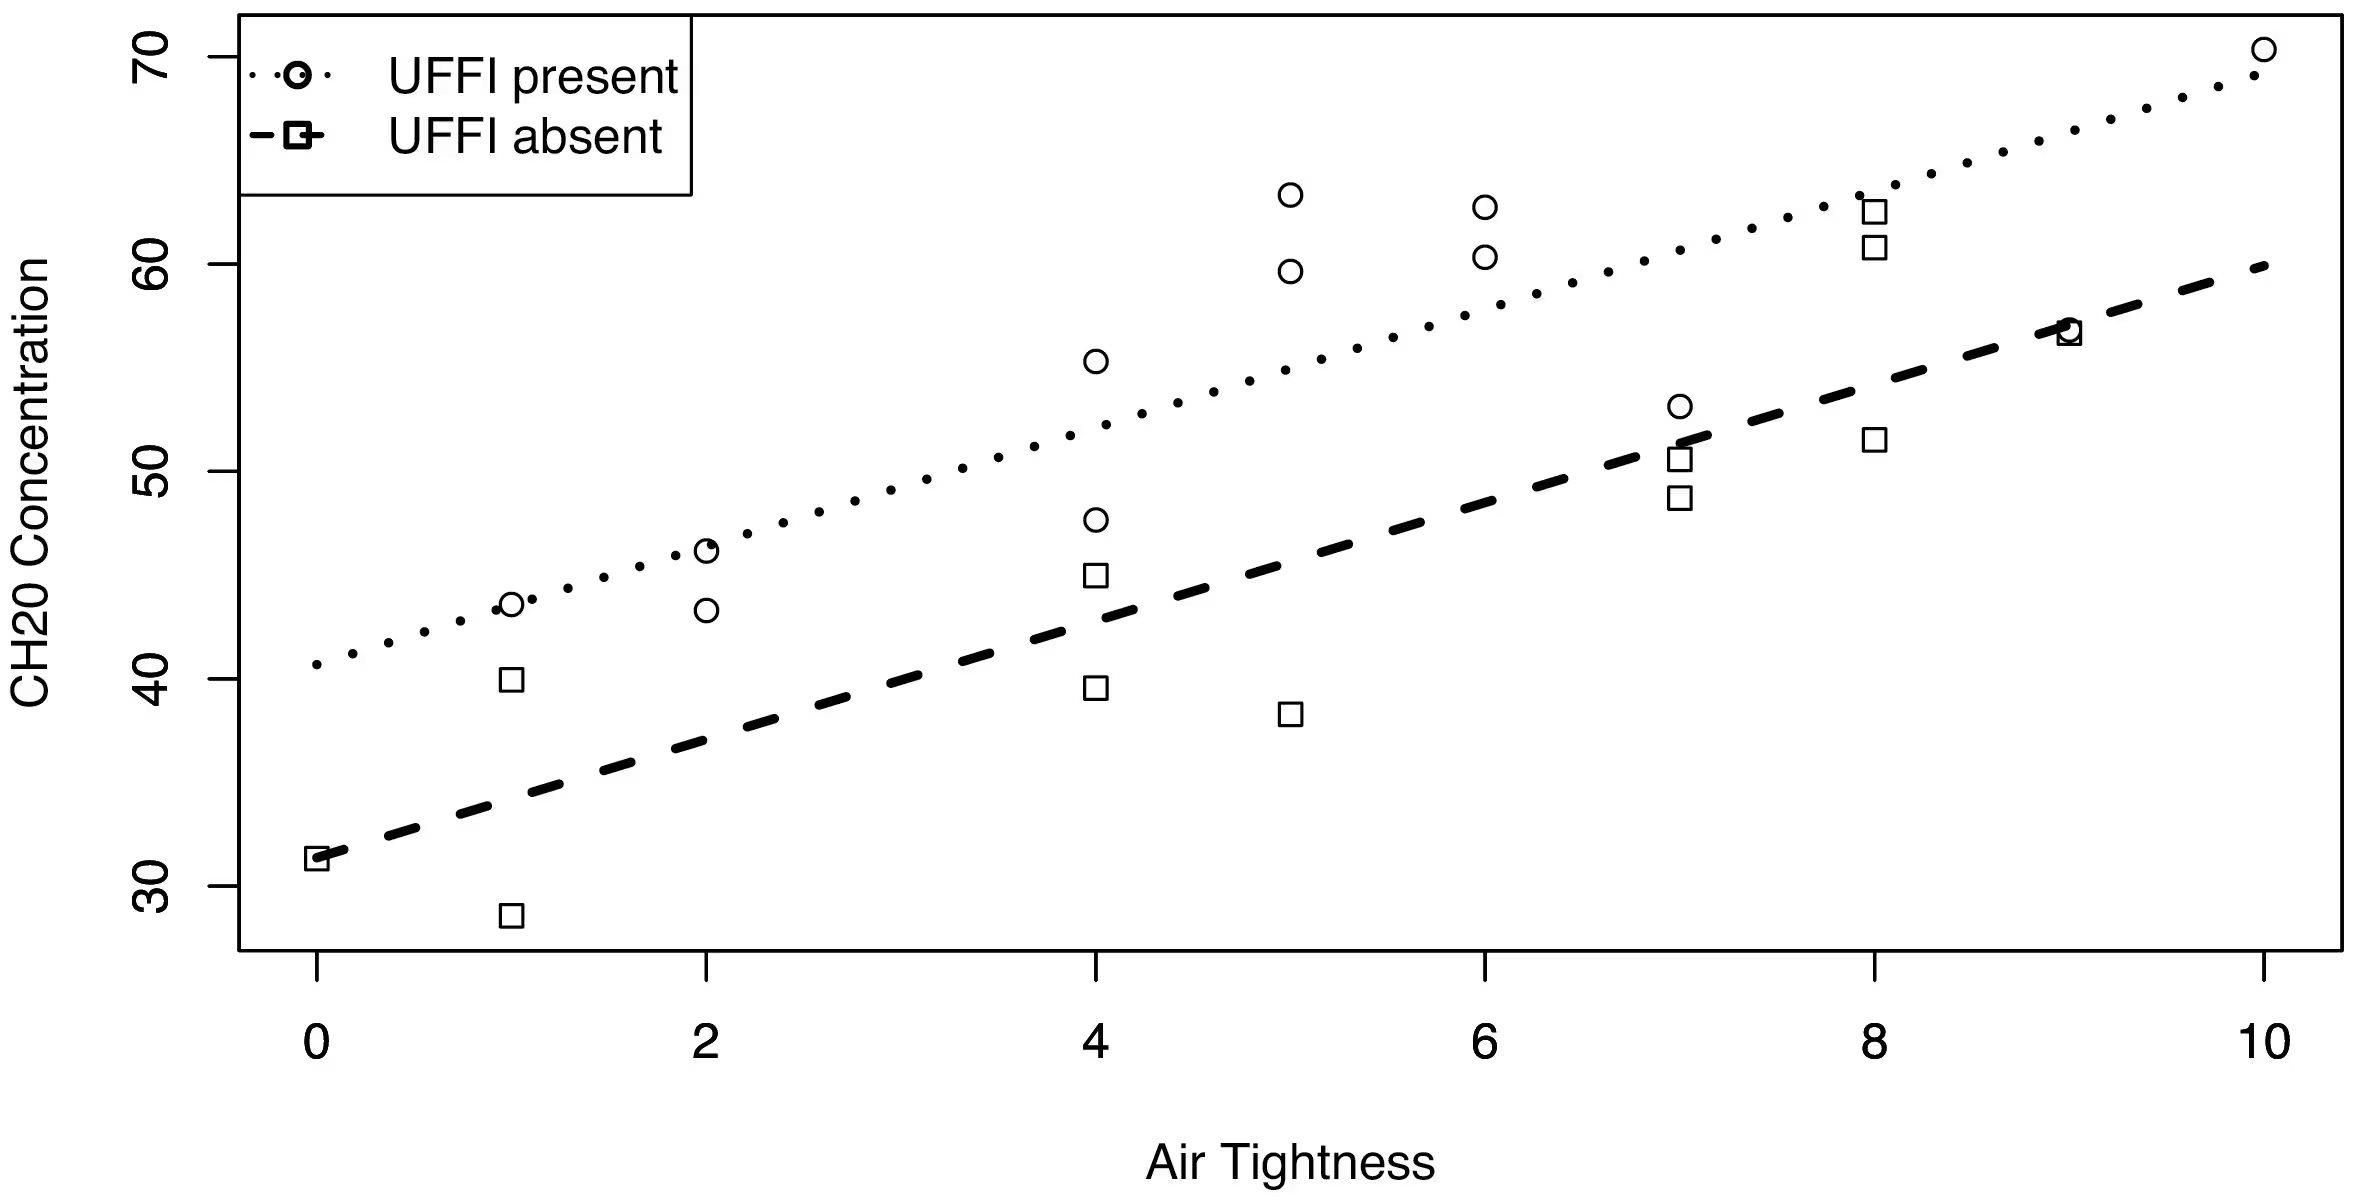
A similar advantage appears in the analysis of covariance, or ANCOVA, which adjusts group comparisons based on a measured covariate like home air tightness or cell concentration. When studying the growth of Tetrahymena cells in cultures with and without added glucose, researchers traditionally rely on complex mathematical transformations, such as raising cell diameters to the 1.88 power, to force the data into a straight line. O’Brien and Silcox show that fitting a three-parameter exponential decay model directly to the original measurements avoids confusing transformed units entirely, allowing investigators to conclude that glucose increases cell diameter by approximately 1.5 micrometers uniformly across all cell concentrations.
Detecting Synergy and Antagonism in Toxicological Mixtures
The benefits of nonlinear thinking extend to complex factorial experiments involving two or more active compounds. When studying Blue Lake snap beans exposed to ozone and sulfur dioxide, assessing multiplicative interaction requires calculating the ratio of ratios between treatment means. The resulting profile likelihood confidence intervals confirmed a synergistic growth response between the two air pollutants.
In a final toxicological example examining insect mortality across 20 different concentration combinations of insecticides A and B, the authors applied a generalized nonlinear model incorporating a binomial distribution. The resulting isobole curve, which bows outward from the graph’s origin, mathematically proved significant antagonism between the two compounds. Because the combined insecticides required higher doses to achieve 50 percent mortality than when applied separately, the nonlinear approach successfully captured an antagonistic interaction that linear response surface methods might have failed to illuminate with equivalent interpretability.
The research was published in PLOS One on November 17, 2026.
This article has been fact checked for accuracy, with information verified against reputable sources. Learn more about us and our editorial process.
Last reviewed on .
Article history
- Latest version
Reference(s)
- O’Brien, Timothy E.., et al. “Beyond the basics: Using nonlinear approaches to classical statistical tests to improve fit and interpretability.” PLOS One, vol. 21, no. 11, November 17, 2026, pp. e0362851 Public Library of Science (PLoS), doi: 10.1371/journal.pone.0362851. <https://doi.org/10.1371/journal.pone.0362851>.
Cite this page:
- Posted by Anjali Singh