Antibiotic Metabolites Fail to Improve Toxicity Predictions
Tracking breakdown products of the drug linezolid reveals strong links to kidney function, but no clear clinical benefit for routine monitoring.
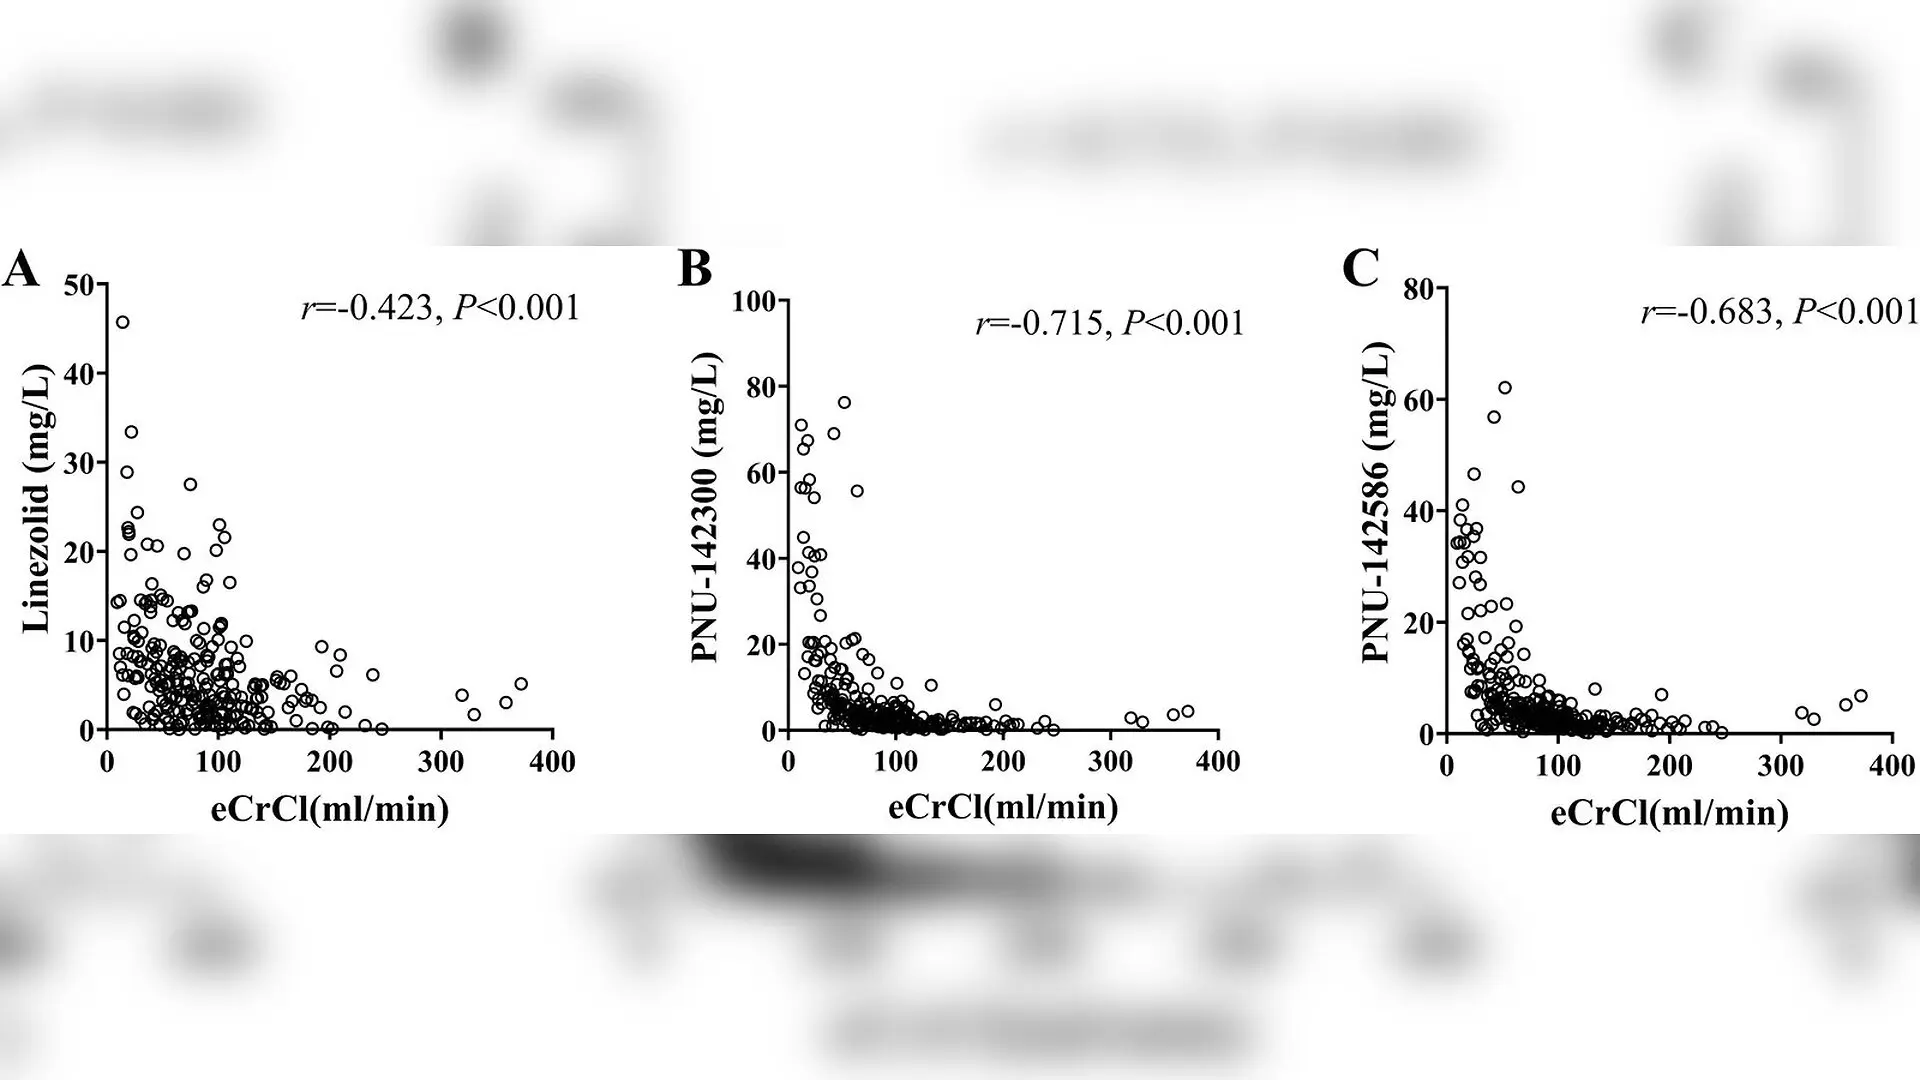
When patients take the antibiotic linezolid, their kidneys clear away both the medication and its chemical byproducts, but impaired kidney function can cause these breakdown compounds to build up to dangerous levels. A team of researchers recently investigated whether tracking two major circulating metabolites of linezolid, known as PNU-142300 and PNU-142586, could help doctors predict severe toxic side effects such as anemia, low platelet counts, and lactic acidosis.
The retrospective observational study, published in Drug Design, Development and Therapy, examined 252 adult patients treated with linezolid between January 2017 and December 2023 at the First Affiliated Hospital of Wenzhou Medical University. Out of the total cohort, 44 patients developed thrombocytopenia meaning low blood platelets, 53 developed anemia meaning low red blood cells, and 56 experienced lactic acidosis meaning a dangerous buildup of acid in the blood.
To measure drug and metabolite levels accurately, the investigators used an advanced laboratory technique called ultra performance liquid chromatography tandem mass spectrometry. They quantified the trough concentrations, which are the lowest levels of a drug in the bloodstream just before the next dose, on the third day of treatment. The team also calculated estimated creatinine clearance, a standard mathematical formula used by clinicians to gauge kidney function based on age, sex, weight, and serum creatinine levels.
How Kidney Function Drives Metabolite Accumulation
Statistical evaluations revealed that lower estimated creatinine clearance strongly correlated with higher trough concentrations of linezolid and both of its major metabolites. Interestingly, the inverse correlation was much stronger for the two breakdown products than for the parent drug itself, reflecting their heavy reliance on the kidneys for elimination. The data showed that PNU-142300 had a Spearman correlation coefficient of r equals negative 0.715, while PNU-142586 showed an r value of negative 0.683, both demonstrating high statistical significance.
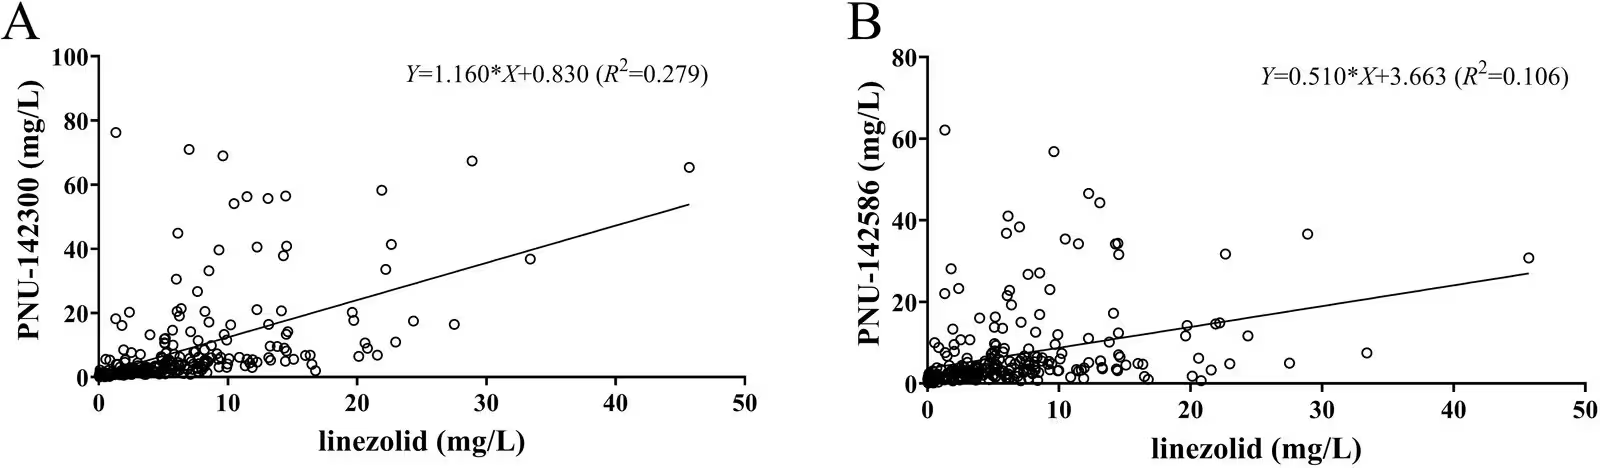
Furthermore, linear regression analysis demonstrated that parent drug levels do not serve as reliable proxies for metabolite concentrations in human serum. This finding highlights why researchers wanted to know whether measuring the metabolites directly could provide actionable clinical insights that routine blood tests miss.
The Real Link Between Drug Levels and Toxicity Outcomes
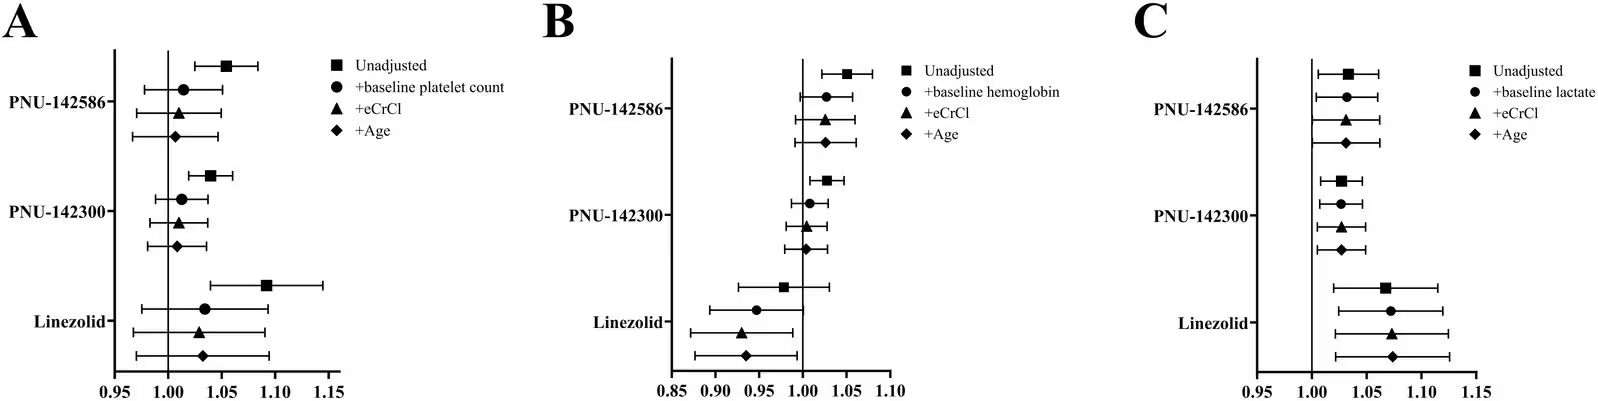
When looking at raw differences between groups, patients who developed thrombocytopenia or lactic acidosis had significantly higher trough concentrations of linezolid and both metabolites. However, once the scientists adjusted their statistical models for confounding factors such as baseline laboratory values, patient age, and kidney function, the picture changed dramatically.
After multivariable adjustment, neither PNU-142300 nor PNU-142586 showed a statistically significant independent association with thrombocytopenia or anemia. Surprisingly, linezolid itself displayed an inverse association with anemia, meaning higher parent drug levels appeared linked to a lower risk of anemia in this adjusted model. The authors caution that this unexpected result should not be interpreted as a protective effect, but rather as a reflection of unmeasured confounding variables such as total treatment duration or baseline illness severity.
By contrast, higher trough concentrations of linezolid, PNU-142300, and PNU-142586 all remained significantly associated with an increased risk of lactic acidosis after full adjustment. The adjusted odds ratios were 1.073 for linezolid, 1.027 for PNU-142300, and 1.031 for PNU-142586, though the association for the second metabolite was borderline and requires cautious interpretation.
Can Metabolite Monitoring Improve Clinical Decision-Making?
To test the practical diagnostic value of these measurements, the research team performed exploratory receiver operating characteristic analyses. A baseline clinical model comprising baseline serum lactate, kidney function, and age yielded an area under the curve of 0.675 for predicting lactic acidosis. Adding linezolid, PNU-142300, or PNU-142586 individual trough values increased the apparent area under the curve slightly to values ranging between 0.707 and 0.720.
However, formal statistical testing using paired DeLong comparisons showed that none of these numerical increases were statistically significant. Consequently, the findings indicate that tracking these specific metabolites does not currently provide a meaningful clinical advantage over standard baseline and serial laboratory assessments.
The authors emphasize several limitations in their work, including its retrospective design, reliance on a single trough measurement rather than full concentration profiles, and a limited sample size. Because the predictive models were evaluated in the exact same cohort used to develop them, prospective validation in larger, independent patient populations is strictly required before routine metabolite-specific therapeutic drug monitoring can be recommended in everyday hospital practice.
The research was published in Drug design, development and therapy on November 14, 2026.
This article has been fact checked for accuracy, with information verified against reputable sources. Learn more about us and our editorial process.
Last reviewed on .
Article history
- Latest version
Reference(s)
- Liu, Meng., et al. “Trough Concentrations of Linezolid and Its Metabolites in Relation to Renal Function and Toxicity.” Drug Design, Development and Therapy, vol. Volume 20, November 1, 2026, pp. 1-11. Informa UK Limited, doi: 10.2147/DDDT.S607396. <https://doi.org/10.2147/DDDT.S607396>.
Cite this page:
- Posted by Priya Sharma