Hidden Wiring Revealed: Why Brain Activity Can Fool Modern Mapping Tools
Simulations reveal that electrical signals only accurately reflect physical brain connections under precise dynamical conditions.
When scientists listen in on the electrical chatter of 512 interconnected brain cells, they often assume they can map out the physical wiring diagram. A detailed study published in arXiv suggests that assumption is dangerously misleading, revealing that reading brain connections from electrical activity depends heavily on subtle shifts in network dynamics.
Laia Barjuan and colleagues at the University of Barcelona used advanced computer simulations to construct 64-module neural networks with varying axon lengths. By simulating spontaneous electrical firing through the Izhikevich model, the authors tracked how well analytical tools could recover the true physical layout of the network from spike data alone. Their findings indicate that the success of mapping brain connections is not guaranteed by algorithms, but shifts depending on how chaotic or orderly the cellular chatter becomes.
Why Brain Activity Hides Physical Wiring
Neuroscientists rely on electrical recordings from multielectrode arrays or calcium imaging to understand how neurons communicate. However, watching neurons fire does not automatically reveal the physical synapses connecting them. Indirect pathways and massive bursts of coordinated activity can blur the lines between actual anatomical links and phantom associations.
To untangle this, the team applied Generalized Transfer Entropy, a mathematical method used to infer directed interactions between neurons. By comparing these inferred effective networks against the known structural ground-truth, the authors mapped out exactly when electrical signals accurately reflect physical anatomy and when they fail completely.
How Balance Between Noise and Excitation Shapes Mapping
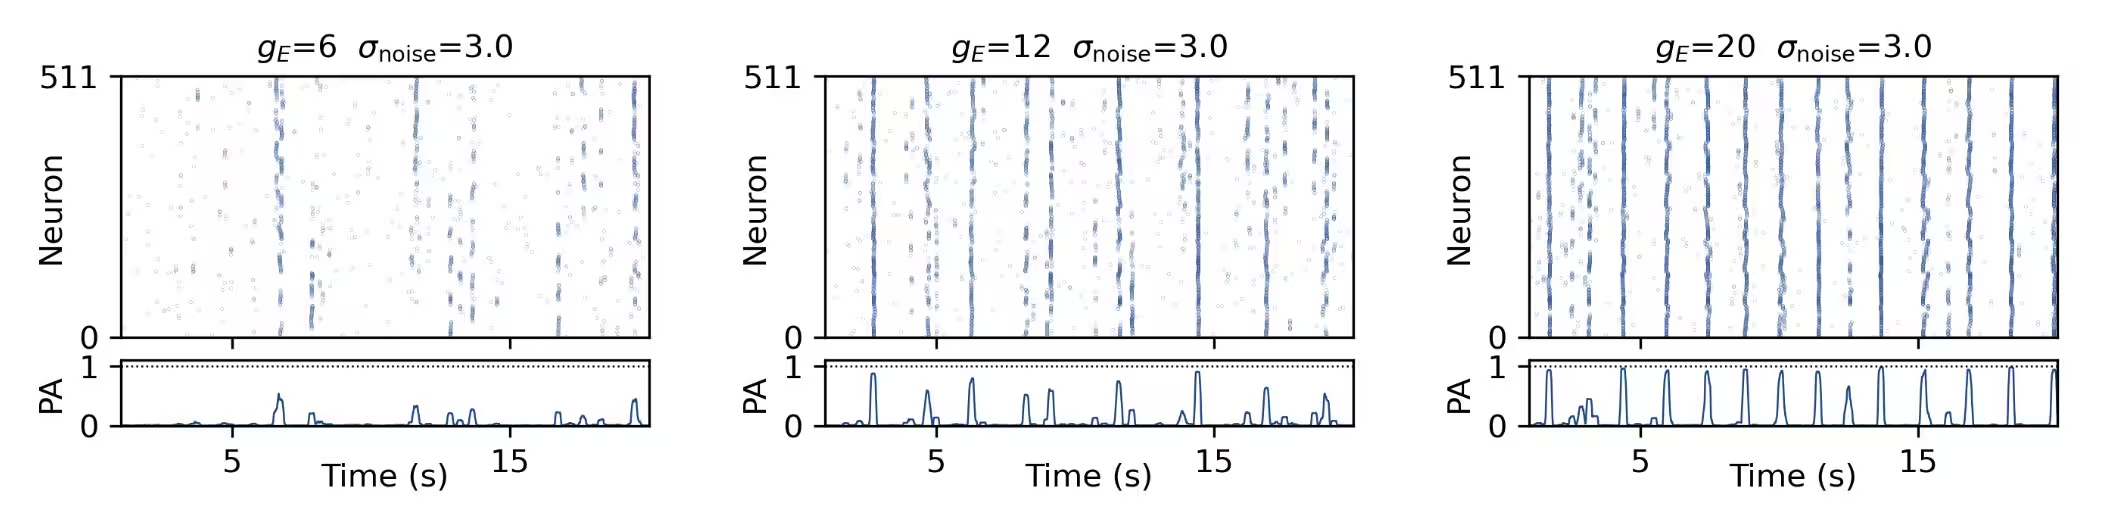
The success of reconstructing a neural network hinges entirely on its dynamical regime. When electrical noise is too high and excitation is low, the network generates random, unstructured chatter that masks meaningful connections. Conversely, when excitation is high and noise is low, the entire culture locks into synchronized bursts where every cell fires at once, washing out individual interaction details.
Between these two extremes lies a sweet spot characterized by maximal population-activity complexity. In this balanced regime, where order meets randomness, the algorithms achieve their highest F1-scores in predicting true physical links. The authors observed that this optimal mapping zone shifts toward higher noise levels when average axon lengths increase, showing that physical layout directly alters how dynamics unfold.
What Happens When Networks Become Too Modular
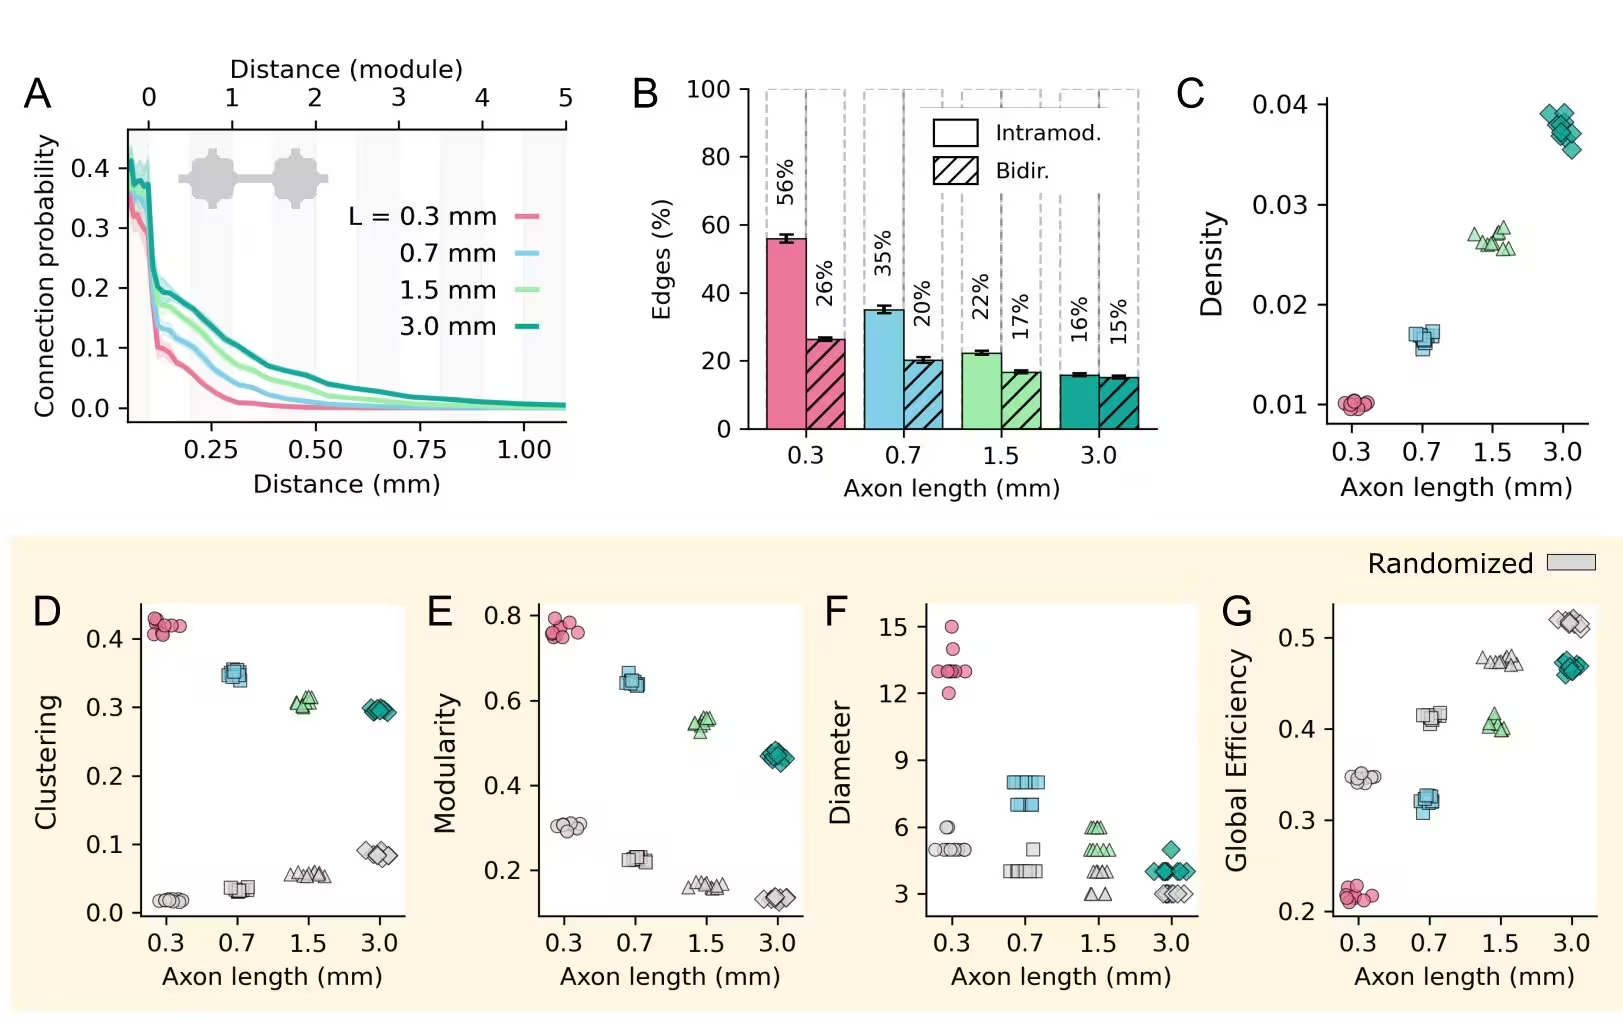
The physical architecture of the culture also plays a decisive role. Networks with very short axons of about 0.3 millimeters formed highly modular structures with isolated clusters, making it easier for algorithms to recover the presence of true connections. However, these modular setups also produced a higher rate of false positives.
As average axon lengths grew to 3 millimeters, the networks became more integrated and less modular. While this reduced false positives, it made individual structural connections harder to isolate because longer axons created complex indirect pathways. The researchers emphasize that relying on a single metric of network reconstruction can be deeply misleading, as true structural alignment requires evaluating multiple topological properties simultaneously.
The study was posted to the arXiv preprint server on November 19, 2026.
This article has been fact checked for accuracy, with information verified against reputable sources. Learn more about us and our editorial process.
Last reviewed on .
Article history
- Latest version
Reference(s)
- Barjuan, Laia. “Regime-dependent reconstruction of structural connectivity: an in silico study of spatially constrained modular neuronal networks.” arXiv.org <http://arxiv.org/abs/2611.25830v1>.
Cite this page:
- Posted by Hassan Raza