Faint Gamma-Ray Lines Found in 23,000 Galaxy Clusters Point to Dark Matter
Astronomy

Faint Gamma-Ray Lines Found in 23,000 Galaxy Clusters Point to Dark Matter

Rest-frame stacking of Fermi-LAT data uncovers multi-line gamma-ray structures that match a two-species dark matter annihilation model.

By John Williams
Published:
Email this Article
Faint Gamma-Ray Lines Found in 23,000 Galaxy Clusters Point to Dark Matter
Photo by Cosmic Timetraveler on Unsplash

A sweeping analysis of over 23,000 galaxy clusters has revealed faint, highly structured gamma-ray signatures that point toward the long-sought decay or annihilation of dark matter particles in the distant Universe. The faint spectral emissions, detected in archival data from the Fermi Large Area Telescope (LAT), emerge only when researchers correct for the motion and redshift of each individual cluster.

Dark matter accounts for roughly 85 percent of all matter in the cosmos, yet its fundamental identity remains one of physics’ greatest unsolved mysteries. Leading theories propose that dark matter consists of weakly interacting massive particles, or WIMPs, which could annihilate upon collision to produce standard model particles, including high-energy gamma-ray photons.

To hunt for these elusive signals, physicists analyzed 16.3 years of high-purity photon data around 23,343 high-latitude galaxy clusters drawn from three major catalogs, including MCXC, eROSITA, and DESI. Because individual clusters move at different velocities and reside at various distances, their emitted light arrives shifted toward longer, redder wavelengths. When the researchers transformed the stacked gamma-ray spectra into each cluster’s local rest frame, sharp spectral features popped out of what previously looked like random noise.
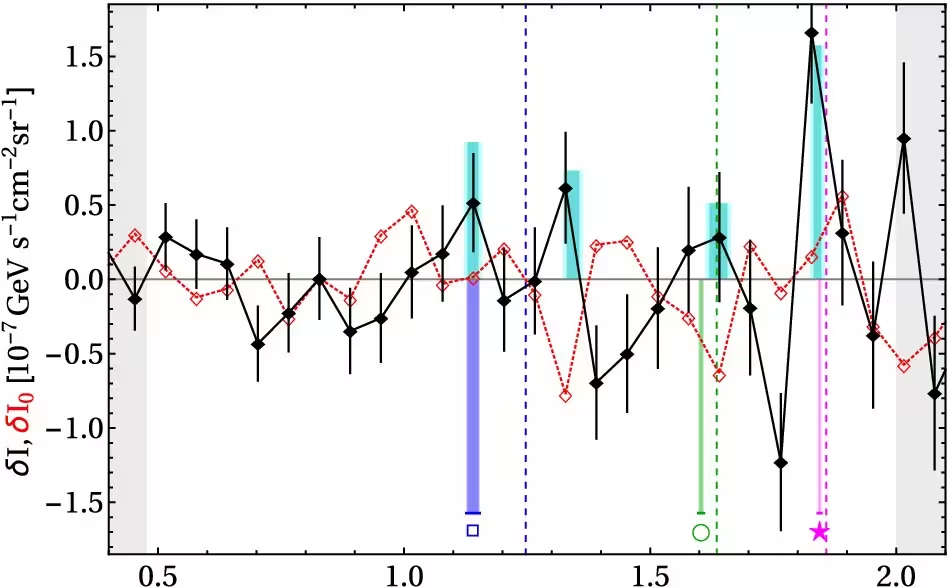
Figure 1: Stacked LAT spectrum of all clusters (S; left column) and its combination with 𝙼𝚆\mathtt{M}_{\mathtt{W}} (J; right column), before (empty red diamonds) and after (filled black diamonds) correcting for galaxy clusters (see text), rebinned at low (top row: s≃4​s0≃14.8%s\simeq 4s_{0}\simeq 14.8\%; f=0.1f=0.1 line exclusion), medium (middle row: s≃2​s0≃7.4%s\simeq 2s_{0}\simeq 7.4\%; f=0.03f=0.03), or high (bottom row: native s=s0≃3.7%s=s_{0}\simeq 3.7\%; f=0.03f=0.03; red spectrum replaced by shaded ±1​σ\pm 1\sigma band over the running four-native-bin mean) energy resolution. Emission lines with Zl>1Z_{l}>1 picked up by the matched filter within the 33–100​ GeV100\mbox{ GeV} scan range (unshaded) are shown (cyan bars of likelihood-bound widths and height ∝Zl\propto Z_{l}). The strongest blind nonad is shown as the γ​γ\gamma\gamma (magenta stars), γ​Z\gamma Z (green circles), and γ​h\gamma h (blue squares) channels (fixed-height bars indicating mass bounds) of its low (negative bars) and
Stacked LAT spectrum of all clusters (S; left column) and its combination with 𝙼𝚆\mathtt{M}_{\mathtt{W}} (J; right column), before (empty red diamonds) and after (filled black diamonds) correcting for galaxy clusters (see text), rebinned at low (top row: s≃4​s0≃14.8%s\simeq 4s_{0}\simeq 14.8\%; f=0.1f=0.1 line exclusion), medium (middle row: s≃2​s0≃7.4%s\simeq 2s_{0}\simeq 7.4\%; f=0.03f=0.03), or high (bottom row: native s=s0≃3.7%s=s_{0}\simeq 3.7\%; f=0.03f=0.03; red spectrum replaced by shaded ±1​σ\pm 1\sigma band over the running four-native-bin mean) energy resolution. Emission lines with Zl>1Z_{l}>1 picked up by the matched filter within the 33–100​ GeV100\mbox{ GeV} scan range (unshaded) are shown (cyan bars of likelihood-bound widths and height ∝Zl\propto Z_{l}). The strongest blind nonad is shown as the γ​γ\gamma\gamma (magenta stars), γ​Z\gamma Z (green circles), and γ​h\gamma h (blue squares) channels (fixed-height bars indicating mass bounds) of its low (negative bars) and Credit: Uri Keshet / arXiv

A Complex Triad Pattern Hidden in Deep Space

The newly identified features are not single isolated spikes, but rather complex arrangements of multiple emission lines known as triads and nonads. According to theoretical models, a WIMP annihilating into a photon and a neutral boson will generate distinct monochromatic gamma-ray lines whose exact energies are dictated by the mass of the particle.

The blind scan of the stacked cluster data revealed three prominent triads centered around particle masses near 70 GeV, 72 GeV, and 75 GeV. The strongest signal, a 70 GeV triad, matches previous independent observations, including an intriguing 43.2 GeV line previously reported from a smaller stack of massive clusters known as Virgo, Fornax, and Ophiuchus. These findings were published in a detailed study available on the arXiv preprint server by physicist Uri Keshet from Ben-Gurion University of the Negev.

To ensure these signals were not statistical flukes or instrumental artifacts, the author performed extensive control tests. When the stacked images were analyzed in the observer frame without correcting for cluster redshifts, or when the regions of interest were artificially shifted away from the true cluster centers, the emission lines vanished completely. Furthermore, stacking the blank sky fields surrounding the clusters yielded zero signals, confirming that the emissions originate specifically from the dense central regions of the galaxy clusters.
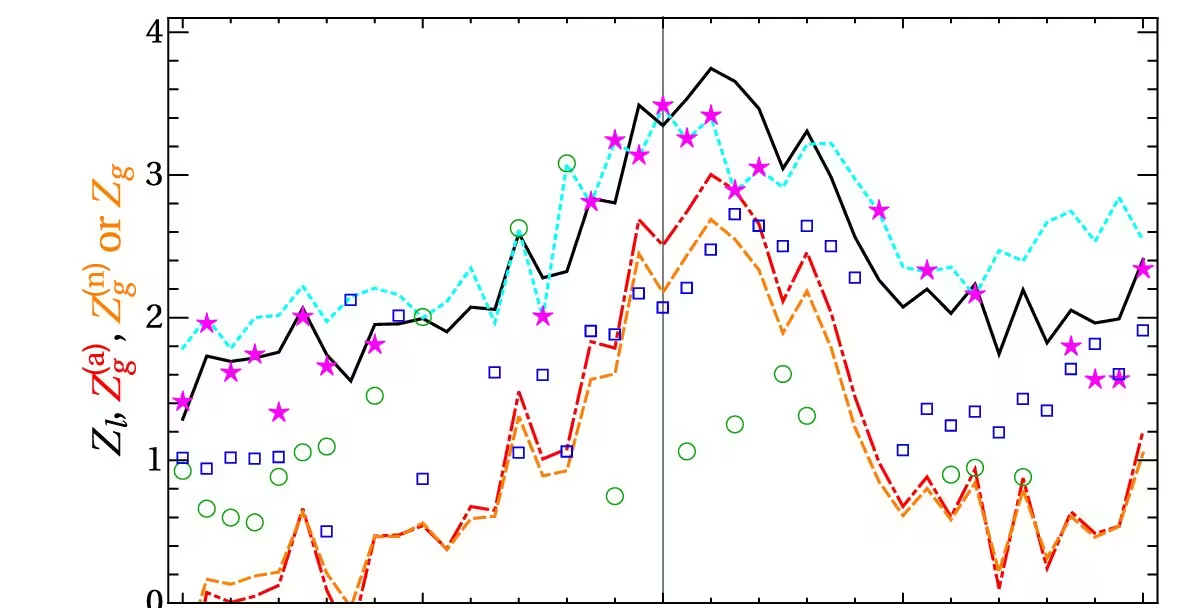
Figure 3: Response of S (left) and J (right) to redshift correction away from the α=1\alpha=1 cluster frame (vertical line; the observer frame is α=0\alpha=0). Top: ZlZ_{l} of strongest triad (solid black), line (dotted cyan), and triad channel-adjacent lines (symbols as in Fig. 1). Triad global ZZ scores shown per α\alpha as Zg(n)Z_{g}^{\smash[t]{(n)}} for S and ZgZ_{g} for J (dashed orange) and Zg(a)Z_{g}^{\smash[t]{(a)}} (analytic; dot-dashed red). Middle: channel energies of the strongest triad (symbols of size increasing with channel Zl>0Z_{l}>0, with Δ​TS=1\Delta\textrm{TS}=1 bounds as diamonds plotted every third α\alpha value even when smaller than symbol) and of single Zl>1Z_{l}>1 lines (black lines of thickness linear in ZlZ_{l} within the unshaded scan range). Bottom: channel cross sections of the strongest triad as measured (before loss corrections; symbols), with their uncertainties (diamonds, as above; outliers cropped by the frame). The dependence on α\alpha is diluted by nearby c
Response of S (left) and J (right) to redshift correction away from the α=1\alpha=1 cluster frame (vertical line; the observer frame is α=0\alpha=0). Top: ZlZ_{l} of strongest triad (solid black), line (dotted cyan), and triad channel-adjacent lines (symbols as in Fig. 1). Triad global ZZ scores shown per α\alpha as Zg(n)Z_{g}^{\smash[t]{(n)}} for S and ZgZ_{g} for J (dashed orange) and Zg(a)Z_{g}^{\smash[t]{(a)}} (analytic; dot-dashed red). Middle: channel energies of the strongest triad (symbols of size increasing with channel Zl>0Z_{l}>0, with Δ​TS=1\Delta\textrm{TS}=1 bounds as diamonds plotted every third α\alpha value even when smaller than symbol) and of single Zl>1Z_{l}>1 lines (black lines of thickness linear in ZlZ_{l} within the unshaded scan range). Bottom: channel cross sections of the strongest triad as measured (before loss corrections; symbols), with their uncertainties (diamonds, as above; outliers cropped by the frame). The dependence on α\alpha is diluted by nearby c Credit: Uri Keshet / arXiv

Testing a Two-Species Dark Matter Scenario

The presence of multiple interacting energy lines led the study to model the data through a two-species WIMP framework. In this scenario, two distinct dark matter particle species with masses around 69.7 GeV and 74.5 GeV both self-annihilate and cross-annihilate with one another, producing a total of nine specific gamma-ray lines.

When combining the cluster-stacking data with independent analyses of diffuse X-ray-correlated gamma-ray emissions across the western Galactic hemisphere, the global statistical significance of the primary dark matter nonad reached between 3.8 and 4.0 standard deviations. When folded together with earlier targeted observations of nearby massive clusters, the combined significance exceeded 5 to 6 standard deviations depending on the statistical treatment.
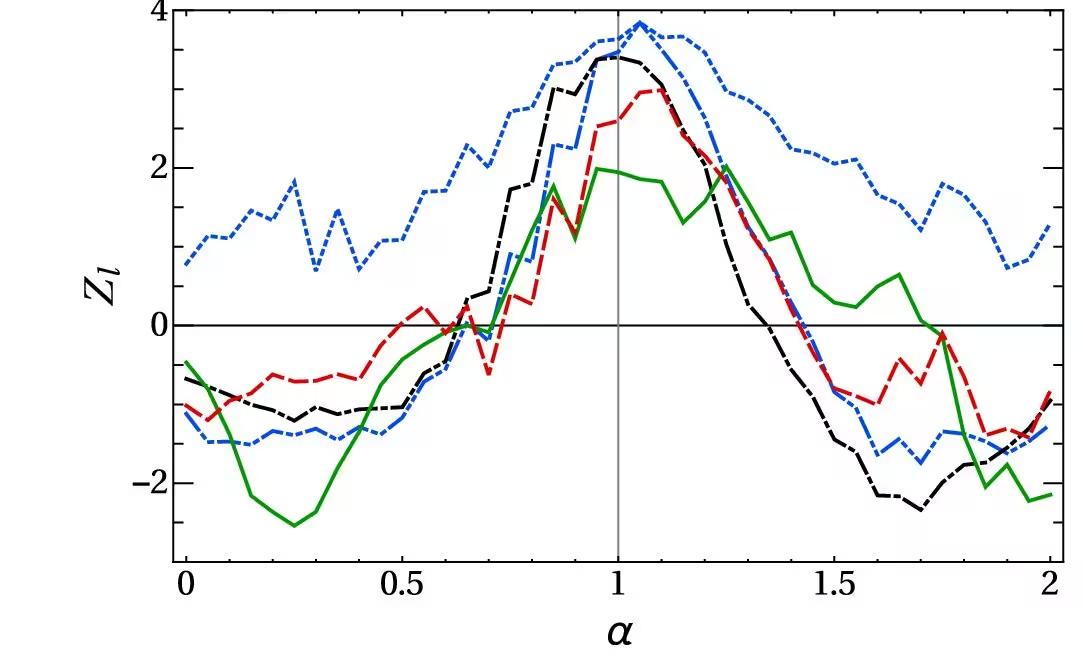
Figure 4: Local ZlZ_{l} as a function of α\alpha among the most distant (0.38<z<0.500.38<z<0.50) tertile of S clusters, for fixed spectral features: the a priori L43L_{43} (solid green), T72T_{72} (dashed red), and the 𝙲𝚆\mathtt{C}_{\mathtt{W}} nonad (blind, masses scaled by 1.03; dot-dashed black). Also shown are the nominal nonad (blind {69.8,74.5}​ GeV\{69.8,74.5\}\mbox{ GeV} of S at α=1\alpha=1; double-dot-dashed blue) and the strongest blind nonad at each α\alpha (dotted blue).
Local ZlZ_{l} as a function of α\alpha among the most distant (0.38<z<0.500.38<z<0.50) tertile of S clusters, for fixed spectral features: the a priori L43L_{43} (solid green), T72T_{72} (dashed red), and the 𝙲𝚆\mathtt{C}_{\mathtt{W}} nonad (blind, masses scaled by 1.03; dot-dashed black). Also shown are the nominal nonad (blind {69.8,74.5}​ GeV\{69.8,74.5\}\mbox{ GeV} of S at α=1\alpha=1; double-dot-dashed blue) and the strongest blind nonad at each α\alpha (dotted blue). Credit: Uri Keshet / arXiv

Despite the high statistical significance, experts note several subtle tensions in the data. For instance, the strength of the signal scales more weakly with individual cluster J-factors, a measure of dark matter density, than standard theoretical predictions suggest. Additionally, the signal distribution varies somewhat across different redshift intervals.

If confirmed by future space missions and more sensitive instruments, the discovery of these gamma-ray lines would provide direct empirical evidence for particle dark matter, shedding light on the invisible scaffolding that shapes the large-scale structure of our Universe.

The study was posted to the arXiv preprint server on November 16, 2026.

Fact Checked

This article has been fact checked for accuracy, with information verified against reputable sources. Learn more about us and our editorial process.

Last reviewed on .

Article history

  • Latest version

Reference(s)

  1. Keshet, Uri. “Rest-frame annihilation lines of $\sim70$ GeV WIMPs in 23,000 stacked galaxy clusters.” arXiv.org <http://arxiv.org/abs/2611.21595v1>.

Cite this page:

Williams, John. “Faint Gamma-Ray Lines Found in 23,000 Galaxy Clusters Point to Dark Matter.” BioScience. BioScience ISSN 2521-5760, 17 November 2026. <https://www.bioscience.com.pk/en/subject/astronomy/rest-frame-annihilation-lines-of-sim70-gev-wimps-in-23-000-stacked-galaxy-clusters>. Williams, J. (2026, November 17). “Faint Gamma-Ray Lines Found in 23,000 Galaxy Clusters Point to Dark Matter.” BioScience. ISSN 2521-5760. Retrieved November 17, 2026 from https://www.bioscience.com.pk/en/subject/astronomy/rest-frame-annihilation-lines-of-sim70-gev-wimps-in-23-000-stacked-galaxy-clusters Williams, John. “Faint Gamma-Ray Lines Found in 23,000 Galaxy Clusters Point to Dark Matter.” BioScience. ISSN 2521-5760. https://www.bioscience.com.pk/en/subject/astronomy/rest-frame-annihilation-lines-of-sim70-gev-wimps-in-23-000-stacked-galaxy-clusters (accessed November 17, 2026).
End of the article