Hidden Link Between Cosmic Radio Flashes and the Universe Revealed
New calculations show how fast radio bursts and the cosmic web interact, solving a key statistical puzzle for upcoming telescopes.
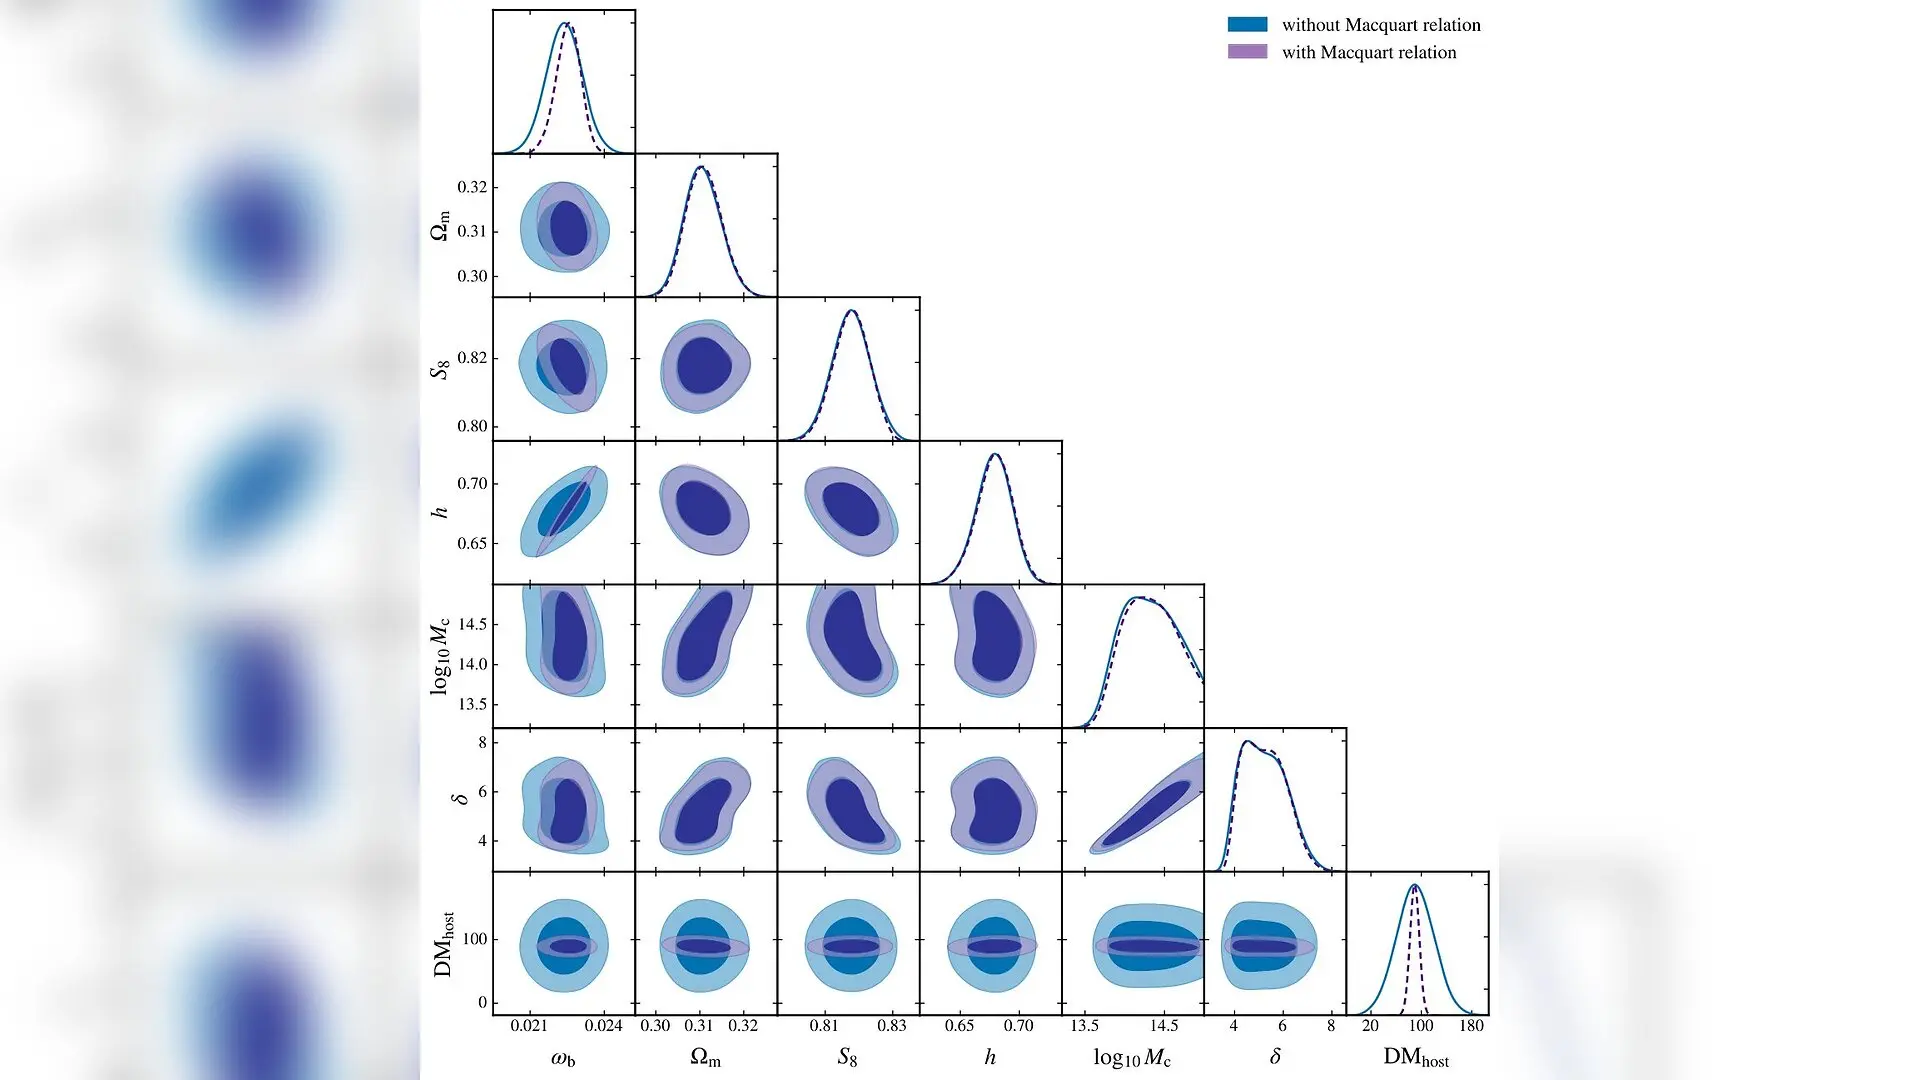
A mysterious link between millisecond-duration radio flashes and the cosmic web has finally been mapped out, offering fresh clues about the missing matter of the Universe. Researchers studying fast radio bursts, which are intense extragalactic pulses of energy lasting just a fraction of a second, have calculated how two major observational tools can be safely combined without throwing off cosmological measurements.
When these signals travel across billions of light-years, they are delayed by free electrons floating in space. The total delay, known as the dispersion measure, acts like a cosmic odometer that records all the ionized gas encountered along the way. Astronomers typically extract two distinct types of statistics from these catalogs, including the distance-based Macquart relation and the spatial clustering power spectrum of the dispersion measure field.
The new work, available on the arXiv preprint server, demonstrates that these two complementary tools share a statistical coupling originating from large-scale density fluctuations. Because both measurements rely on the exact same underlying distribution of electrons, analyzing them together requires knowing their cross-covariance. Investigators Amy Wayland and Robert Reischke derived this complex relationship using advanced theoretical modeling, revealing that only the largest scale components of individual bursts correlate with the broader angular power spectrum.
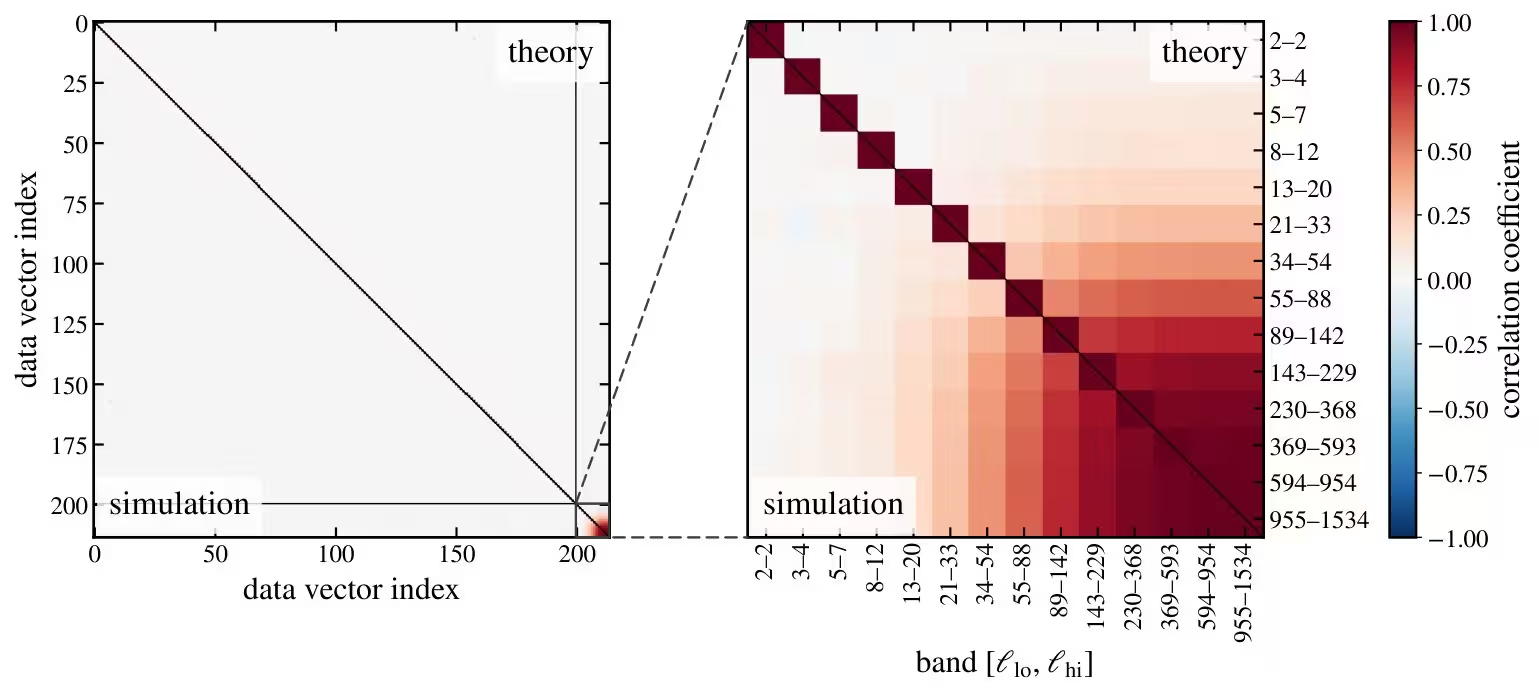
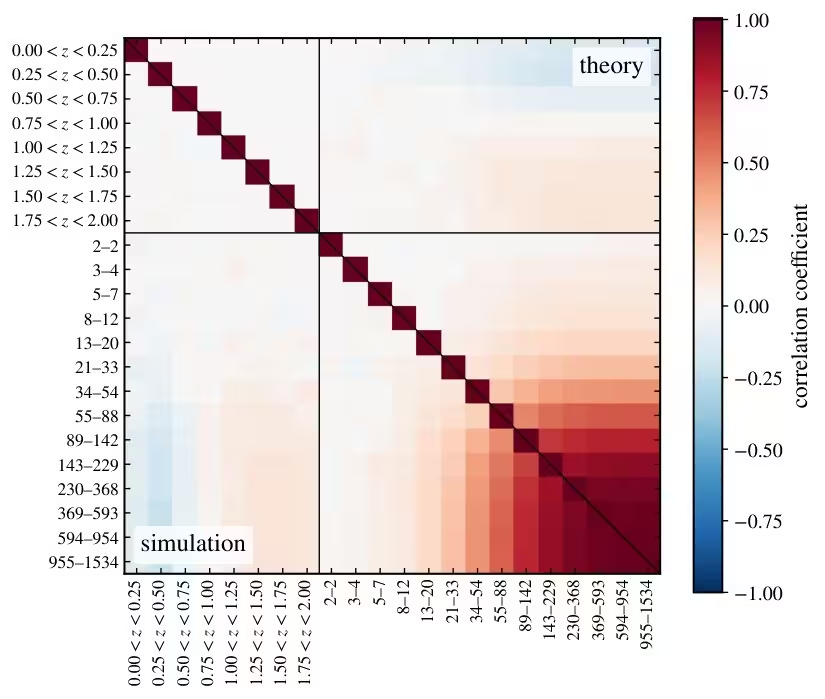
To confirm their mathematical framework, the authors tested their equations against five thousand forward-simulated catalogs, each populated by ten thousand simulated bursts. These large-scale models showed that while individual dispersion measures correlate with power spectrum bandpowers at only the one percent level, binning the data into redshift groups increases the correlation coefficients up to roughly 0.2. Despite this noticeable increase, the team discovered that neglecting the cross-covariance changes the width of the chi-squared distribution by less than one percent for wide-area surveys.
Why Cosmic Radio Flashes Matter for Precision Mapping
The practical independence of these two observables provides a major advantage for upcoming astronomical surveys. Researchers can combine the statistical likelihoods of the Macquart relation and the dispersion measure power spectrum without needing to compute complex cross-terms for every single measurement. This simplification paves the way for powerful joint forecasts involving next-generation facilities such as the Vera C. Rubin Observatory’s Rubin Survey.
When incorporating the Macquart relation into weak lensing forecasts, the team found significant improvements in specific cosmological parameters. The uncertainty regarding the mean host galaxy contribution shrank by a factor of 4.1, dropping to just 7.3 cubic centimeters per second of dispersion measure offset. Furthermore, constraints on the physical baryon density improved by 32 percent, primarily by targeting the parameter combination that dictates the overall amplitude of the dispersion measure relation.
What Happens When Cosmic Calibration Goes Wrong
Even though the cross-covariance can be safely ignored for current survey designs, the study highlights a critical requirement for interpreting future datasets. Most detected flashes do not have identified host galaxies with measured spectroscopic redshifts, meaning astronomers must infer their distances by mapping observed dispersion measures back to a modeled mean relation.
If that mean relation contains even a small systematic error, such as a twenty percent mismatch, it propagates directly into the inferred redshift distribution. The authors showed that this kind of shift can bias the predicted angular power spectrum by up to two standard deviations per band for a sample of half a million bursts. By fitting both the host-identified subset and the wider catalog using consistent parameters, future surveys can successfully self-calibrate and avoid these hidden biases.
The study was posted to the arXiv preprint server on November 5, 2026.
This article has been fact checked for accuracy, with information verified against reputable sources. Learn more about us and our editorial process.
Last reviewed on .
Article history
- Latest version
Reference(s)
- Wayland, Amy. “Joint analysis of the Macquart relation and the dispersion measure power spectrum: cross-covariance and redshift self-calibration.” arXiv.org <http://arxiv.org/abs/2611.08481v1>.
Cite this page:
- Posted by Karan Das