Telescope Simulations Reveal How to Spot Hidden Dust Rings Around Nearby Sun-Like Stars
New models show that nulling interferometry at the Very Large Telescope can isolate faint exozodiacal dust, though geometric degeneracies pose challenges.
Astronomers studying the dusty environments surrounding nearby stars have evaluated how a specialized instrument at the Very Large Telescope Interferometer in Chile could detect faint rings of warm planetary debris. The research models the performance of the Nulling Observations of exoplaneTs and dusT instrument, known as NOTT, in revealing hot exozodiacal dust around mature Sun-like stars. The findings were published in a study available on the arXiv preprint server.
Hot exozodiacal dust consists of microscopic grains orbiting extraordinarily close to a host star, often near the sublimation radius where extreme heat vaporizes silicate minerals. Although previous surveys using near-infrared photometry and interferometry have identified excess thermal emission around roughly 40 main-sequence stars, the physical mechanisms that continuously replenish these short-lived grains remain debated. Because submicron particles are rapidly destroyed by radiation pressure and sublimation, their ongoing presence points to active cometary fragmentation or planetesimal grinding within the inner planetary system.
How Nulling Interferometry Isolates Faint Circumstellar Dust
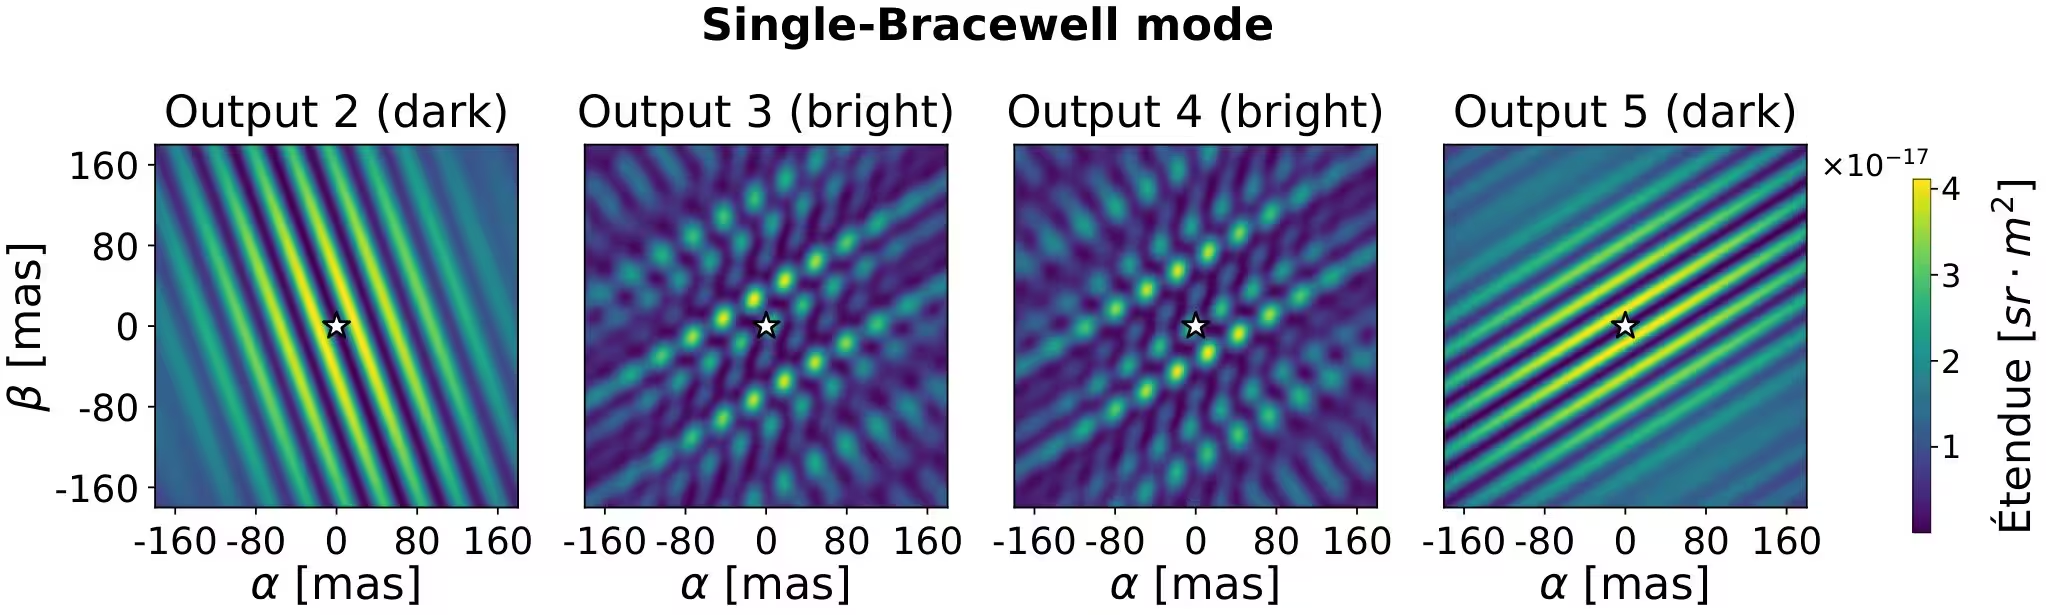
Detecting this warm dust is exceptionally difficult because the thermal glow from the circumstellar grains is vastly outshone by the direct light of the host star. To overcome this contrast barrier, NOTT employs nulling interferometry in the mid-infrared $L’$ band, covering wavelengths between 3.5 and 4.0 micrometers. By introducing a precise phase shift of 180 degrees between light collected by different telescope apertures, the instrument creates destructive interference directly on the star, effectively canceling out its blinding glare while letting off-axis thermal emission from surrounding dust pass through.
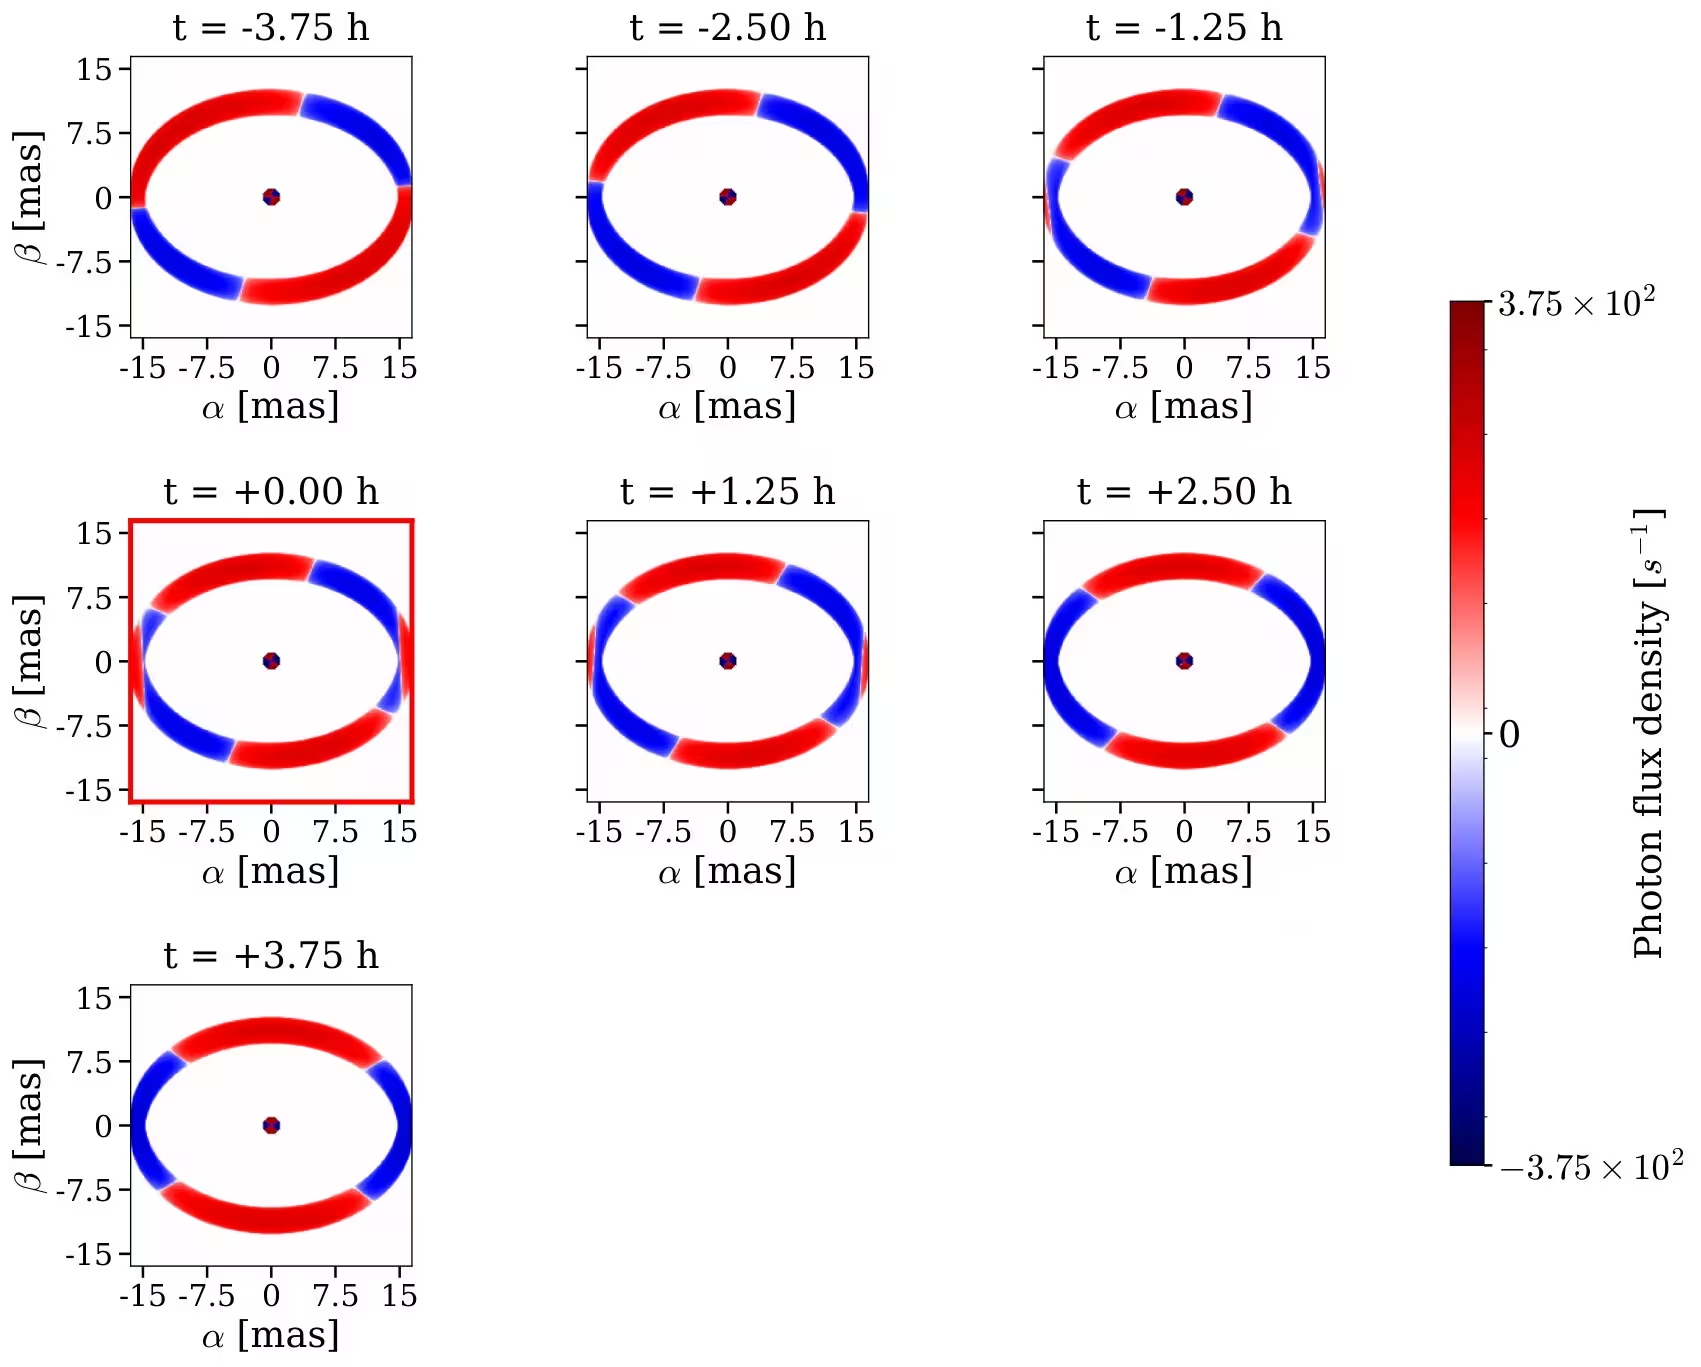
The research team modeled the instrument’s response using the nearby G8V star Tau Ceti, located just 3.65 parsecs away, which serves as a premier benchmark target due to its Sun-like nature and known infrared excess. The authors simulated an optically thin dust ring composed of graphite grains with a radius of 0.1 micrometers, situated between 0.054 and 0.06 astronomical units from the star. By applying the end-to-end simulation software SCIFYsim, the investigators tracked how the photon flux rate and the null depth vary over a 7.5-hour observing window centered on the target’s meridian transit.
What the Simulated Observations Reveal About Dust Geometry
The simulations demonstrate that as Earth’s rotation causes the interferometric fringe pattern to sweep across the target, the combined signal produces a distinct temporal modulation. In the symmetric dual-Bracewell combiner mode, the expected null depth for Tau Ceti reaches a maximum of roughly $4.4 imes 10^{-3}$ and a minimum of $1.5 imes 10^{-3}$, remaining well above the instrument’s expected single-measurement precision threshold of about $4 imes 10^{-4}$. This clear variability allows researchers to disentangle stellar leakage from the genuine contribution of the circumstellar dust ring.
Furthermore, the team explored how variations in ring inclination, position angle, and radial extent impact the observable signal. A face-on ring produces a nearly constant signal over time because its circular symmetry uniformly overlaps the transmission lobes of the interferometer. In contrast, increasing the inclination to an edge-on configuration breaks that symmetry, causing the thermal flux to couple alternately into positive and negative transmission regions as the projected baselines rotate.
Challenges Posed by Parameter Degeneracies and Future Outlook
While the models confirm that NOTT possesses unprecedented sensitivity for characterizing hot exozodiacal dust, the analysis also highlights significant observational challenges. Specifically, different combinations of ring inclination and position angle can yield nearly identical temporal signatures, creating parameter degeneracies that prevent a unique geometric reconstruction from a single observing mode alone. Resolving these ambiguities will require dedicated follow-up campaigns utilizing multiple beam-combiner configurations and baseline permutations.
The authors also tested their models on other prominent stellar systems, including the F-type subgiant star Kappa Tuc A and the A-type star Fomalhaut. Their projections indicate that adapting the baseline configuration to match the specific angular scale of each target’s circumstellar debris will be essential for future surveys. Ultimately, these findings provide a foundational framework for interpreting upcoming high-contrast observations and constraining the architecture of inner planetary systems.
The study was posted to the arXiv preprint server on November 18, 2026.
This article has been fact checked for accuracy, with information verified against reputable sources. Learn more about us and our editorial process.
Last reviewed on .
Article history
- Latest version
Reference(s)
- Ollmann, K., et al. “Asgard/NOTT: L -band nulling interferometry at the VLTI – IV. Prospects for characterizing hot exozodiacal dust.” Monthly Notices of the Royal Astronomical Society, vol. 553, no. 2, October 24, 2026 Oxford University Press (OUP), doi: 10.1093/mnras/stag2034. <https://doi.org/10.1093/mnras/stag2034>.
Cite this page:
- Posted by John Williams