Hidden Data Redundancy Skews Laser 3D Printing Simulations
A new methodological study reveals how coordinate duplication and snapshot drift alter fluid dynamics interpretations in metal 3D printing models.
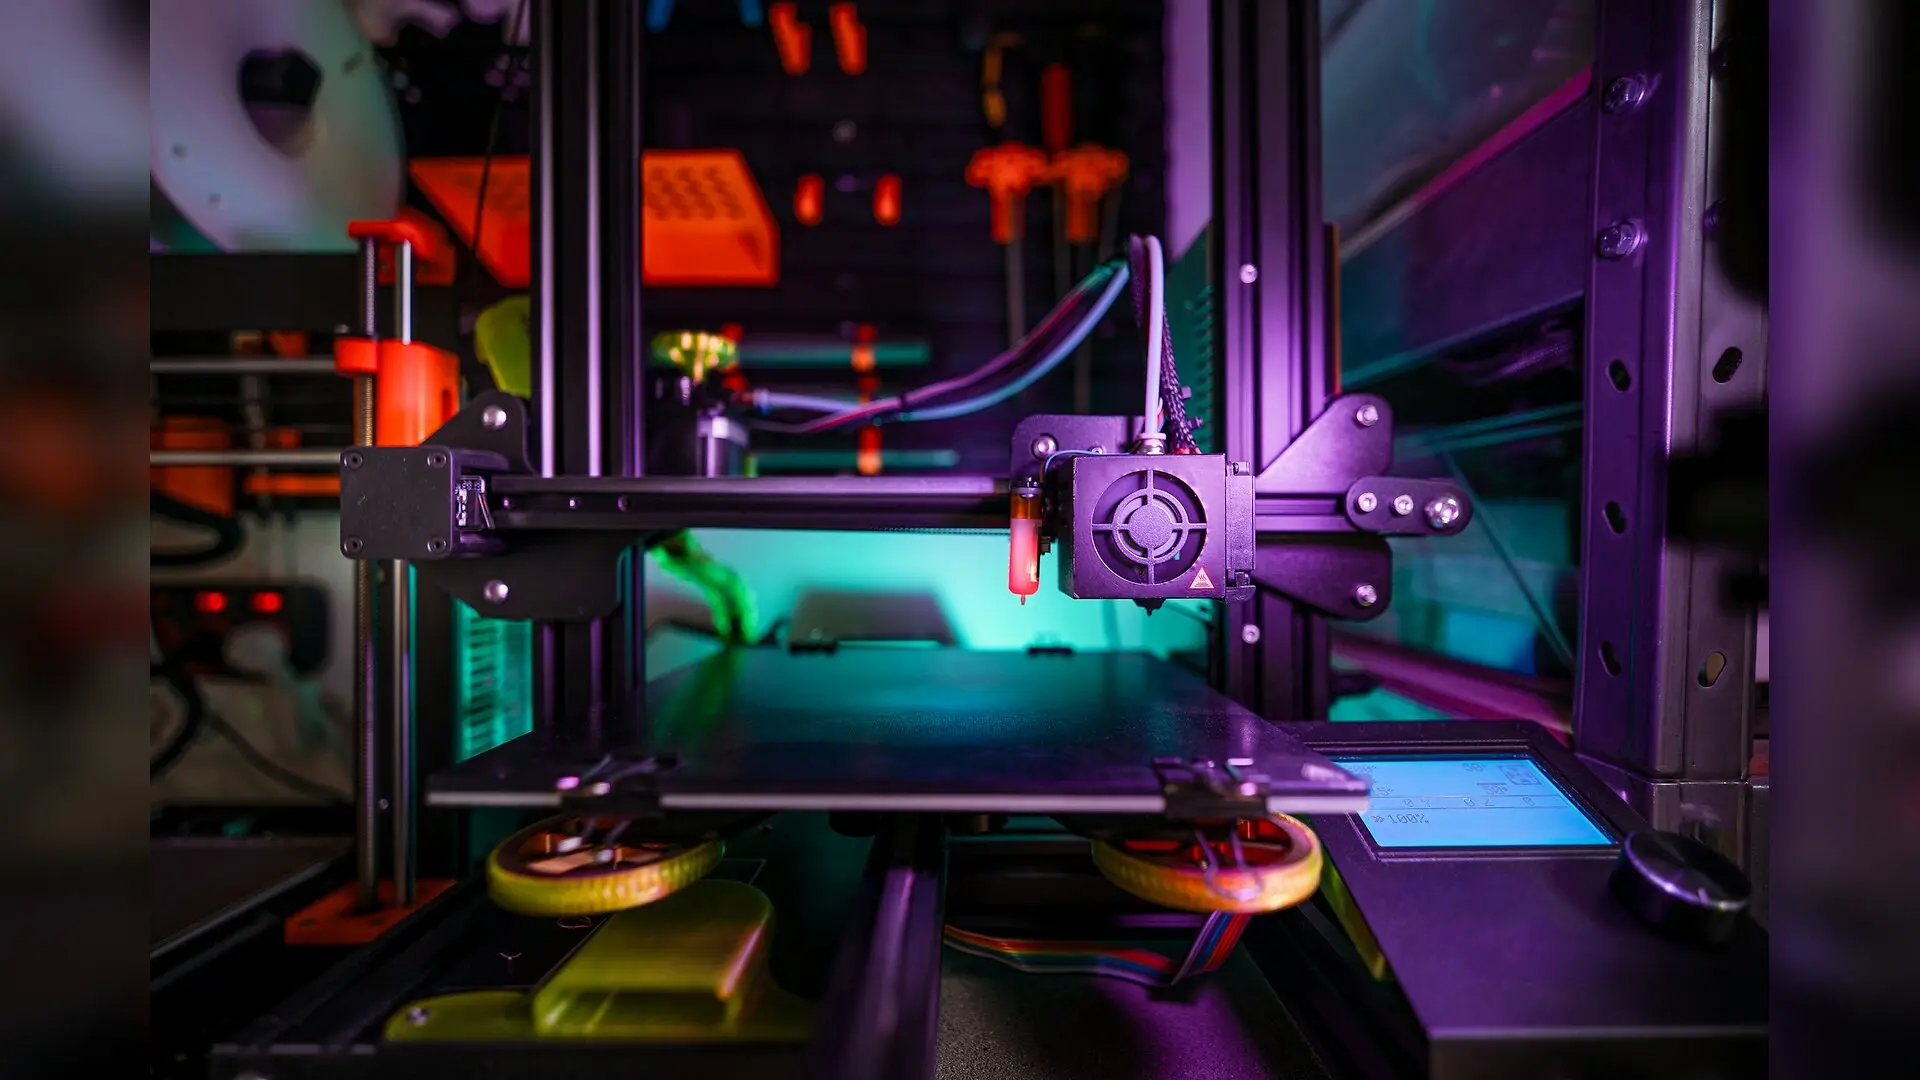
Laser simulations of metal 3D printing often export complex melt pool data as messy clouds of points rather than neat mathematical grids, making it difficult to compare different manufacturing conditions. When scientists inspect how liquid metal flows under high-intensity heat, even small choices in computer processing can create false vortex patterns that do not reflect physical reality. A new study demonstrates that coordinate duplication, neighborhood sizing, and threshold settings heavily skew fluid dynamics interpretations in computational fluid dynamics exports.
How Point Cloud Duplication Distorts Metal Flow Analysis
During laser directed energy deposition, which is a manufacturing technique used to repair and build metal parts layer by layer, energy delivery creates a dynamic, high-temperature pool of molten metal. Numerical simulations model this behavior by outputting thousands of spatial points containing temperature, pressure, and velocity vectors. However, the raw data frequently contains severe coordinate duplication where identical rows are repeated up to six times. This redundancy artificially inflates local point densities and distorts the mathematical matrices used to calculate fluid rotation.
The research team examined thirty computational exports spanning six laser power levels ranging from 200 W to 450 W across five distinct time snapshots. They found that coordinate-duplicate ratios reached up to 82.8 percent across the dataset. To prevent this redundancy from warping spatial calculations, the authors applied an exact-coordinate consolidation method, averaging physical variables within matching spatial classes. Without this data normalization, overlapping coordinates disproportionately weight local neighborhoods and distort least-squares gradient reconstructions.
Testing Reconstructed Flow Topology and Velocity Gradients
Because the original simulation software did not export native velocity gradients or vortex identifiers, the investigators reconstructed local fluid movement using weighted least squares regression. They evaluated topological activity using the Q-criterion, a mathematical metric that separates fluid rotation from stretching and strain. Further details about these computational tests can be found in the analysis published in PLOS One.
Testing across 43 different neighborhood sizes revealed that while general directional trends remained stable for basic rotation indicators, higher threshold percentiles changed significantly depending on model order and local geometry. Manufactured analytic fields confirmed that the regression technique recovered simple affine deformations to near-zero error, but nonlinear flow features showed strong scale dependence. When feature sizes shrank, gradient errors increased, demonstrating that topological indicators are bounded by spatial resolution limits.
Temporal Stability and the Limits of Power Comparisons
The evaluation also uncovered significant temporal drift during the late stages of the simulation window. None of the analyzed power levels satisfied all eleven pre-specified temporal stability criteria between 0.50 and 0.70 seconds. Maximum velocity values fluctuated by up to 37.6 percent, and specific power-pairwise trends reversed direction when measured at different time steps. This instability indicates that late-time snapshots represent transient behaviors rather than a true steady state.
Furthermore, peak velocity comparisons between 350 W and 450 W conditions showed that differences were largely confined to sparse upper-tail events rather than whole-pool flow shifts. Central velocity ranges between the 350 W and 400 W simulations heavily overlapped, meaning that peak metrics alone cannot be interpreted as proof of enhanced overall circulation. The findings emphasize that computational melt pool descriptors require strict support filtering and careful boundary checks before researchers draw conclusions about laser manufacturing physics.
The research was published in PLOS One on November 20, 2026.
This article has been fact checked for accuracy, with information verified against reputable sources. Learn more about us and our editorial process.
Last reviewed on .
Article history
- Latest version
Reference(s)
- Song, Boxue., et al. “Sensitivity of L-DED melt-pool descriptors to point-cloud representation and gradient reconstruction.” PLOS One, vol. 21, no. 11, November 20, 2026, pp. e0362947 Public Library of Science (PLoS), doi: 10.1371/journal.pone.0362947. <https://doi.org/10.1371/journal.pone.0362947>.
Cite this page:
- Posted by Aisha Ahmed