Supercooled Water Simulations Reveal the Hidden Physics of Glassy Arrest
Physics

Supercooled Water Simulations Reveal the Hidden Physics of Glassy Arrest

Computer models reconcile decades of conflicting laboratory data by separating liquid thermodynamics from kinetic freeze.
By Farah Siddiqui
Published:
Email this Article
Supercooled Water Simulations Reveal the Hidden Physics of Glassy Arrest
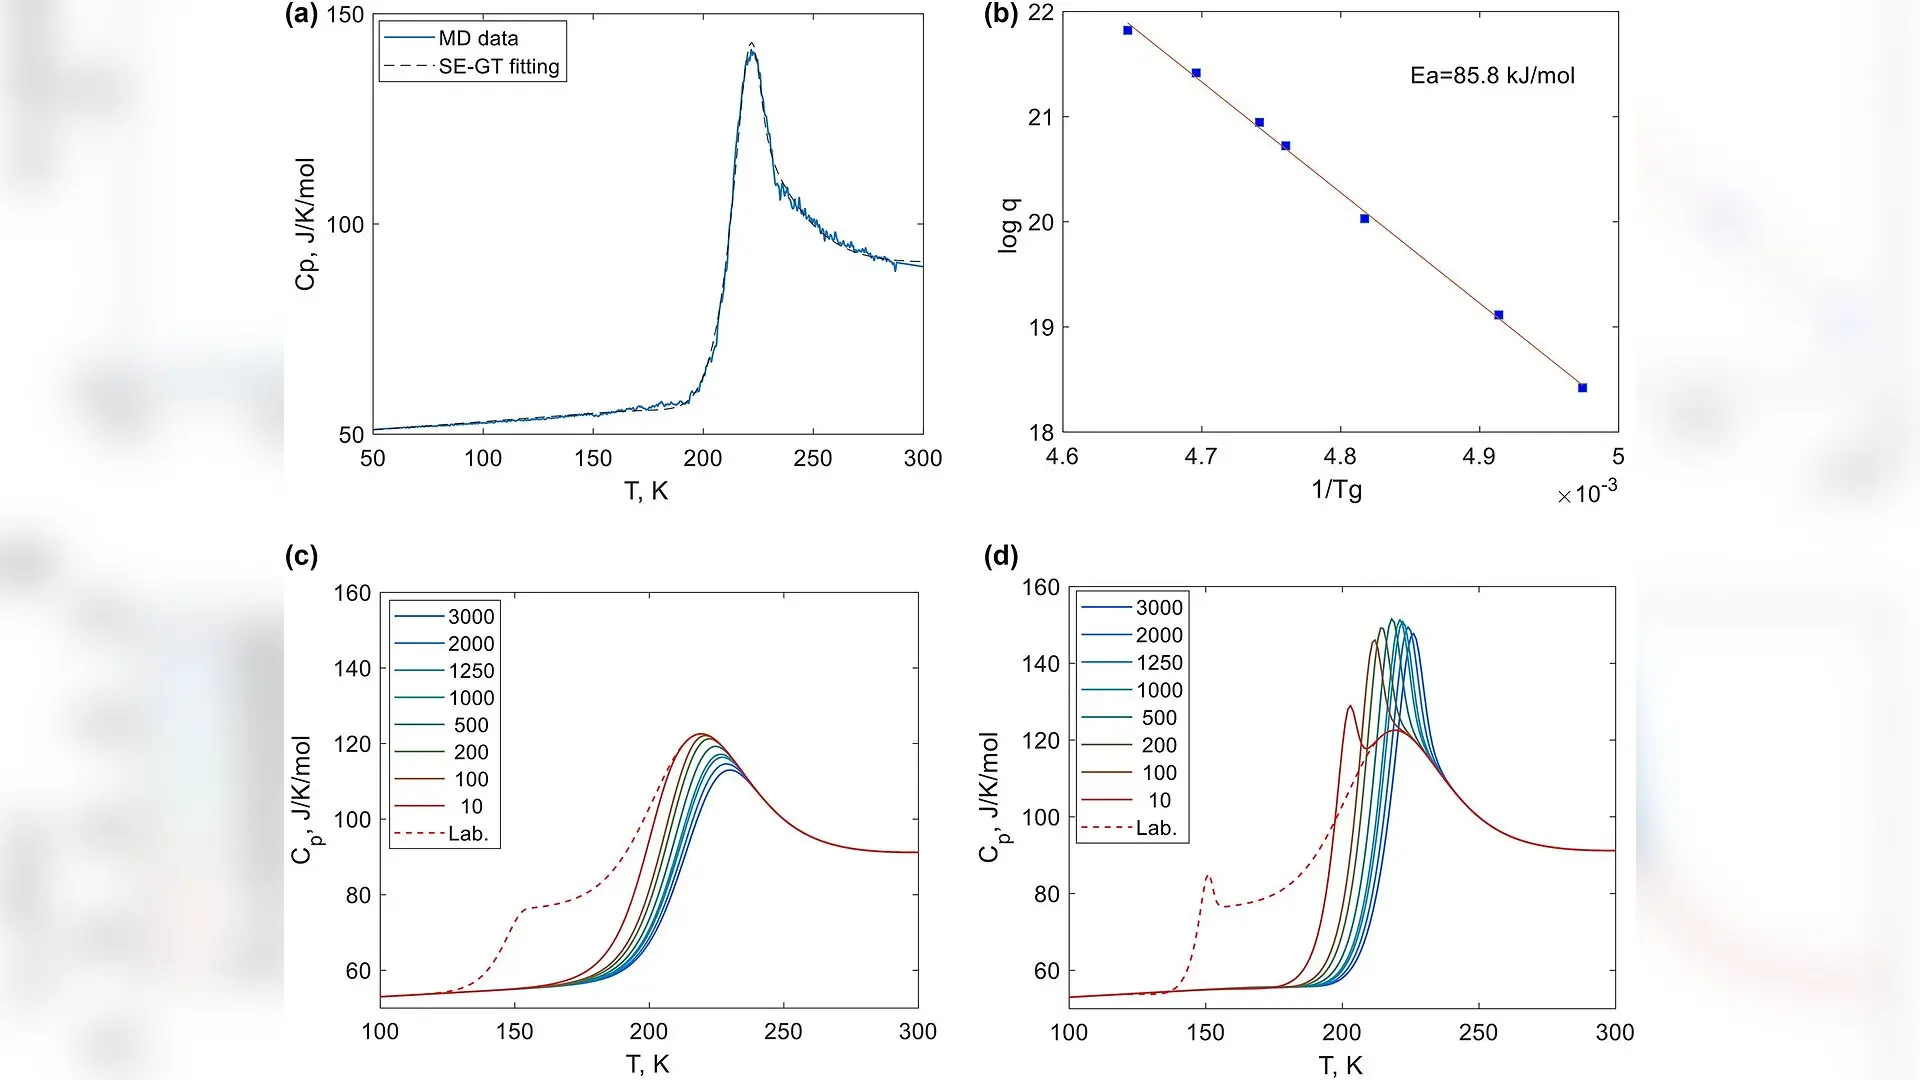
The heat capacity of TIP4P/2005 water obtained on heating at 1000 K/µs and fitting with the SE-GT model (a). The log of the scan rate q as a function of the reciprocal glass transition temperature; the activation energy is a mean value obtained using Moynihan equation and Eq. 1 (b). SE-GT model data generated for cooling (c) and heating (d) for the scan rates used in MD simulations (in K/µs) and the laboratory time scale of 10 K/min. Kocherbitov et al. / Scientific Reports

Supercooled water undergoes a kinetic freeze near 220 Kelvin, where molecular motion suddenly shifts from equilibrium dynamics to glassy arrest. This temperature region overlaps directly with the structural transformation between high-density liquid and low-density liquid configurations, making it notoriously difficult to study experimentally.

To untangle this complex thermodynamic behavior, researcher Vitaly Kocherbitov utilized extensive molecular dynamics simulations to model the thermal properties of water. The work, published in Scientific Reports, demonstrates how equilibrium thermodynamics and nonequilibrium glass dynamics interact during rapid cooling and heating scans.

How Varying Scan Speeds Reveal Equilibrium

Water exhibits numerous anomalies, such as an exceptionally high heat capacity and a density maximum at 277 Kelvin under ambient pressure. When scientists cool water below its normal freezing point without crystallization, these unusual properties become even more pronounced. However, experimental work in this regime is heavily restricted by spontaneous ice formation in what researchers call the no man’s land.

To bypass crystallization and probe microscopic mechanisms, computational models are essential. The author simulated a large box containing 4,096 water molecules using the TIP4P/2005 water model, applying cooling and heating scan rates spanning from 10 to 3,000 Kelvin per microsecond. At temperatures above approximately 220 Kelvin, both molar volume and enthalpy remained completely independent of the cooling rate. This independence confirms that the simulations capture true equilibrium thermodynamic behavior in that temperature range.
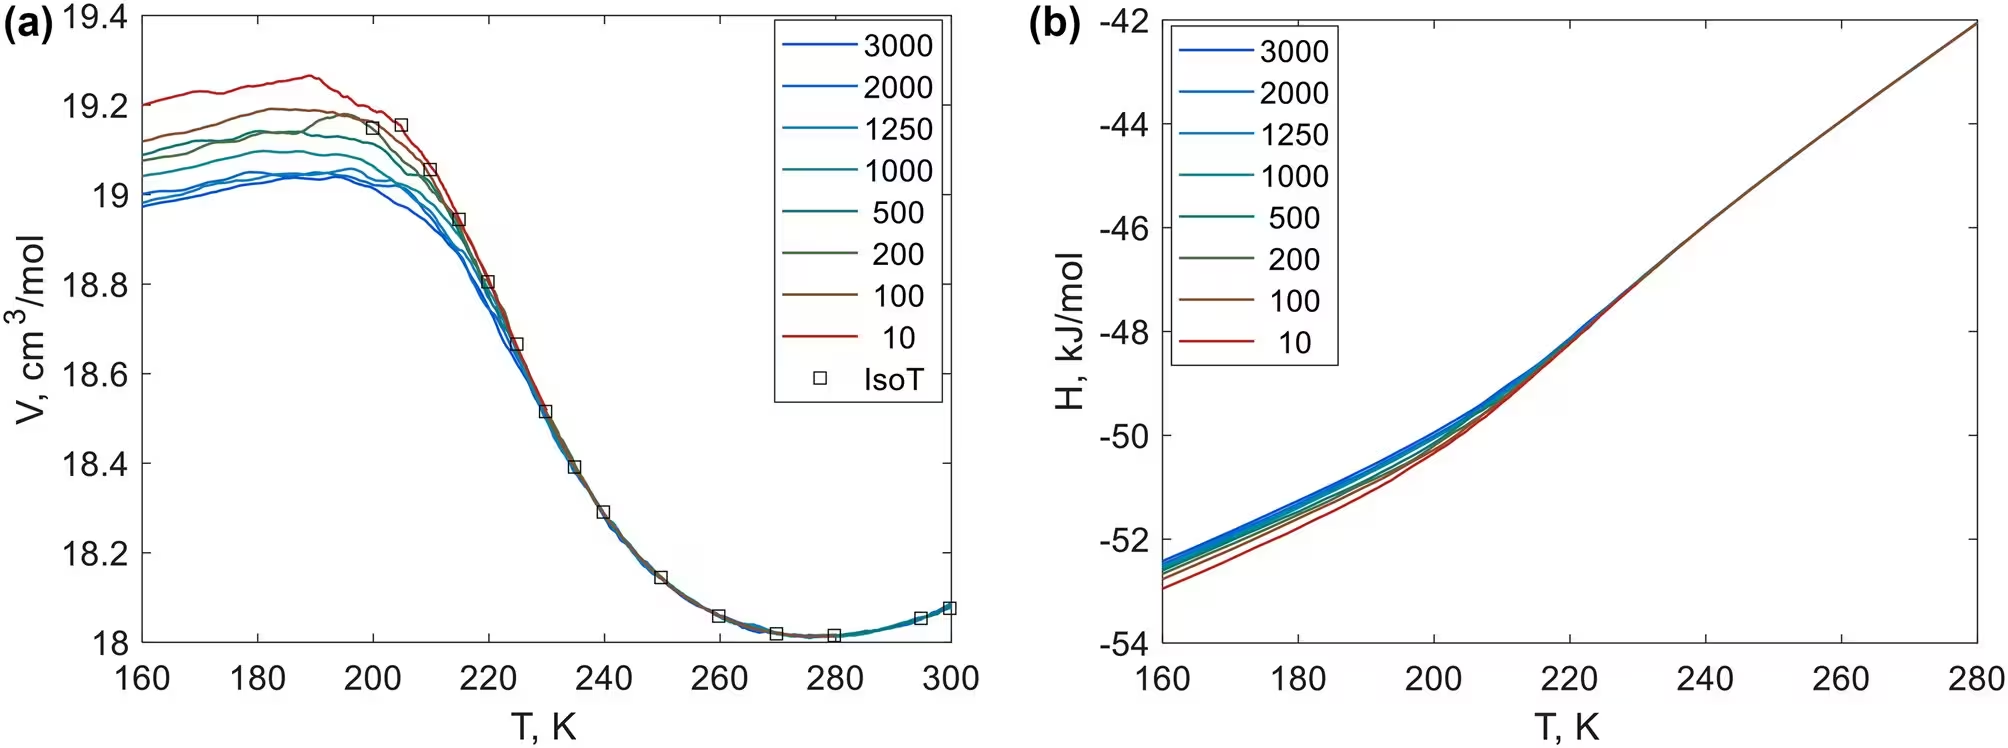
Fig. 1: The molar volume of water obtained in MD simulations with different cooling rates (K/µs) shown in the legend. The squares represent isothermal 100 ns runs (a). The molar enthalpy obtained in the same cooling scans (b).
The molar volume of water obtained in MD simulations with different cooling rates (K/µs) shown in the legend. The squares represent isothermal 100 ns runs (a). The molar enthalpy obtained in the same cooling scans (b). Credit: Kocherbitov et al. / Scientific Reports

Below 220 Kelvin, however, the curves begin to diverge based on how quickly the system is cooled. Faster scans deviate first, reflecting the onset of kinetic arrest where molecules can no longer rearrange fast enough to maintain thermal equilibrium.

Two Distinct Viscosity Regimes Shape Liquid Dynamics

The sluggish dynamics of supercooled water are reflected in a sharp increase in viscosity and a concurrent drop in the self-diffusion coefficient. By calculating viscosity through perturbation and fluctuation methods, the simulations uncovered two distinct activation energy regimes operating in tandem.
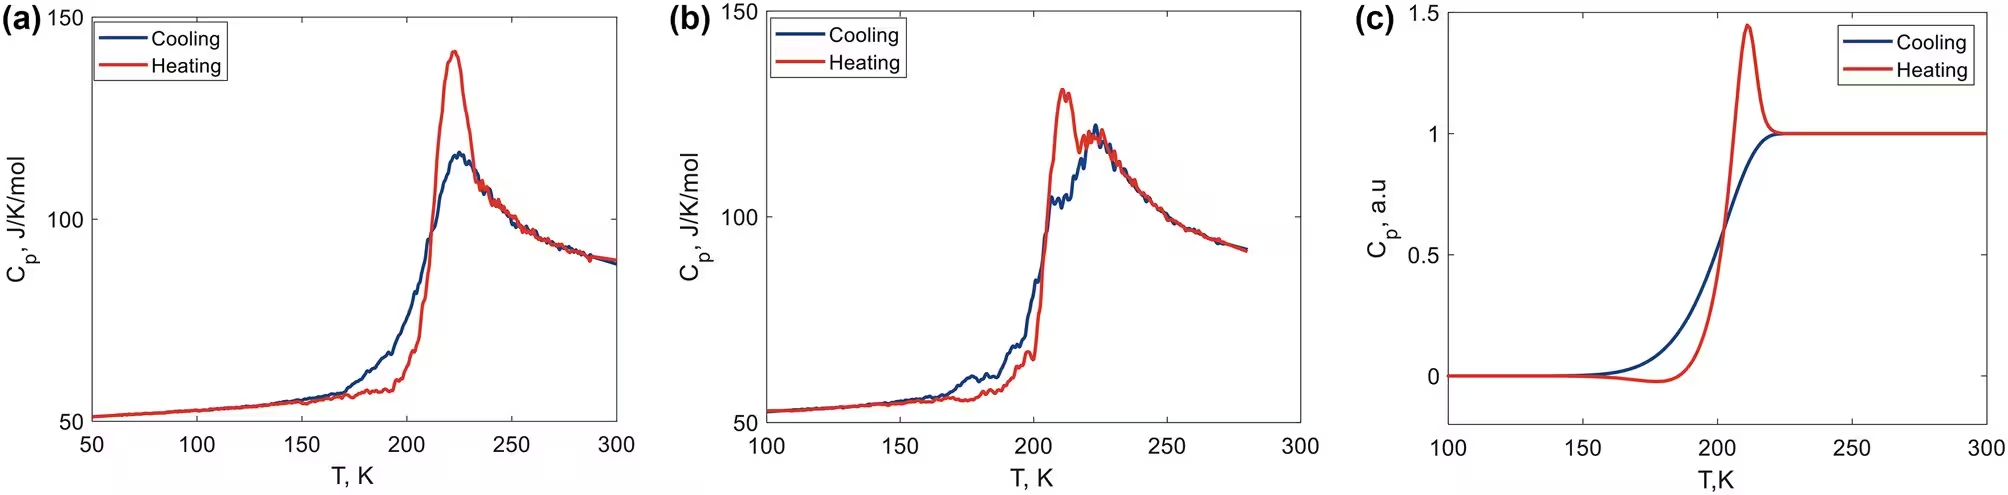
Fig. 2: Heat capacity of water calculated in MD simulations with scan rate 1000 K/µs (a). Heat capacity calculated in MD simulations with scan rate 100 K/µs (b). The relative heat capacity generated with TNM model using \documentclass[12pt]{minimal} \usepackage{amsmath} \usepackage{wasysym} \usepackage{amsfonts} \usepackage{amssymb} \usepackage{amsbsy} \usepackage{mathrsfs} \usepackage{upgreek} \setlength{\oddsidemargin}{-69pt} \begin{document}$$\:{E}_{a}$$\end{document}=86 kJ/mol, nonexponentiality and non-linearity parameters of 0.68 and 0.5 respectively (c).
Heat capacity of water calculated in MD simulations with scan rate 1000 K/µs (a). Heat capacity calculated in MD simulations with scan rate 100 K/µs (b). The relative heat capacity generated with TNM model using \documentclass[12pt]{minimal} \usepackage{amsmath} \usepackage{wasysym} \usepackage{amsfonts} \usepackage{amssymb} \usepackage{amsbsy} \usepackage{mathrsfs} \usepackage{upgreek} \setlength{\oddsidemargin}{-69pt} \begin{document}$$\:{E}_{a}$$\end{document}=86 kJ/mol, nonexponentiality and non-linearity parameters of 0.68 and 0.5 respectively (c). Credit: Kocherbitov et al. / Scientific Reports

At higher temperatures in the high-density liquid state, viscosity follows a low-temperature process with an activation energy of roughly 20.7 kilojoules per mole, which aligns closely with the energy of a single hydrogen bond. This regime is governed by the structural switching mechanism where hydrogen bond donors transition from overcoordinated to undercoordinated oxygen atoms.

At lower temperatures, a second process takes over with an activation energy of 85.6 kilojoules per mole, about four times higher than the first. The viscosity across the entire liquid range can be accurately modeled as the sum of these two parallel contributions. As water cools, structural analysis shows a steady depletion of both overcoordinated and undercoordinated oxygen atoms, effectively shutting down the high-temperature relaxation pathway and forcing the system into cooperative, high-activation-energy rearrangements.

Separating Thermodynamics From Glassy Arrest

A major challenge in water science has been reconciling simulated glass transition temperatures with laboratory measurements. Laboratory differential scanning calorimetry typically uses slow scan rates around 10 Kelvin per minute, which shifts observed glass transition temperatures down by dozens of degrees compared to ultrafast computer simulations.
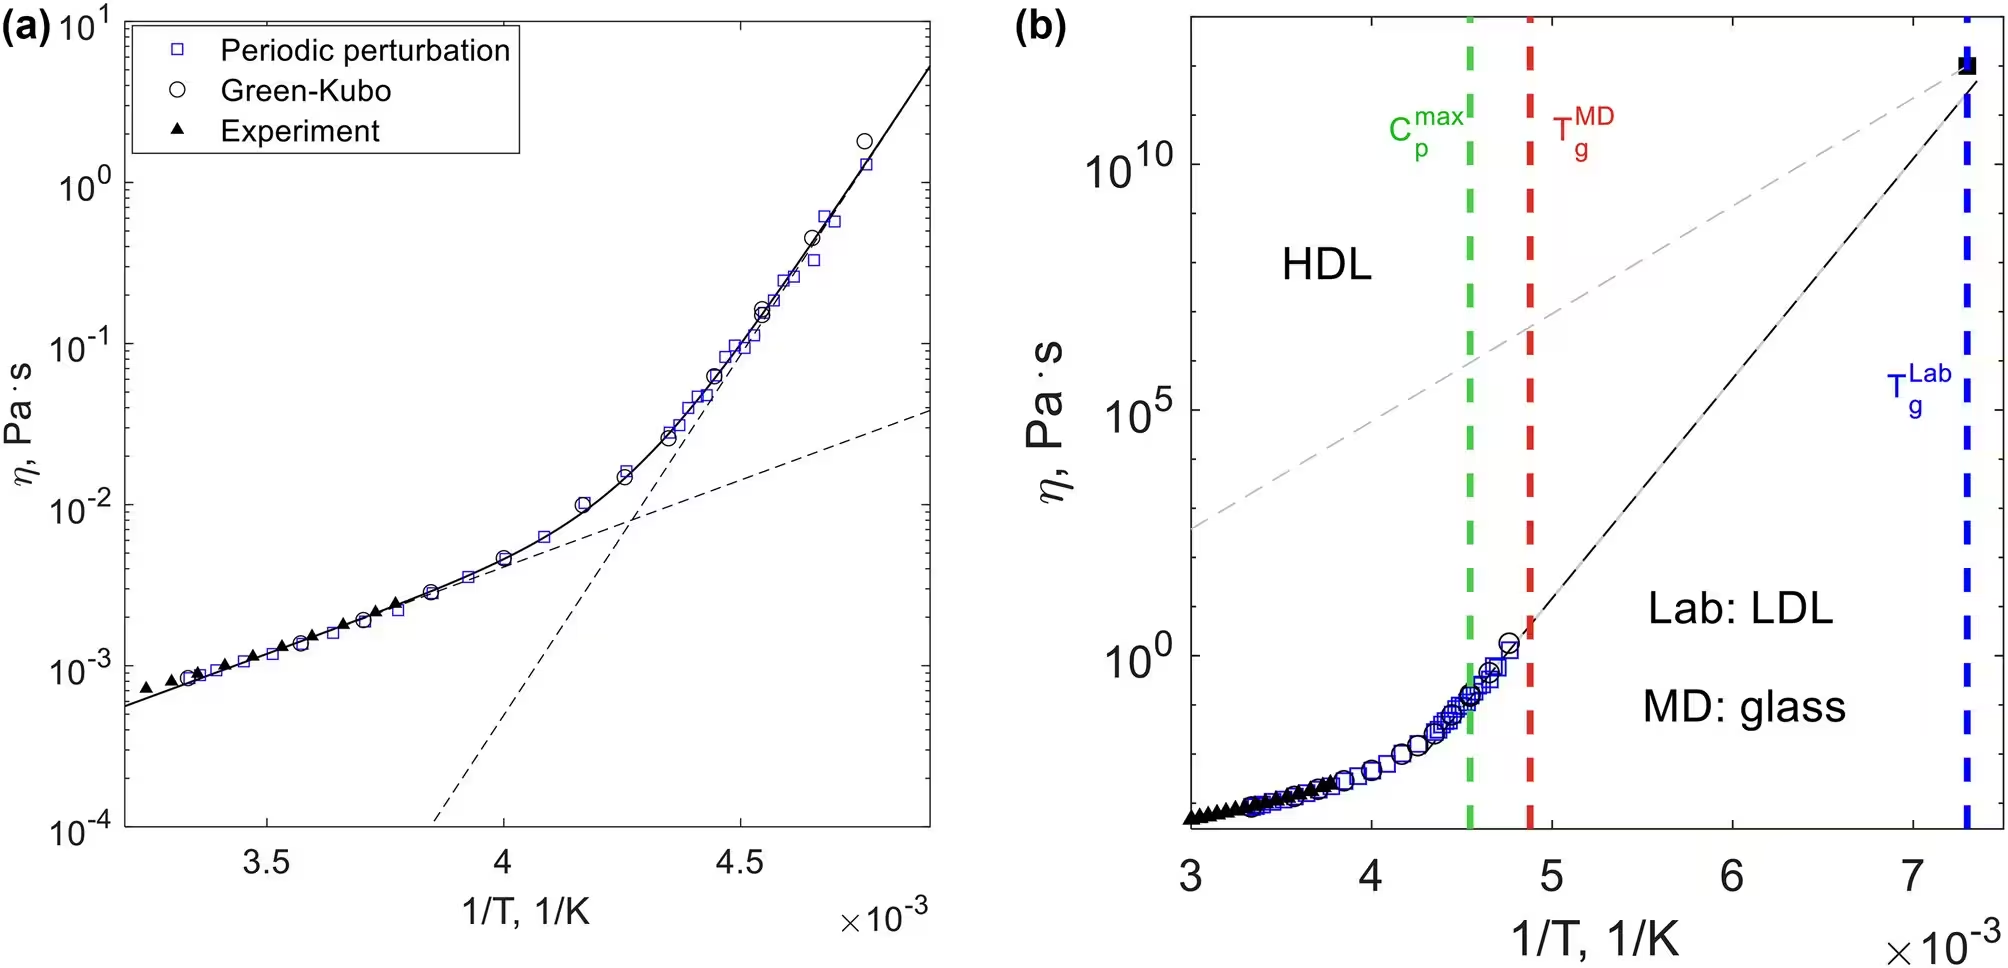
Fig. 3: Viscosity of water as a function of temperature. Blue squares and black circles: MD data (this work), solid curve show the two-processes model, while the dashed lines show individual contributions from LEP and HEP processes (a). The MD simulations data and the literature experimental data from Kestin et al.45 (black triangles) in a broader temperature range context. The black square and blue dashed line show the “laboratory scale” \documentclass[12pt]{minimal} \usepackage{amsmath} \usepackage{wasysym} \usepackage{amsfonts} \usepackage{amssymb} \usepackage{amsbsy} \usepackage{mathrsfs} \usepackage{upgreek} \setlength{\oddsidemargin}{-69pt} \begin{document}$$\:{T}_{\text{g}}$$\end{document}, while red dashed line shows MD simulations \documentclass[12pt]{minimal} \usepackage{amsmath} \usepackage{wasysym} \usepackage{amsfonts} \usepackage{amssymb} \usepackage{amsbsy} \usepackage{mathrsfs} \usepackage{upgreek} \setlength{\oddsidemargin}{-69pt} \begin{document}$$\:{T}_{\text{g}}$$\end{docum
Viscosity of water as a function of temperature. Blue squares and black circles: MD data (this work), solid curve show the two-processes model, while the dashed lines show individual contributions from LEP and HEP processes (a). The MD simulations data and the literature experimental data from Kestin et al.45 (black triangles) in a broader temperature range context. The black square and blue dashed line show the “laboratory scale” \documentclass[12pt]{minimal} \usepackage{amsmath} \usepackage{wasysym} \usepackage{amsfonts} \usepackage{amssymb} \usepackage{amsbsy} \usepackage{mathrsfs} \usepackage{upgreek} \setlength{\oddsidemargin}{-69pt} \begin{document}$$\:{T}_{\text{g}}$$\end{document}, while red dashed line shows MD simulations \documentclass[12pt]{minimal} \usepackage{amsmath} \usepackage{wasysym} \usepackage{amsfonts} \usepackage{amssymb} \usepackage{amsbsy} \usepackage{mathrsfs} \usepackage{upgreek} \setlength{\oddsidemargin}{-69pt} \begin{document}$$\:{T}_{\text{g}}$$\end{docum Credit: Kocherbitov et al. / Scientific Reports

To bridge this gap, the author implemented a combined structural evolution and glass transition model. This framework successfully separates the thermodynamic heat-capacity peak associated with the high-to-low density liquid transition from the dynamic heat-capacity overshoot caused by enthalpy recovery during glass softening.

When extrapolated to standard laboratory time scales of 10 Kelvin per minute, the model predicts a glass transition onset temperature of 136 Kelvin. This matches the widely accepted experimental value historically measured for amorphous solid water. The findings confirm that the prominent heat capacity anomalies seen in fast simulations stem from an intricate interplay between equilibrium structural evolution and timescale-dependent kinetic freezing, rather than a distinct phase change.

The research was published in Scientific Reports on November 6, 2026.

Fact Checked

This article has been fact checked for accuracy, with information verified against reputable sources. Learn more about us and our editorial process.

Last reviewed on .

Article history

  • Latest version

Reference(s)

  1. Kocherbitov, Vitaly. “Coupling between structural evolution and glass transition in supercooled water.” Scientific Reports, vol. 16, no. 1, November 6, 2026 Springer Science and Business Media LLC, doi: 10.1038/s41598-026-79646-0. <https://doi.org/10.1038/s41598-026-79646-0>.

Cite this page:

Siddiqui, Farah. “Supercooled Water Simulations Reveal the Hidden Physics of Glassy Arrest.” BioScience. BioScience ISSN 2521-5760, 06 November 2026. <https://www.bioscience.com.pk/en/subject/physics/coupling-between-structural-evolution-and-glass-transition-in-supercooled-water>. Siddiqui, F. (2026, November 06). “Supercooled Water Simulations Reveal the Hidden Physics of Glassy Arrest.” BioScience. ISSN 2521-5760. Retrieved November 06, 2026 from https://www.bioscience.com.pk/en/subject/physics/coupling-between-structural-evolution-and-glass-transition-in-supercooled-water Siddiqui, Farah. “Supercooled Water Simulations Reveal the Hidden Physics of Glassy Arrest.” BioScience. ISSN 2521-5760. https://www.bioscience.com.pk/en/subject/physics/coupling-between-structural-evolution-and-glass-transition-in-supercooled-water (accessed November 06, 2026).
End of the article