Brain Recordings Reveal Why Compulsive Drinkers Lose Behavioral Control
Health

Brain Recordings Reveal Why Compulsive Drinkers Lose Behavioral Control

A new study using rodent models links persistent alcohol-seeking under aversive conditions to a breakdown in internal brain state alignment.
By Sana Malik
Published:
Email this Article
Brain Recordings Reveal Why Compulsive Drinkers Lose Behavioral Control
Photo by Shawn Day on Unsplash

Brain scans and electrical recordings from rats reveal why some individuals continue drinking alcohol despite negative consequences, pointing to a breakdown in how internal neural states align with outward behavior. In a new study, researchers investigated the neural mechanisms underlying compulsive drinking by recording brain activity in the anterior cingulate cortex, a region of the brain responsible for decision-making and cognitive control. The findings suggest that compulsive alcohol use is tied to a failure in generating stable internal brain states that match an animal’s actual behavior.

Alcohol use disorder is a chronic condition characterized by compulsive consumption despite adverse outcomes. To understand how the brain loses control over drinking, the research team studied two different strains of rats: alcohol-preferring rats, which readily exhibit aversion-resistant drinking by continuing to consume alcohol even when it is laced with a bitter and unpleasant substance called quinine, and standard Wistar rats, which typically stop drinking when the taste becomes bitter. The study is published in PLOS Biology and details how researchers tracked the electrical activity of populations of neurons across 74 experimental sessions.

Decoding Neural Activity Patterns During Drinking Tasks

During the experiments, the animals were placed in specialized chambers where they could access alcohol during specific trials signaled by lights. The team used advanced mathematical tools, including dynamic functional connectivity analysis, to examine how communication between neurons shifted over time. By looking at sliding windows of electrical activity, the investigators were able to map recurring patterns of co-activity among neurons in the anterior cingulate cortex.
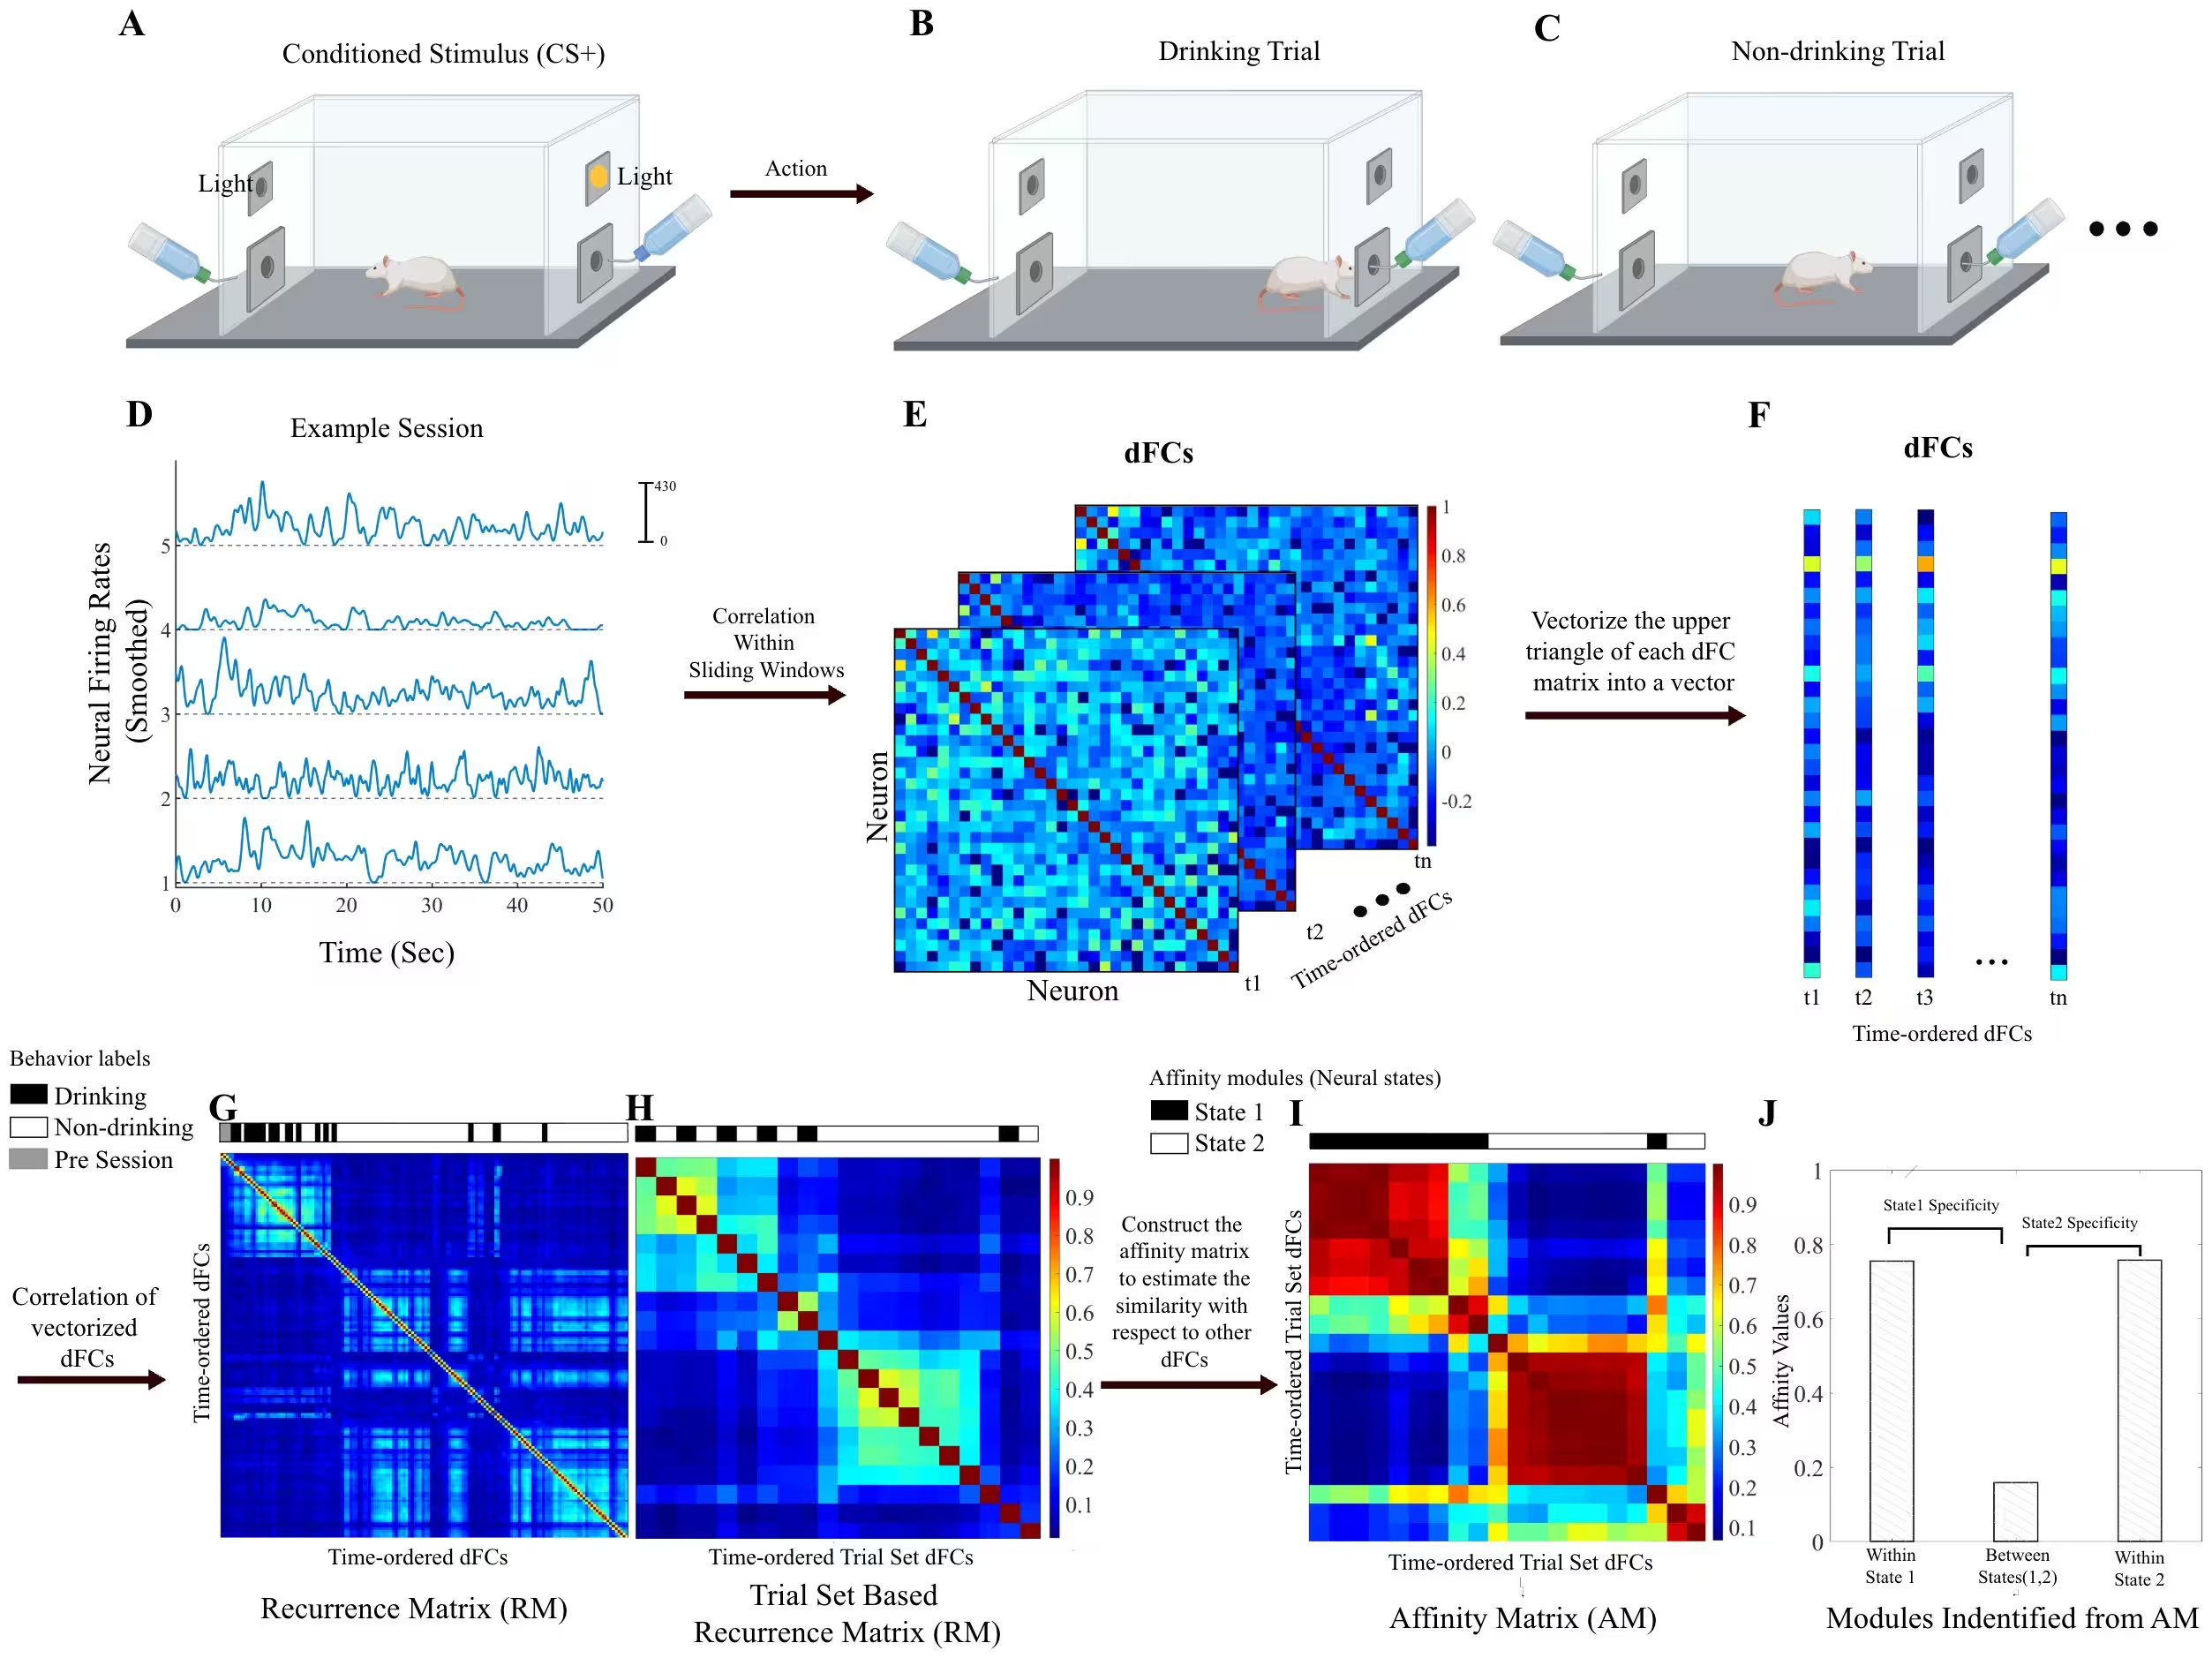
Fig 1: Schematic results from one example session showing the construction of the recurrence matrix (RM) and affinity matrix (AM), and the detection of distinct neural states. (A–C) Cartoon denoting the inter-trial interval where no alcohol is available. Rats perform drinking trials during which neural activity is recorded. Trials are classified as drinking or non-drinking based on behavior. Panel A was created in BioRender. Zhang, Y. (2026) https://BioRender.com/d7bupyy. Panel B was created in BioRender. Zhang, Y. (2026) https://BioRender.com/m4een57. Panel C was created in BioRender. Zhang, Y. (2026) https://BioRender.com/mtfw5ls. (D) Smoothed spike trains recorded from the ACC were converted into firing rates for five example neurons. (E) Dynamic functional connectivity (dFC) matrices are computed using sliding-window correlation between neuronal firing rates. (F) The upper triangle of each dFC matrix is vectorized, with each vector corresponding to a specific time window. (G) A recurrence
Schematic results from one example session showing the construction of the recurrence matrix (RM) and affinity matrix (AM), and the detection of distinct neural states. (A–C) Cartoon denoting the inter-trial interval where no alcohol is available. Rats perform drinking trials during which neural activity is recorded. Trials are classified as drinking or non-drinking based on behavior. Panel A was created in BioRender. Zhang, Y. (2026) https://BioRender.com/d7bupyy. Panel B was created in BioRender. Zhang, Y. (2026) https://BioRender.com/m4een57. Panel C was created in BioRender. Zhang, Y. (2026) https://BioRender.com/mtfw5ls. (D) Smoothed spike trains recorded from the ACC were converted into firing rates for five example neurons. (E) Dynamic functional connectivity (dFC) matrices are computed using sliding-window correlation between neuronal firing rates. (F) The upper triangle of each dFC matrix is vectorized, with each vector corresponding to a specific time window. (G) A recurrence Credit: Yujing Zhang et al. / PLOS Biology

To capture the internal motivation to drink, which does not always match every single moment spent at a drinking port, the authors developed a novel seeking-intensity model using a dual-gamma mathematical function. This model estimated how an animal’s underlying drive to seek alcohol accumulated and faded across trials, accounting for factors like immediate pre-drink motivation and post-drink satiation. The resulting internal seeking states were then compared directly against the electrical activity patterns recorded from the brain.

Why Compulsive Drinkers Show a Mismatch Between Brain and Behavior

When the researchers analyzed the recurrence and affinity matrices of the neural data, they discovered that brain activity naturally clustered into distinct states corresponding to seeking and non-seeking periods. While both rat strains showed clear alignment between their neural states and drinking behavior during standard alcohol sessions, significant differences emerged when quinine was introduced. Wistar rats maintained strong coordination between their internal neural representations and their outward behavior.

In contrast, alcohol-preferring rats exhibited a striking decoupling between their brain states and their actions when facing bitter alcohol. Even when their physical behavior suggested disengagement or persistence, their internal neural representations failed to reflect stable states of engagement or disengagement. This misalignment points to a fundamental deficit in forming coherent internal representations of goal-directed actions under aversive conditions.
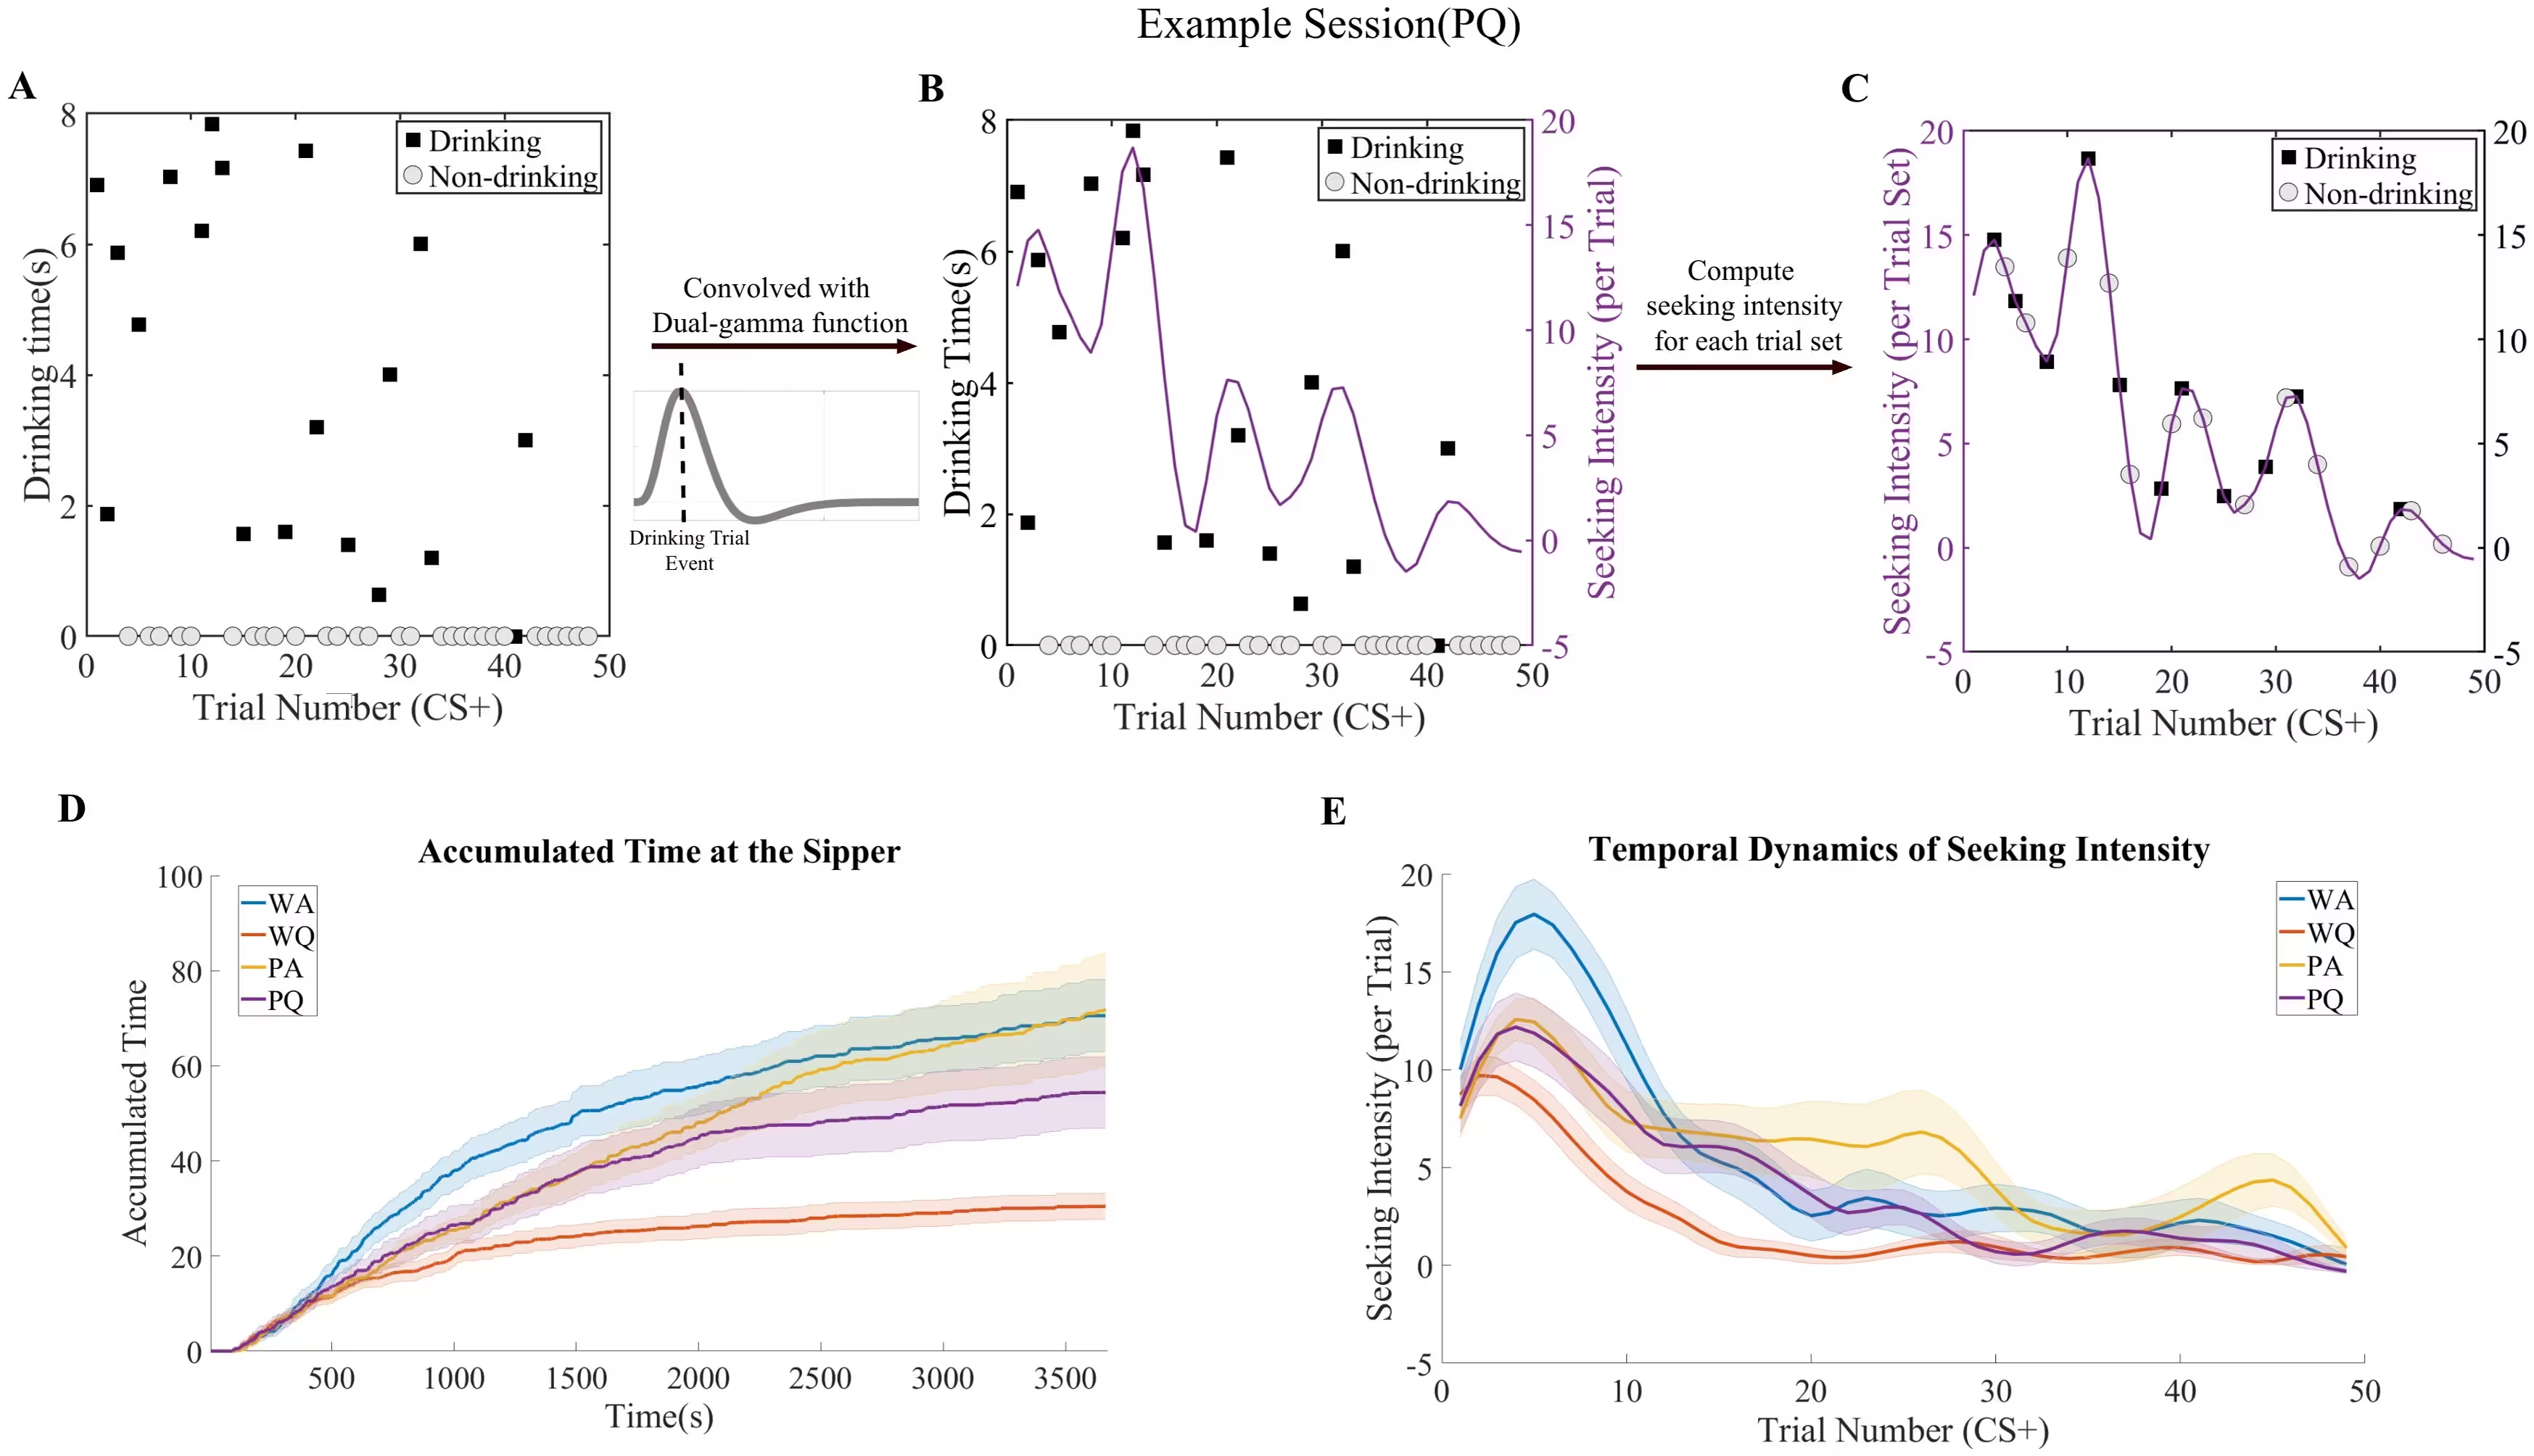
Fig 2: The seeking intensity model captures latent motivational dynamics derived from drinking behavior across CS+ trials. (A) Raw drinking time across trials from an example P rat quinine session, with trials classified as drinking (black squares) or non-drinking (gray circles). (B) Seeking intensity (purple line, right y-axis) was modeled by convolving the drinking time series with a dual-gamma function, capturing the temporal accumulation of drinking-related motivation. (C) To match the trial-set structure used in subsequent neural analyses, the resulting seeking-intensity signal was sampled at the trial-set level and aligned with corresponding behavioral labels. (D) Mean accumulated time at the sipper across trials for the four experimental groups (WA: Wistar + Alcohol; WQ: Wistar + Quinine; PA: P Rat + Alcohol; PQ: P Rat + Quinine), shown with standard error. (E) Mean seeking intensity across trials for the four groups, plotted using trial number as the x-axis.
The seeking intensity model captures latent motivational dynamics derived from drinking behavior across CS+ trials. (A) Raw drinking time across trials from an example P rat quinine session, with trials classified as drinking (black squares) or non-drinking (gray circles). (B) Seeking intensity (purple line, right y-axis) was modeled by convolving the drinking time series with a dual-gamma function, capturing the temporal accumulation of drinking-related motivation. (C) To match the trial-set structure used in subsequent neural analyses, the resulting seeking-intensity signal was sampled at the trial-set level and aligned with corresponding behavioral labels. (D) Mean accumulated time at the sipper across trials for the four experimental groups (WA: Wistar + Alcohol; WQ: Wistar + Quinine; PA: P Rat + Alcohol; PQ: P Rat + Quinine), shown with standard error. (E) Mean seeking intensity across trials for the four groups, plotted using trial number as the x-axis. Credit: Yujing Zhang et al. / PLOS Biology

Limitations and What Comes Next in Addiction Research

The authors note several important limitations to keep in mind. All animals in the study were male, meaning future research will need to examine whether female rodents show similar neural dynamics. Additionally, the recordings focused exclusively on the anterior cingulate cortex, leaving open questions about how other interconnected brain structures, such as the striatum and amygdala, contribute to prefrontal control and compulsive seeking.

Despite these caveats, the framework provides a powerful new way to decode latent brain states in relation to motivated behaviors. By demonstrating that compulsive phenotypes involve a breakdown in brain-behavior alignment, the work opens new avenues for identifying neural biomarkers of addiction vulnerability and potentially designing targeted neuromodulation therapies.

The research was published in PLOS Biology on November 17, 2026.

Fact Checked

This article has been fact checked for accuracy, with information verified against reputable sources. Learn more about us and our editorial process.

Last reviewed on .

Article history

  • Latest version

Reference(s)

  1. Zhang, Yujing., et al. “Dynamic functional connectivity reveals evolving neural activity states of alcohol-seeking in rats.” PLOS Biology, vol. 24, no. 11, November 17, 2026, pp. e3004108 Public Library of Science (PLoS), doi: 10.1371/journal.pbio.3004108. <https://doi.org/10.1371/journal.pbio.3004108>.

Cite this page:

Malik, Sana. “Brain Recordings Reveal Why Compulsive Drinkers Lose Behavioral Control.” BioScience. BioScience ISSN 2521-5760, 17 November 2026. <https://www.bioscience.com.pk/en/subject/health/dynamic-functional-connectivity-reveals-evolving-neural-activity-states-of-alcohol-seeking-in-rats>. Malik, S. (2026, November 17). “Brain Recordings Reveal Why Compulsive Drinkers Lose Behavioral Control.” BioScience. ISSN 2521-5760. Retrieved November 17, 2026 from https://www.bioscience.com.pk/en/subject/health/dynamic-functional-connectivity-reveals-evolving-neural-activity-states-of-alcohol-seeking-in-rats Malik, Sana. “Brain Recordings Reveal Why Compulsive Drinkers Lose Behavioral Control.” BioScience. ISSN 2521-5760. https://www.bioscience.com.pk/en/subject/health/dynamic-functional-connectivity-reveals-evolving-neural-activity-states-of-alcohol-seeking-in-rats (accessed November 17, 2026).
End of the article