New Mapping Technique Reveals Hidden Structure of Weather Fronts
A multi-level analysis method sharpens atmospheric profiles and offers clearer insights into storm dynamics.
Atmospheric researchers have developed a novel technique to map weather boundaries by tracking them across all altitudes rather than a single flat layer. The new method produces sharper meteorological profiles that could improve weather forecasting and climate modeling.
Weather boundaries known as atmospheric fronts separate massive air masses with different temperatures and moisture levels. These dynamic zones trigger extreme precipitation, high winds, and severe storms across the mid-latitudes. Traditional methods for analyzing these weather features typically evaluate data along a single pressure level, usually 700 hectopascals (hPa), because it sits above surface turbulence. However, weather boundaries tilt at an angle and vary wildly in shape. Flattening them to a single layer often blurs important atmospheric signals.
To overcome this limitation, a research team introduced a method that computes vertical cross-section composites by aligning data relative to the actual front position at every height level. The authors report their findings in a study published on the arXiv preprint server. Instead of treating a front as a flat line on a map, the technique constructs continuous three-dimensional surfaces from numerical weather reanalysis data.
How Mapping Every Altitude Changes Weather Views
The research team utilized ERA5 global reanalysis data spanning from 2007 to 2016, focusing on 50 synoptic-scale cold fronts over Central Europe during the warm season. These cold fronts measured at least 1,000 kilometers in length. By avoiding data smoothing techniques commonly used in earlier studies, the researchers preserved raw horizontal gradients in equivalent potential temperature, which measures both heat and moisture content in an air parcel.
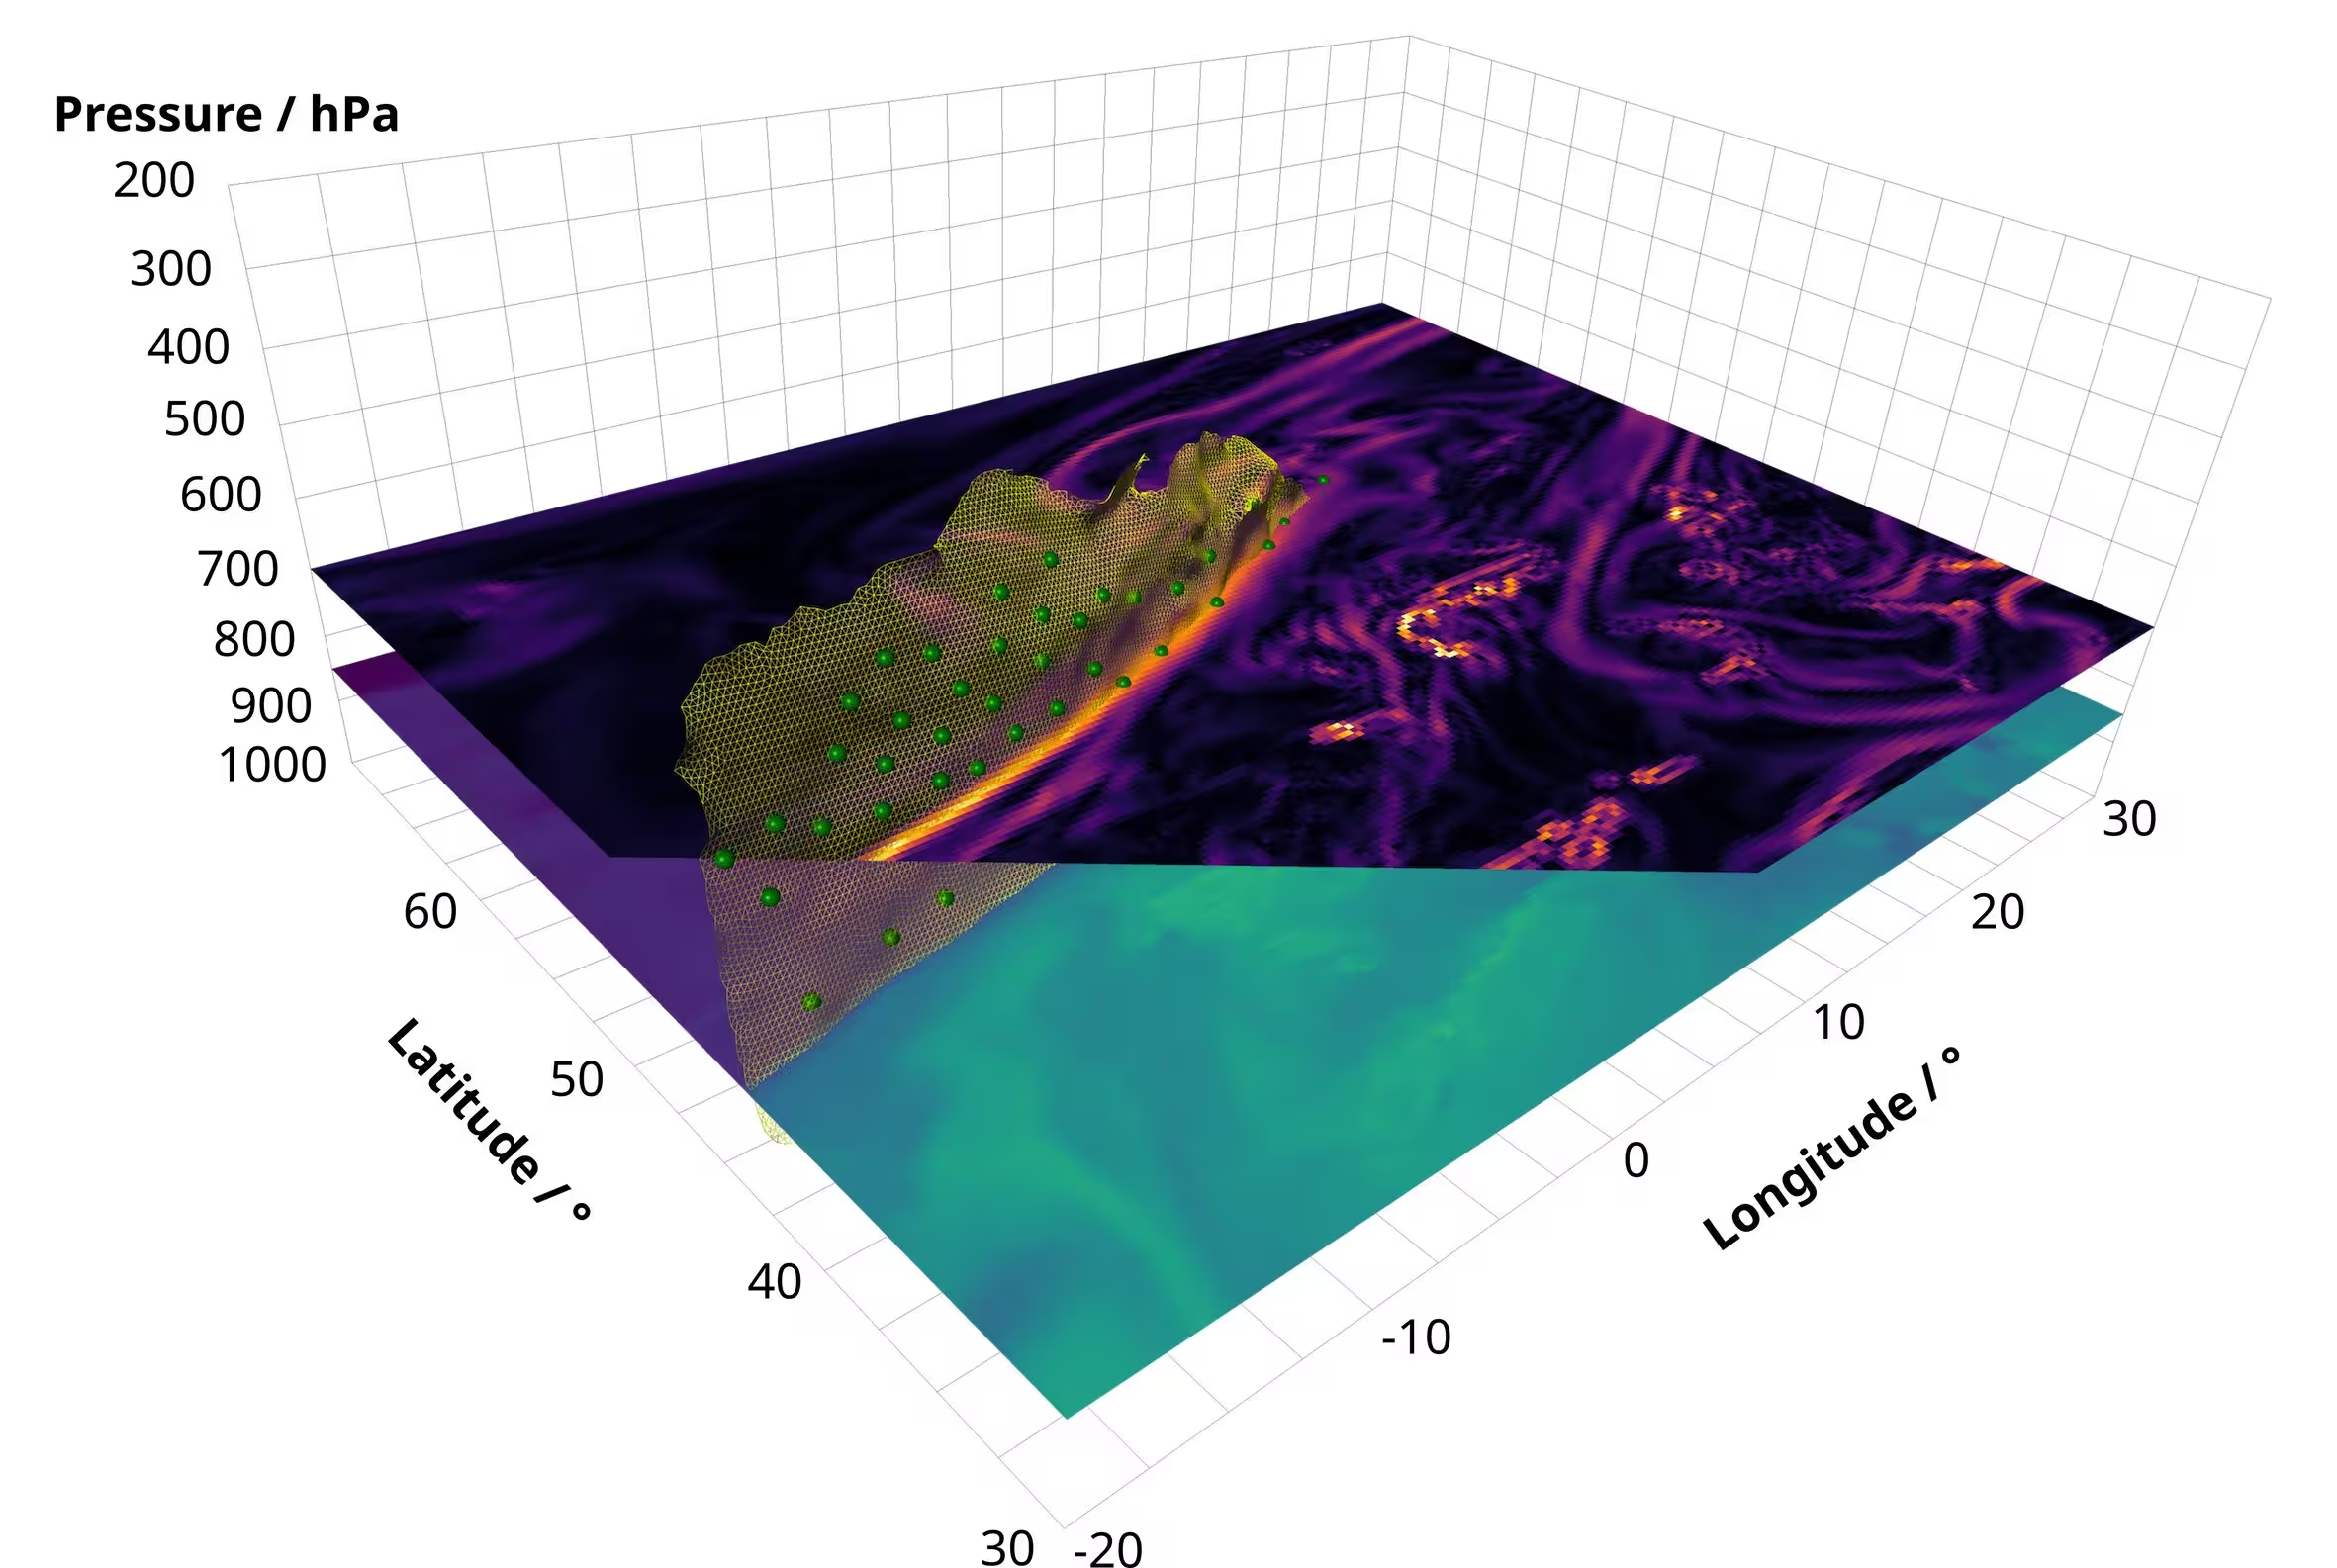
When comparing conventional single-level averaging to the new multi-level alignment, the results showed dramatic improvements in clarity. Traditional methods average values from locations at varying distances from the front due to the natural tilt of the weather boundary. This mismatch causes atmospheric signals to smear out. By contrast, the multi-level approach keeps gradient signals sharp and centered directly on the mean frontal position throughout the vertical column.
Clearer Signs of Upward Motion and Convergence
The advantages of the new approach become even more apparent when analyzing kinematic fields like vertical velocity and wind convergence. Cold fronts typically force warm, moist air upward ahead of the boundary while cooler, dry air sinks behind it. Traditional single-level composites often produce broad, weak signals near the front line because opposing upward and downward motions cancel each other out during averaging.

When evaluated across all pressure levels simultaneously, the vertical velocity fields showed a much cleaner separation between ascending and descending air streams. A distinct maximum in upward motion emerged directly ahead of the front between 700 and 600 hPa. Furthermore, the analysis revealed a low-level minimum in vertical velocity just behind the front at around 900 hPa, which likely marks the signature of dry air streams descending behind the boundary.
Limitations and Next Steps for Automated Mapping
While the study demonstrates a successful proof of concept for cold-frontal dynamics, the authors note several limitations. The current workflow relies heavily on manual intervention to select seed points for extracting the front surfaces, restricting its use to smaller datasets. Fully automating the front extraction process will be necessary before researchers can apply the technique to larger climatological studies.
Additionally, the method requires a front to be detectable across multiple pressure levels to be included in the composite. This requirement introduces a natural bias toward very strong, deep weather systems while excluding shallow boundaries that dissipate near the surface. Expanding the sample size and refining automated seed generation will allow meteorologists to test these multi-level composites across diverse global regions and weather regimes.
The study was posted to the arXiv preprint server on November 18, 2026.
This article has been fact checked for accuracy, with information verified against reputable sources. Learn more about us and our editorial process.
Last reviewed on .
Article history
- Latest version
Reference(s)
- Gossing, Anne. “Vertical Structure-Based Composites for Analyzing Atmospheric Front Environments.” arXiv.org <http://arxiv.org/abs/2611.24260v1>.
Cite this page:
- Posted by Vikram Desai