Pre-Season Soil Drone Scans Reveal Hidden Boost to Soybean Yield Forecasts
Early aerial imaging of bare ground helps machine learning models cut prediction errors by over 50 kilograms per hectare.
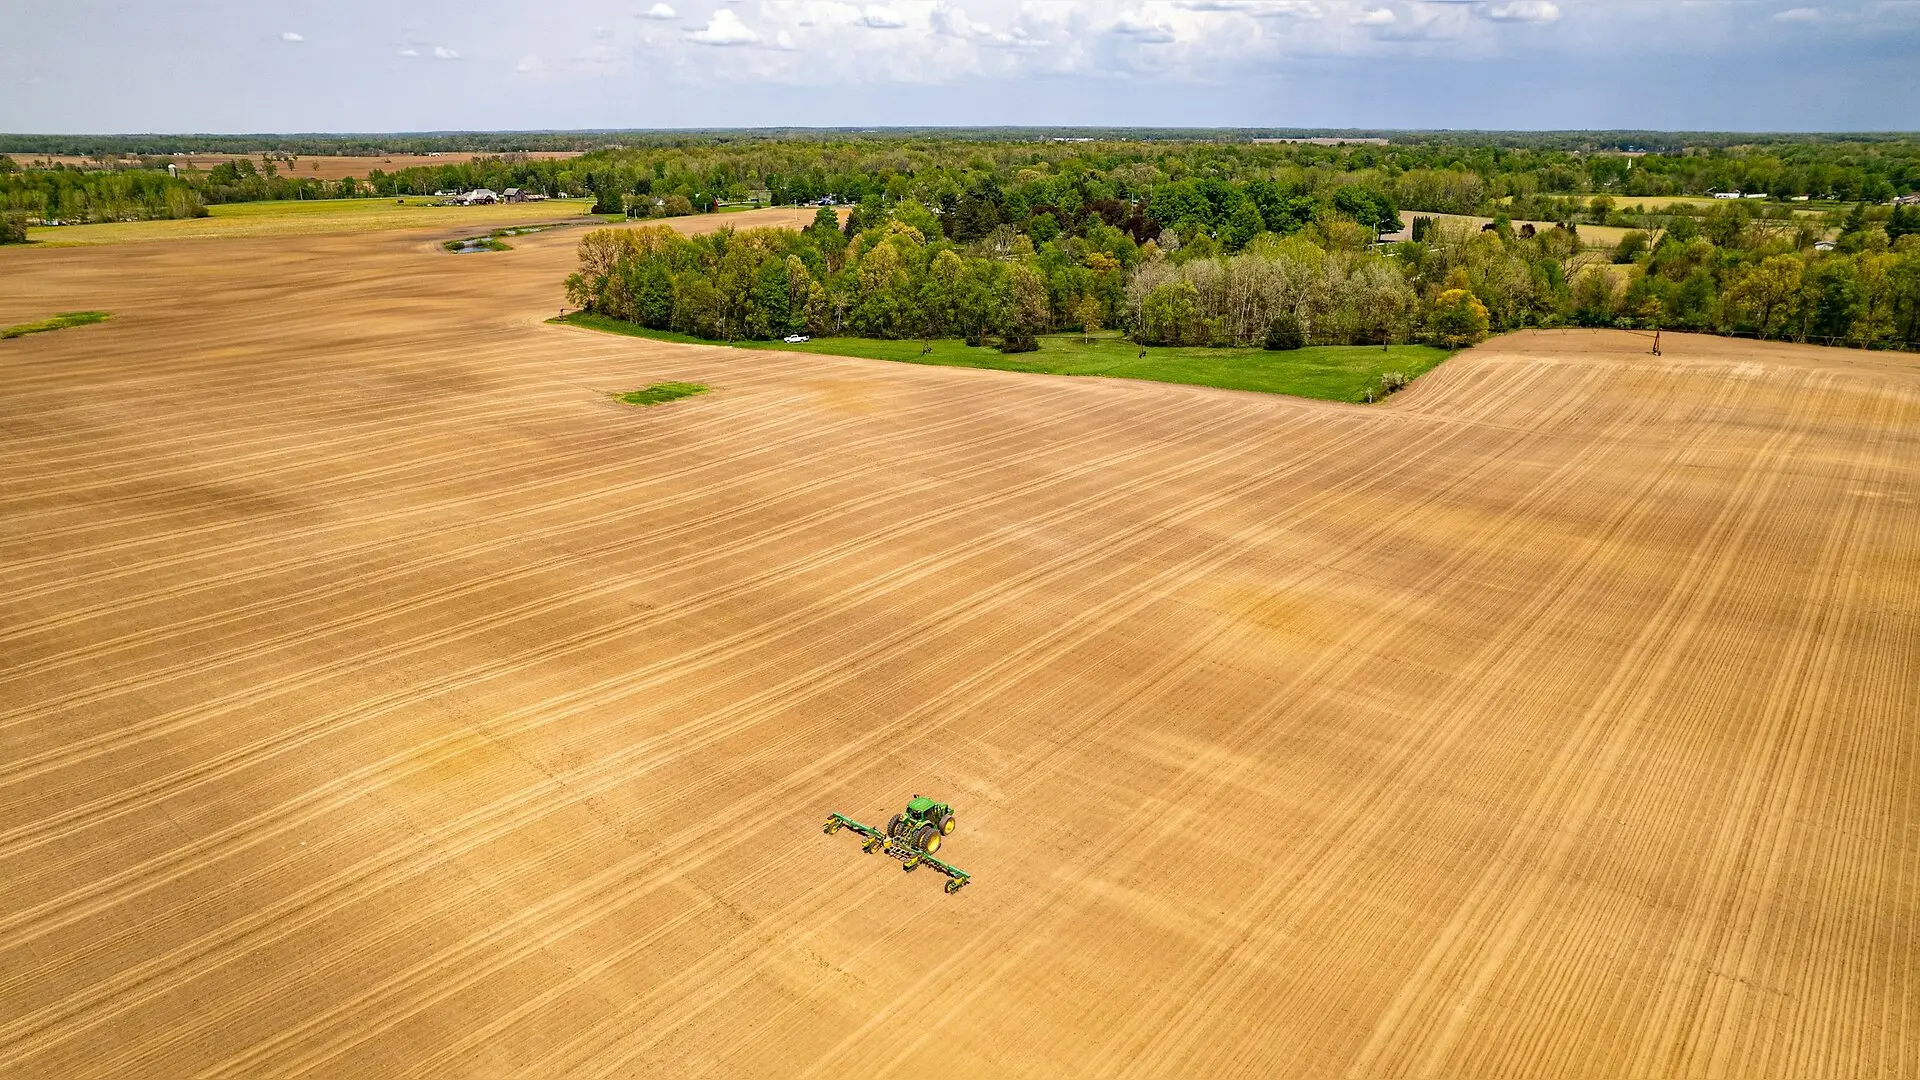
Drone scans taken before the growing season reveal hidden soil details that help improve soybean harvest predictions. Agricultural scientists analyzed 101 sampling locations across four slope units in Northeast China, pairing pre-season bare-soil multispectral imagery with later-season canopy scans. The study, published in iScience, demonstrates that tracking early soil characteristics alongside crop health markers reduces overall yield estimation errors.
Why Early Soil Scans Matter for Field Scans
Estimating crop output before harvest is challenging because standard canopy-only drone imagery often misses underground variations that control plant growth. Soybean plants depend heavily on soil texture, moisture, and local topography throughout the warm summer months. Once the green leaf canopy closes over the rows in late August, standard aerial cameras can no longer view the bare ground below. By capturing multispectral imagery of the exposed soil surface before seeds emerge in the spring, researchers can extract spectral proxies that reflect persistent soil-surface conditions.
The research team evaluated five different random-forest regression scenarios using a strict nested cross-validation design to prevent data leakage. The baseline model relied solely on pod-filling vegetation spectral indices, yielding a mean predictive R-squared value of 0.240 and a mean absolute error of 573.06 kilograms per hectare. When the complete pool of bare-soil proxy indices was added to the canopy indices, the mean predictive R-squared rose to 0.325, and the mean absolute error dropped to 518.76 kilograms per hectare across ten repeated tests.
Understanding the Predictive Signals and Model Limits
Further analysis using Shapley additive explanations, a machine learning interpretation method, showed that canopy indices such as red-edge chlorophyll absorption retained the strongest overall influence on yield predictions. However, bare-soil indices such as the normalized difference multi-band index provided consistent complementary information. Higher values in the bare-soil index generally aligned with negative machine learning contributions, helping the model account for spatial variability that canopy scans alone could not capture.
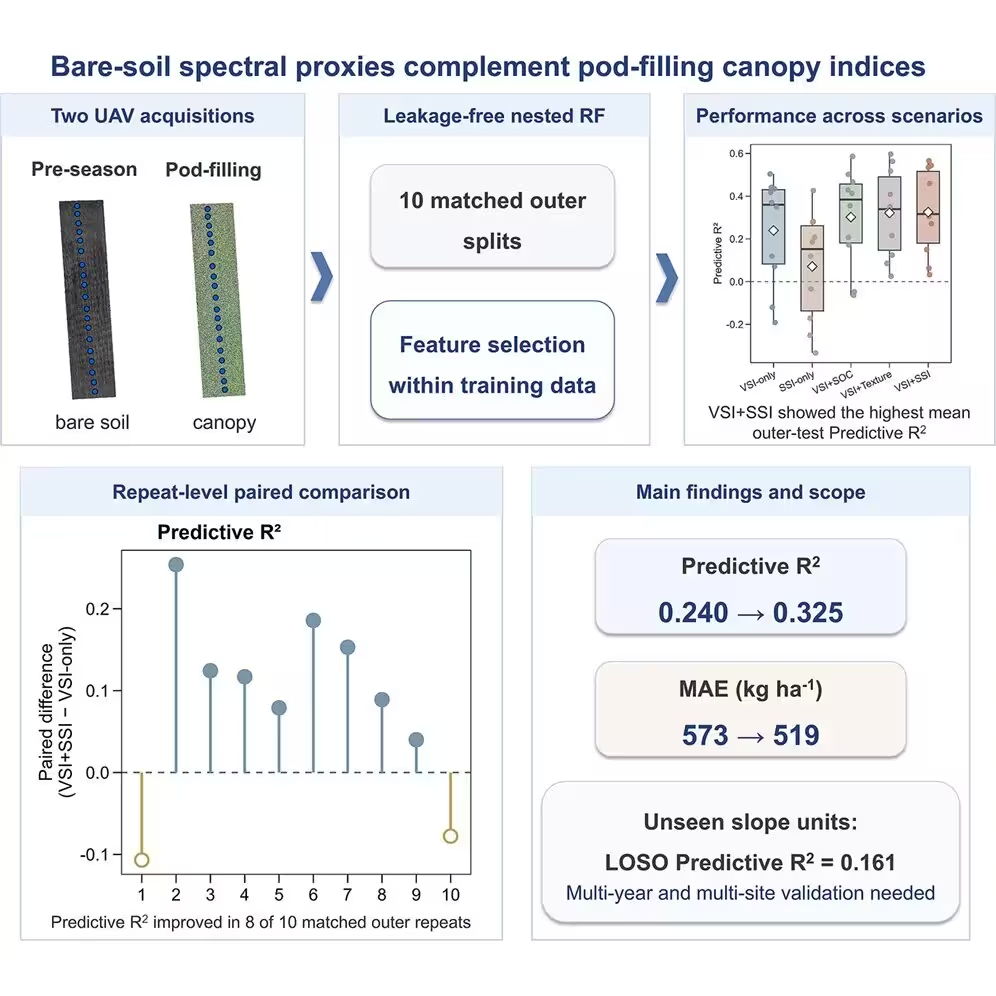
Despite these performance gains, the models exhibited noticeable prediction bias. Across the board, algorithms tended to overpredict low-yield plots and underpredict high-yield plots, pulling extreme values toward the center of the distribution. Furthermore, when tested using a leave-one-slope-unit-out spatial validation approach where entire slope units were completely held out from training, the pooled predictive R-squared declined to 0.161. This drop indicates that spatial transfer remains a major hurdle when applying agricultural models to entirely new geographic locations.
Next Steps for Operational Crop Forecasting
The authors emphasize that this setup operates as a field-scale proof of concept limited to a single growing season and two specific sites in Heilongjiang Province. Because the soil indices serve as spectral proxies rather than direct laboratory measurements of soil organic carbon or particle size, their physical meaning reflects a complex mixture of surface moisture, roughness, and composition. Broader multi-year and multi-site validation across diverse environments will be necessary before such drone workflows can be scaled up for operational regional forecasting.
The research was published in iScience on October 26, 2026.
This article has been fact checked for accuracy, with information verified against reputable sources. Learn more about us and our editorial process.
Last reviewed on .
Article history
- Latest version
Reference(s)
- Zhao, Yan., et al. “Pre-season bare-soil spectral proxies complement pod-filling canopy indices for field-scale soybean-yield prediction from UAV imagery.” iScience, vol. 29, no. 11, November 1, 2026, pp. 118045 Elsevier BV, doi: 10.1016/j.isci.2026.118045. <https://doi.org/10.1016/j.isci.2026.118045>.
Cite this page:
- Posted by Michael Ellison