Lockdown Data Reveals How Quickly Dhaka Air Quality Rebounds
A multi-method analysis of Dhaka air records suggests that pandemic activity restrictions triggered a sharp, temporary drop in pollution that vanished as soon as human mobility returned.

A sudden drop in human activity during the COVID-19 lockdown in Bangladesh triggered an immediate and sharp improvement in air quality at a monitoring station in northern Dhaka, according to research evaluating daily air records from 2016 to 2022. The study analyzed daily observations from the U.S. Embassy Baridhara station alongside national mobility reports and meteorological variables to examine how air pollution responded when movement restrictions took effect.
The research was published in PLOS Climate by authors Maheen Zaman, Md. Jobayer Khan, and Md. Ahnaf Zaman. Because the mobility data were available only at the national level rather than specifically for Dhaka, the authors treated the mobility series as contextual proxies for broad activity changes rather than direct measurements of urban travel within the capital.
Detecting Air Quality Shifts Through Interrupted Time Series
To evaluate whether the lockdown altered pollution levels, the team applied a SARIMAX interrupted time-series model. This statistical approach accounts for the strong serial dependence found in daily environmental data. The pre-lockdown time trend showed a positive and significant upward trajectory for both the Air Quality Index and fine particulate matter, known as PM2.5, confirming that air quality had been gradually worsening before the pandemic restrictions.
When the lockdown began, the models detected a large, negative, and statistically significant immediate level change for both indicators. Air Quality Index dropped by 90.32 units, while PM2.5 fell by 109.99 micrograms per cubic meter. The sharper response in fine particulate matter aligns with the abrupt curtailment of road transport, construction, and industrial activities that typically dominate Dhaka’s particle burden.
Unraveling Weather Effects From Human Activity
Atmospheric conditions strongly influence pollutant concentrations, prompting the researchers to test eight supervised machine learning algorithms to remove meteorological confounding. An artificial neural network achieved the highest predictive performance and was used to normalize the daily data against temperature, relative humidity, precipitation, surface pressure, and wind speed.
The weather-normalized results demonstrated that favorable meteorology explained only a portion of the observed improvement during the 2020 restrictions. The meteorological variables during the lockdown months behaved in both sign and approximate magnitude much like they did in other years, and dispersion conditions were slightly less favorable than the pre-pandemic average. This finding rules out the possibility that a fortuitously clean season drove the cleaner air.
Time Scale Contrasts Between Composite Indices and Particles
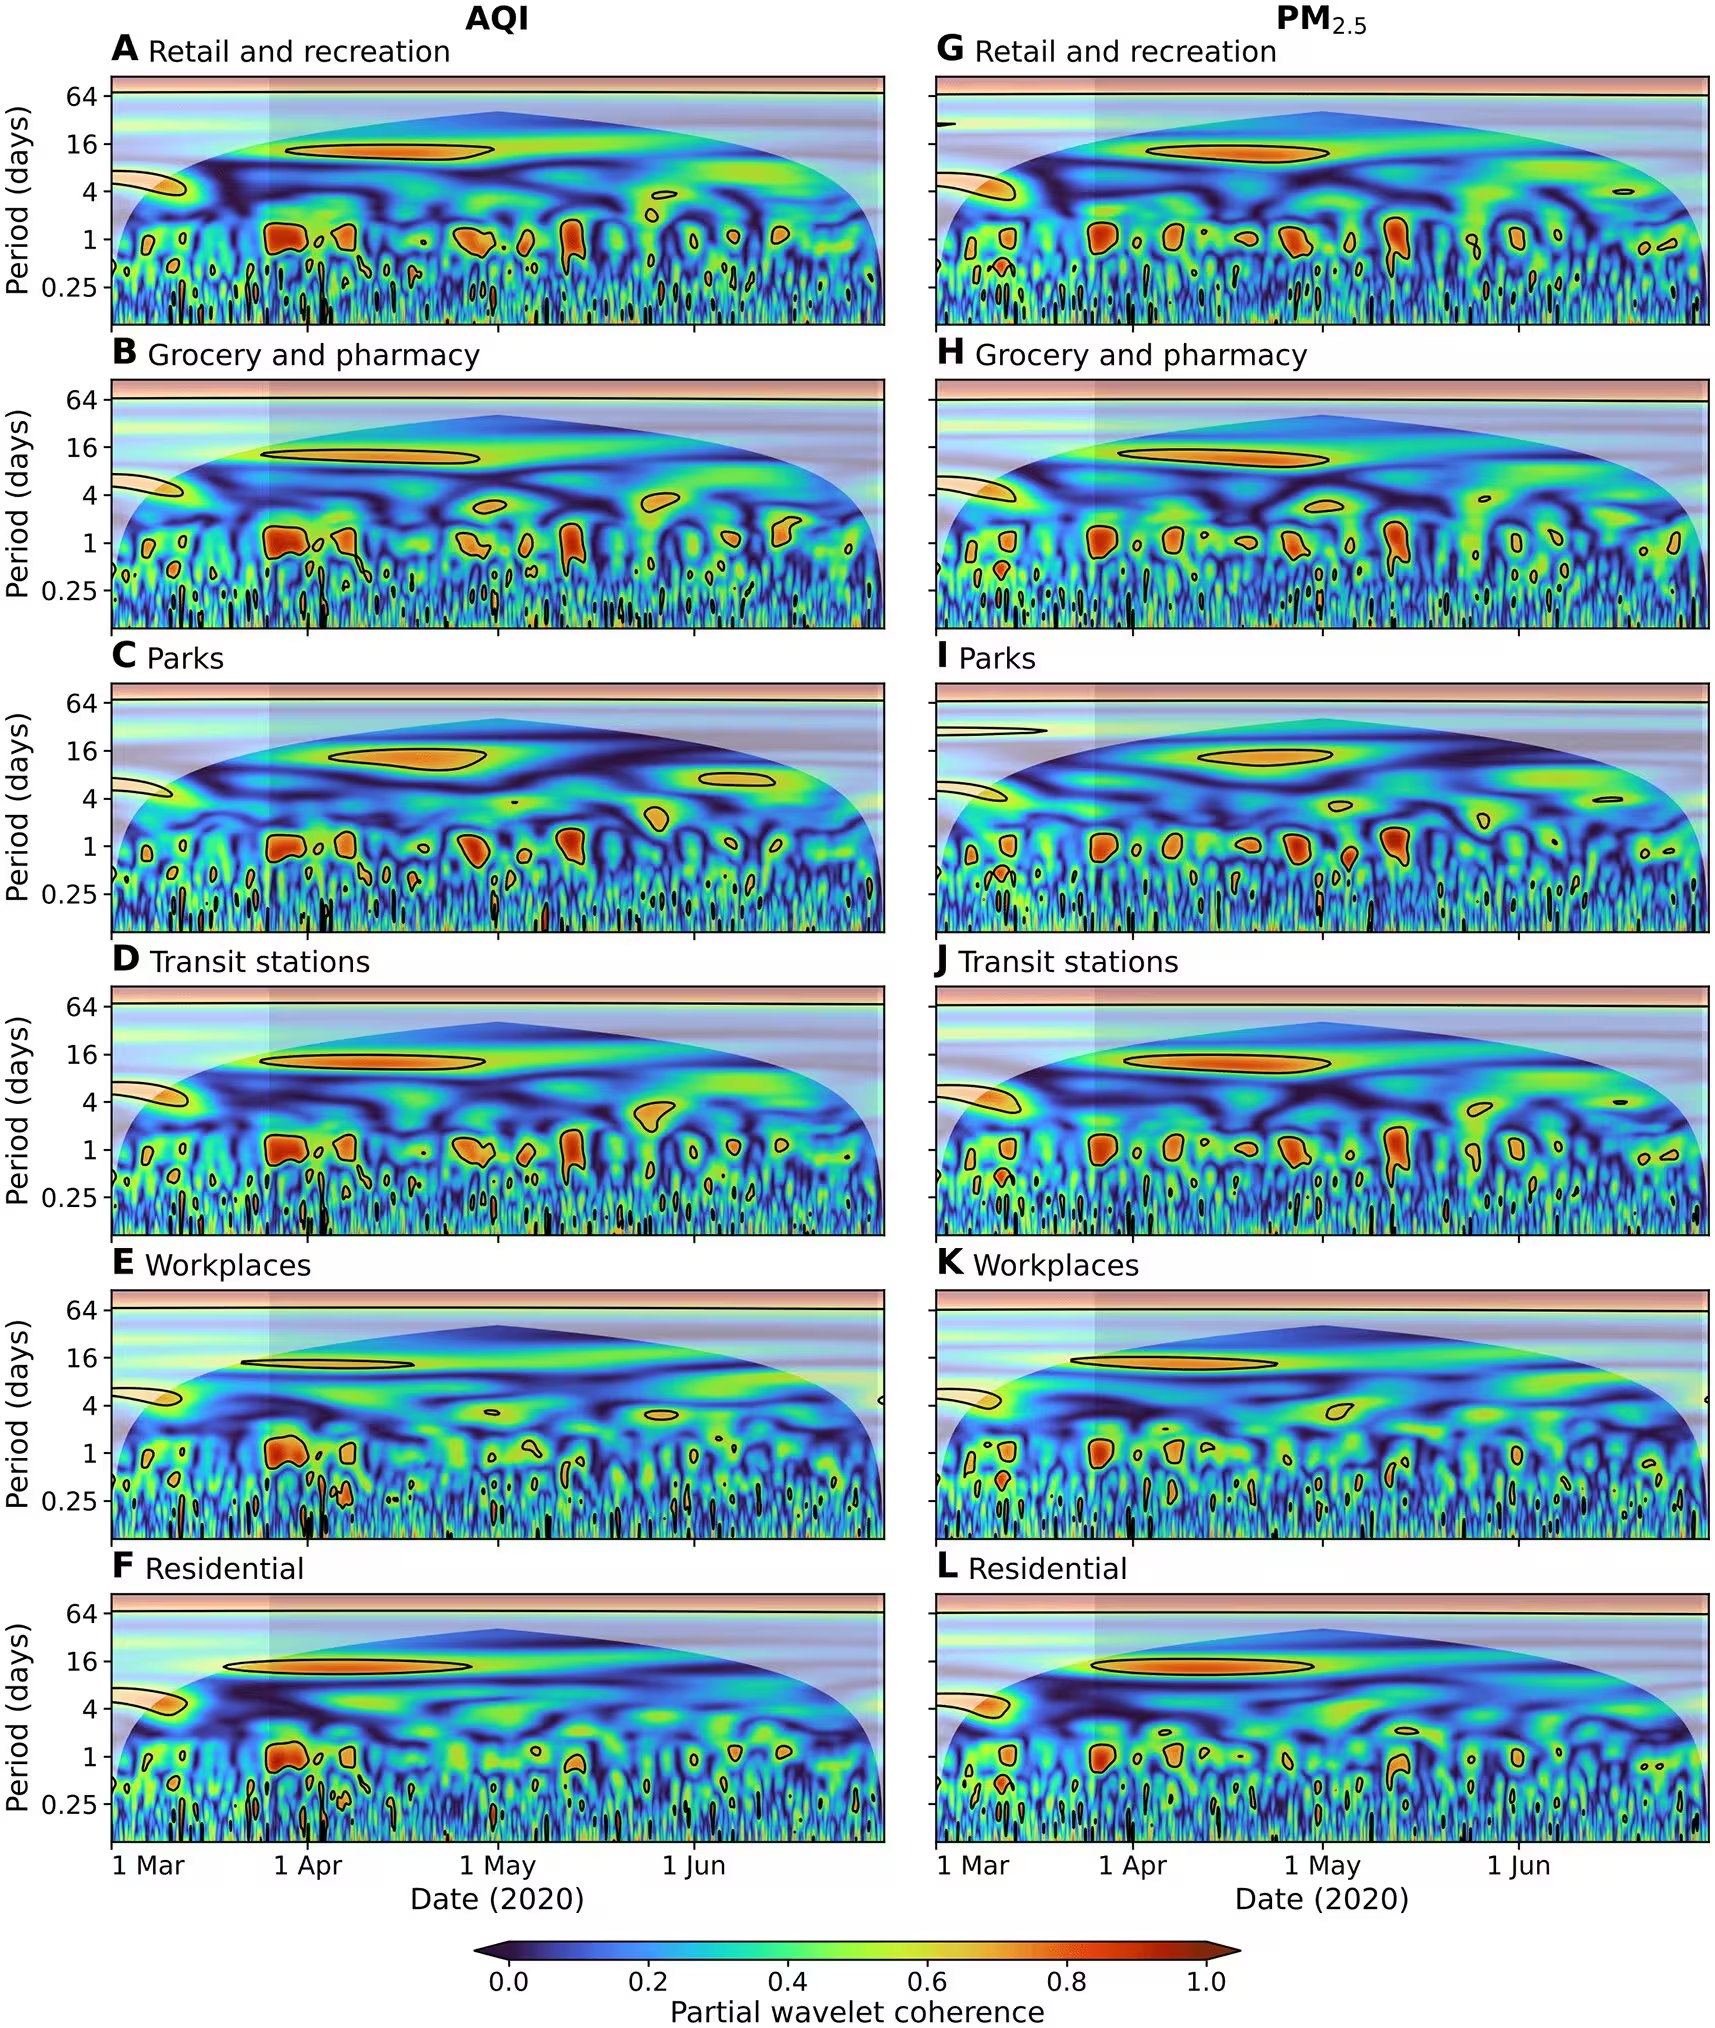
Using partial wavelet coherence after removing the joint influence of weather, the investigators examined associations across different temporal frequencies. The composite Air Quality Index showed strongest coherence with mobility in the 8-to-16-day band, reflecting multi-day behavioral changes. In contrast, PM2.5 peaked in the 2-to-4-day band, matching the rapid atmospheric response of fine particles to local combustion and traffic sources.
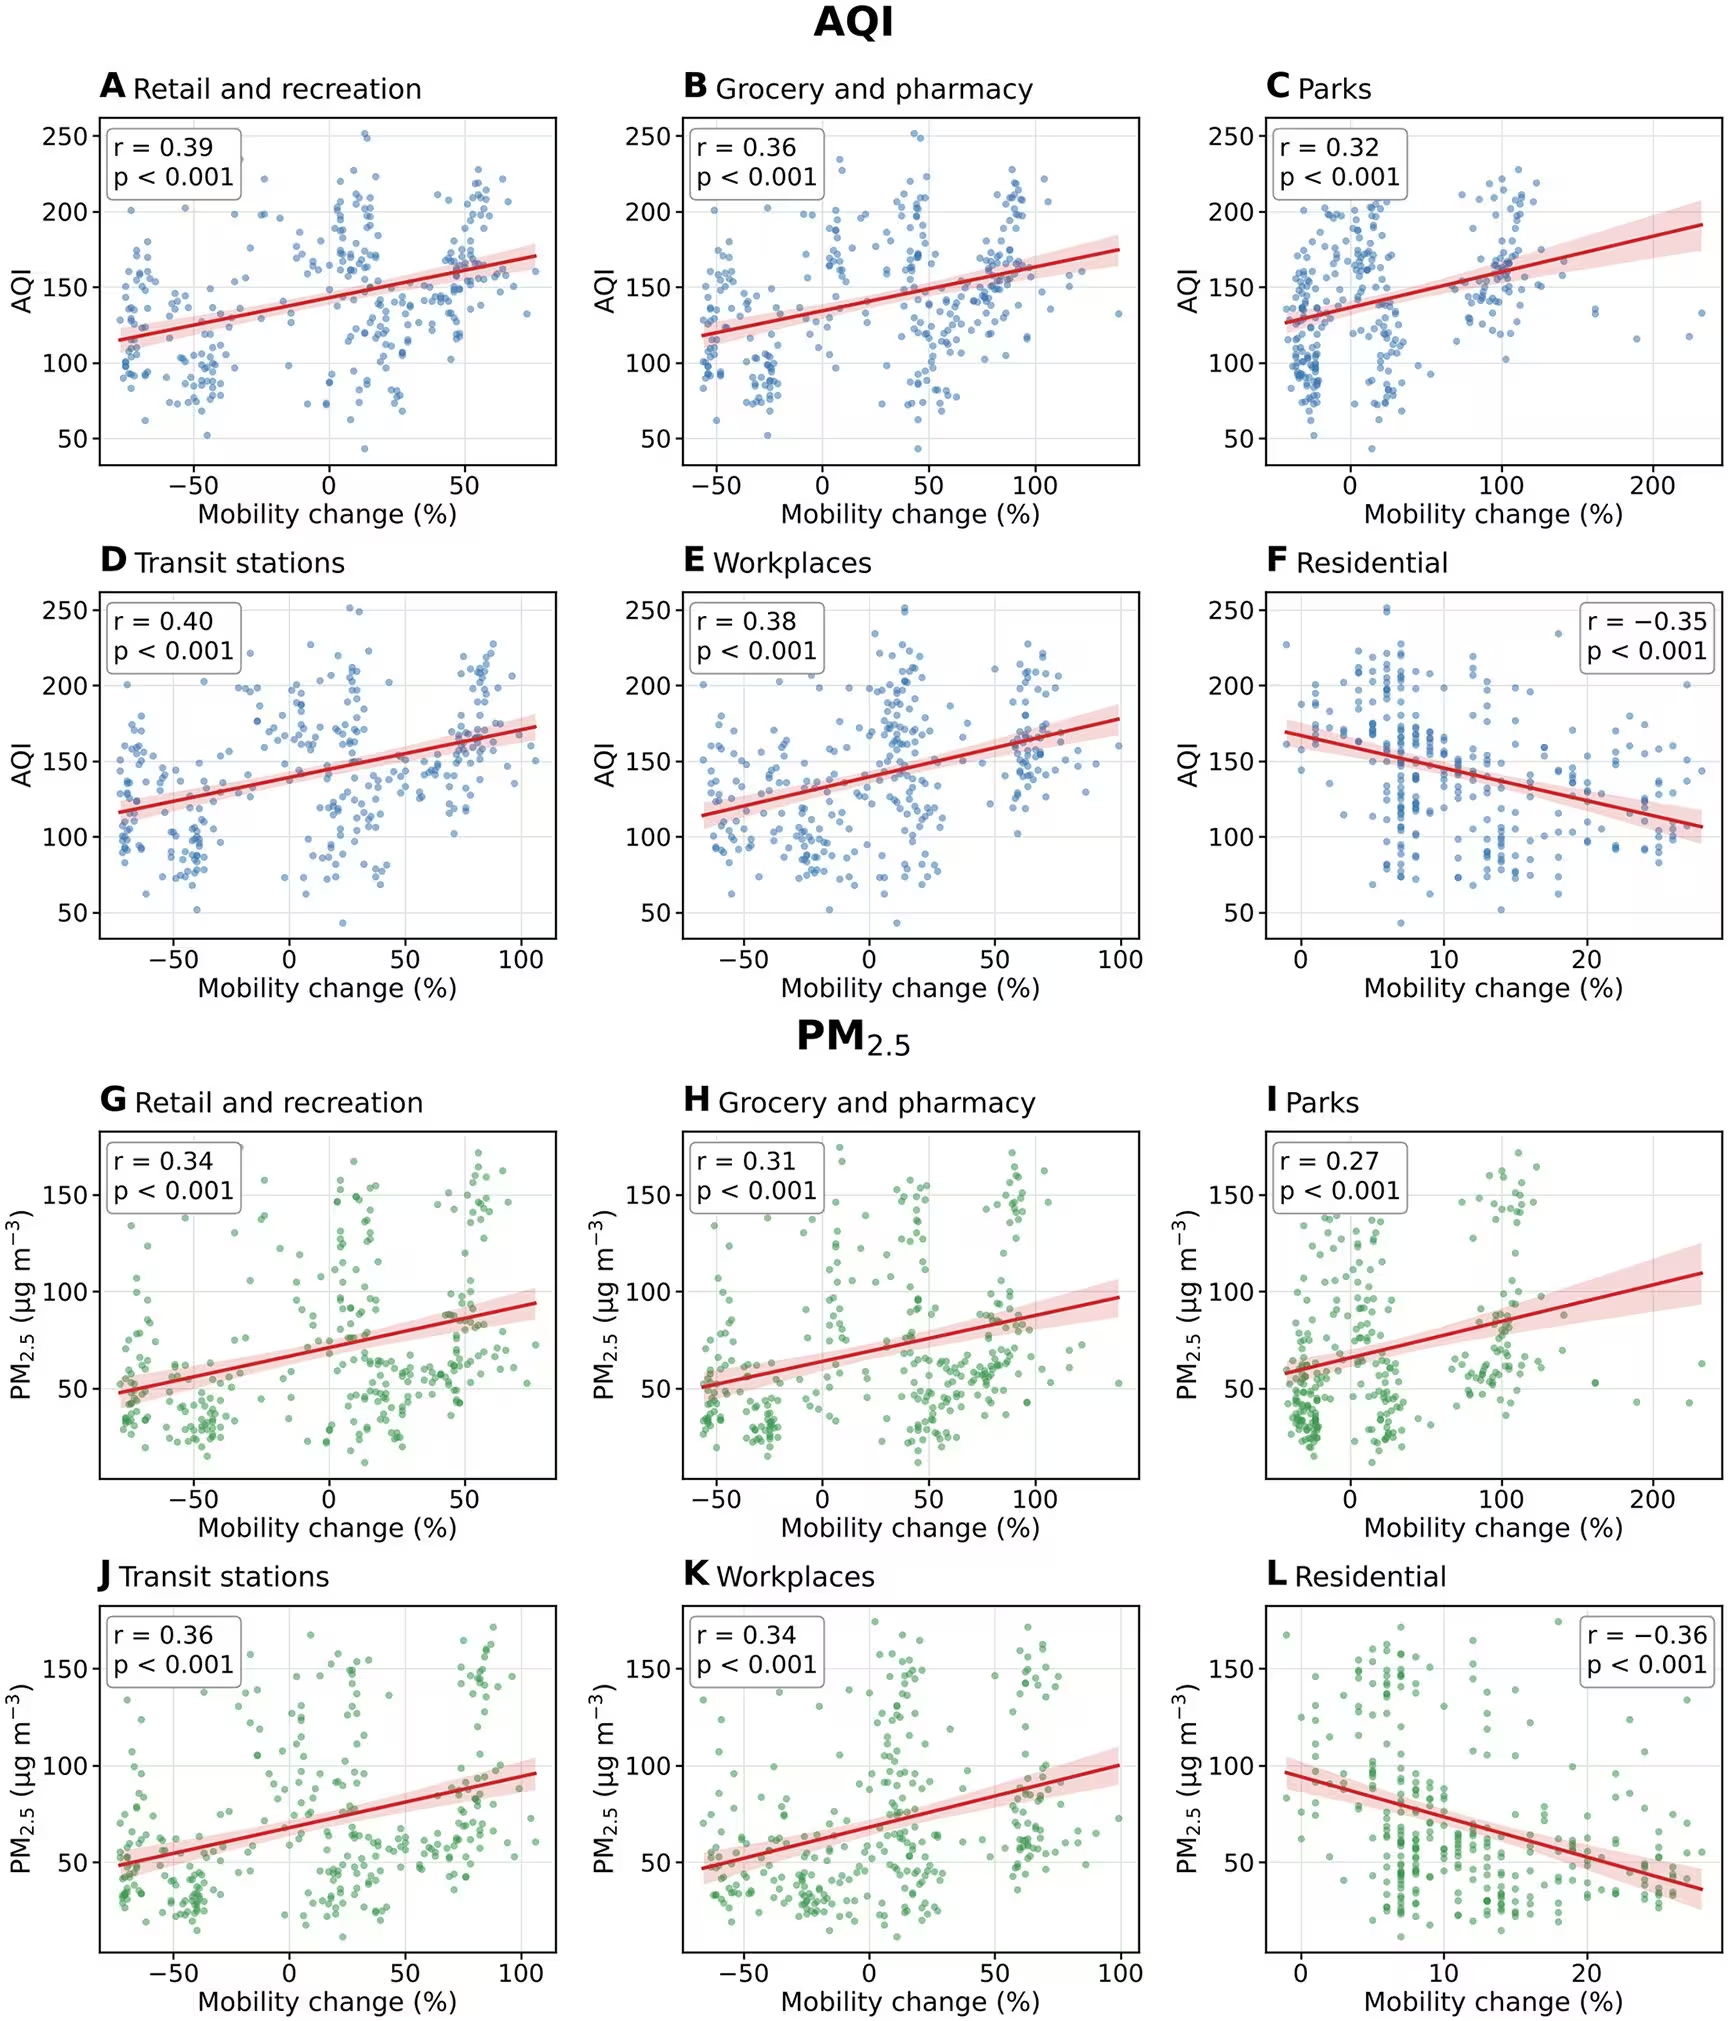
When machine learning models and SHAP feature attribution were applied to the weather-normalized data, residential presence, grocery and pharmacy visits, workplace activity, and transit use emerged as the most influential predictors. Higher residential presence pushed predictions toward lower pollution, whereas increased transit and retail mobility associated with higher pollutant levels.
Lessons for Urban Policy and Future Research
The authors emphasize that the improvement observed during the pandemic was temporary, with concentrations rebounding by 2021 and 2022 as activity returned. While the study did not measure greenhouse gas emissions, the findings indicate that reducing fossil fuel combustion through structural changes in vehicle fleets, cleaner fuels, and improved public transit could yield major air quality co-benefits. The team notes several limitations, including the use of a single monitoring station and a national mobility proxy, highlighting the need for multi-station urban networks and city-specific traffic data in future studies.
The research was published in PLOS Climate on November 20, 2026.
This article has been fact checked for accuracy, with information verified against reputable sources. Learn more about us and our editorial process.
Last reviewed on .
Article history
- Latest version
Reference(s)
- Zaman, Maheen., et al. “Mobility-driven changes in urban air quality during the COVID-19 lockdown: Evidence from the Baridhara monitoring station, Dhaka, Bangladesh.” PLOS Climate, vol. 5, no. 11, November 20, 2026, pp. e0001033 Public Library of Science (PLoS), doi: 10.1371/journal.pclm.0001033. <https://doi.org/10.1371/journal.pclm.0001033>.
Cite this page:
- Posted by Vikram Desai