Hidden Boundary Layer Dynamics Power Massive Tropical Storm Clusters
Advanced atmospheric modeling reveals that large-scale circulation, rather than local turbulent mixing, drives tropical cloud aggregation.
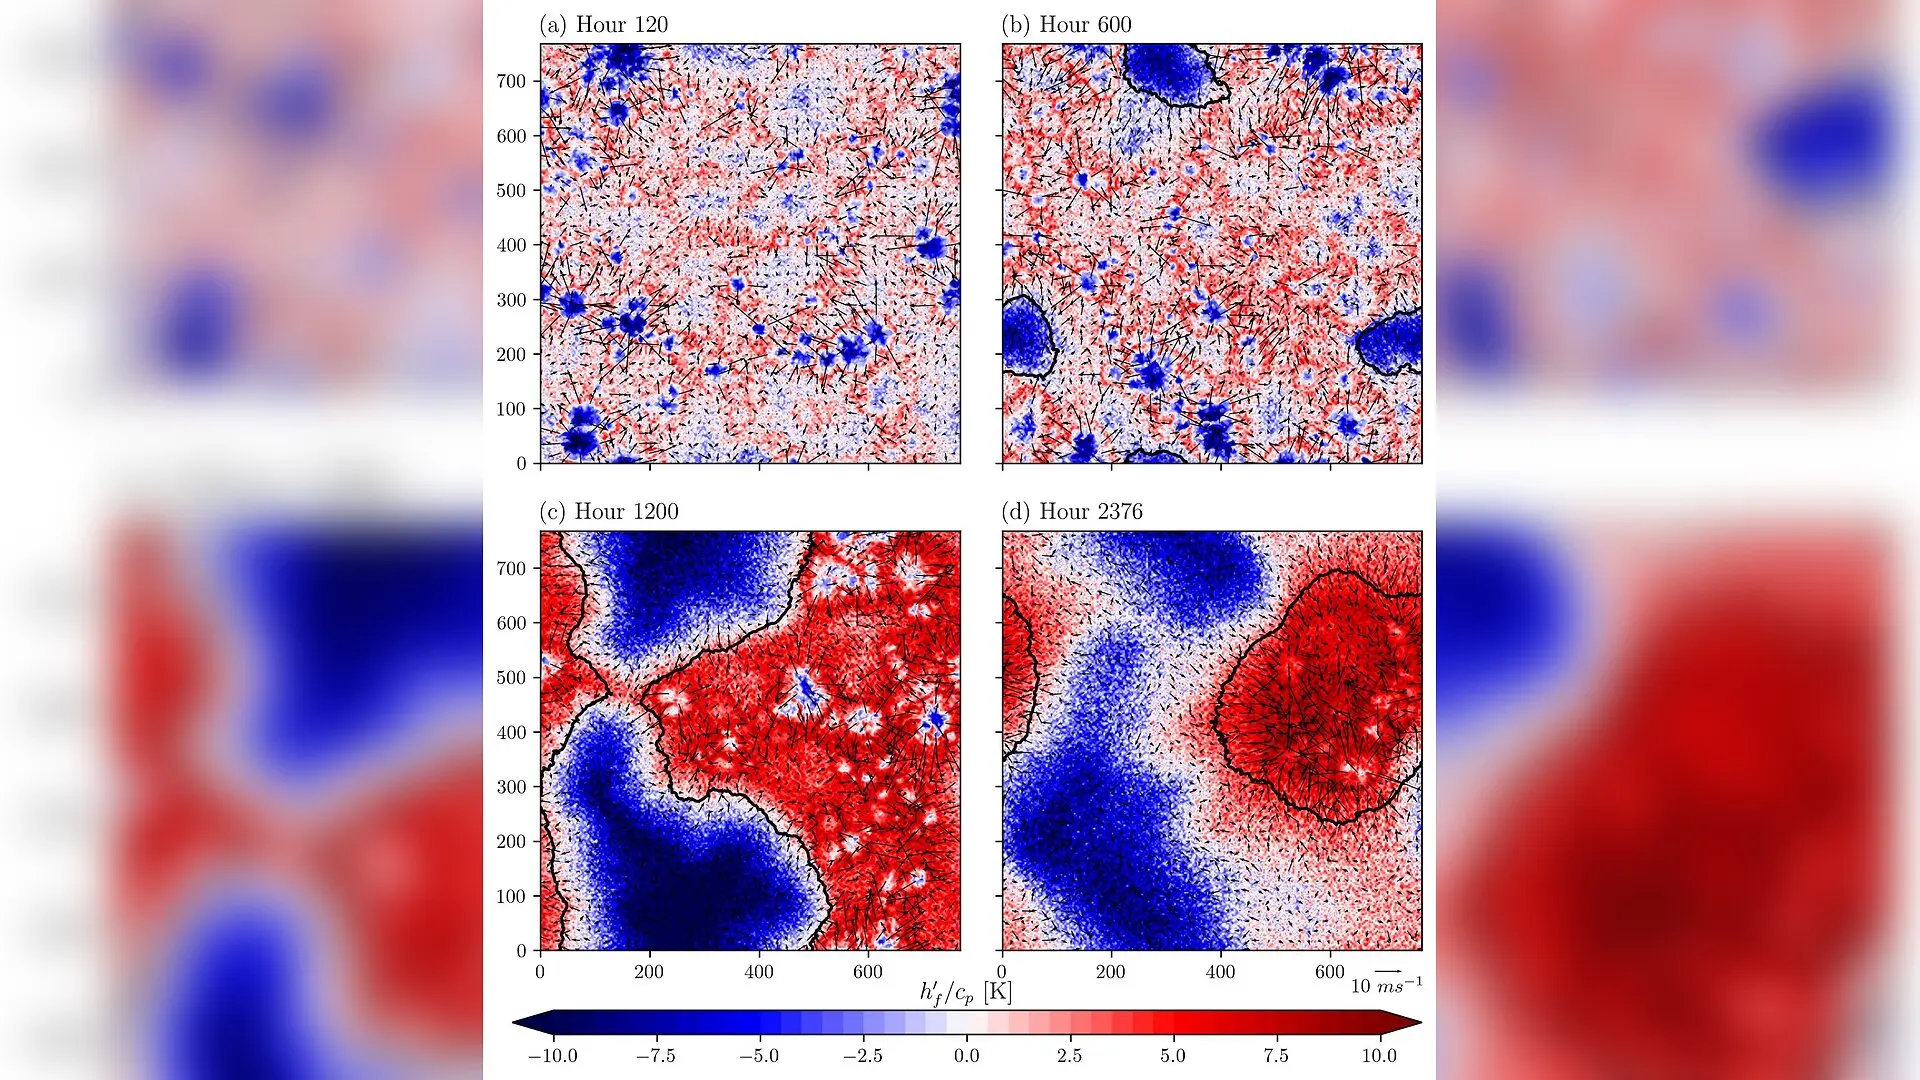
Deep convective clouds in the tropics can spontaneously clump together into massive, persistent clusters over a span of about 10 days, fundamentally altering regional weather patterns. Researchers tracking the invisible energy driving this atmospheric organization have discovered that the crucial engine behind cloud clustering lies at the top of the atmospheric boundary layer, roughly 1,000 meters above the surface.
To uncover how storms organize themselves on such a grand scale, a team of atmospheric scientists used advanced computer simulations to model radiative-convective equilibrium across a 768-kilometer square domain. The work, available on the arXiv preprint server, tracked the distribution of frozen moist static energy, which combines internal heat, potential energy, and latent moisture. By analyzing how energy variance changes across different heights, the authors mapped out the precise physical mechanisms that sustain massive storm systems.
How Large-Scale Circulation Drives Atmospheric Energy
For decades, many meteorologists assumed that local turbulent mixing was the primary driver of how heat and moisture moved through storm systems. However, the new analysis reveals that traditional down-gradient mixing models fail to capture the long-distance transport mechanisms at play. Instead of local eddies smoothing out differences, large-scale overturning circulations connect distant moist and dry regions, systematically moving energy across the atmosphere.
The study shows that energy variance is overwhelmingly generated near the boundary layer top, reaching a sharp peak around 1,100 meters. In this critical zone, strong vertical gradients of water vapor interact with robust vertical covariance fluxes. Ascending air currents pull high-energy moisture upward from the surface, while subsiding downdrafts push dry, low-energy air down from the free troposphere.
The Surprising Role of Radiation and Moisture Gradients
A long-standing debate in climate science has centered on whether radiative cooling directly forces cloud aggregation. The new budget analysis indicates that diabatic radiation does not directly drive local energy variance. Instead, radiation acts indirectly by establishing the background vertical stratification of the atmosphere, which then shapes how energy is produced.
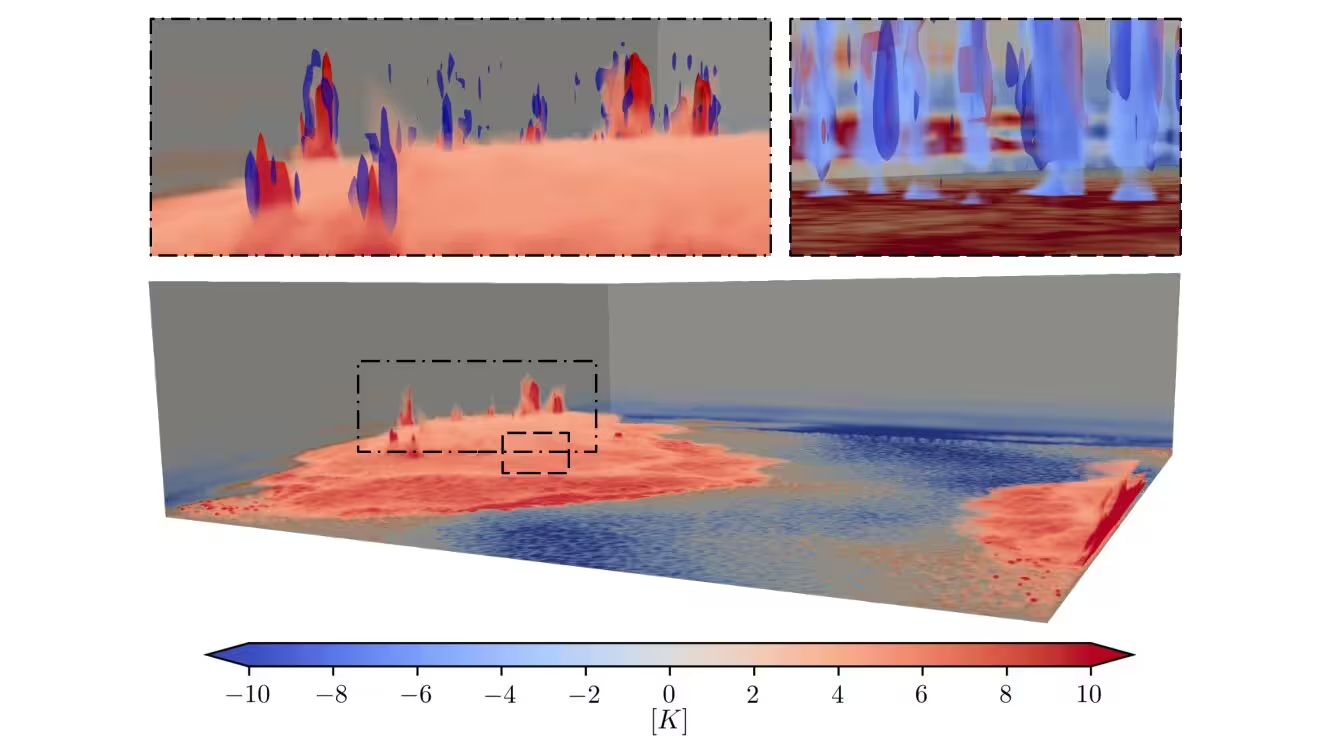
The authors found that vertical profiles of moisture exhibit intense gradients within the lowest 250 meters and again near the boundary layer top between 750 and 1,200 meters. These sharp transitions create a powerful thermodynamic feedback loop. Dry patches expand and merge over a period of 40 days, ultimately trapping convection into a single steady cluster while continuously drying out surrounding regions.
What This Means for Future Weather and Climate Models
Understanding the multi-scale physics of convective aggregation is essential for improving global climate simulations and daily weather forecasts. Because standard climate models often struggle to resolve small-scale cloud dynamics and boundary layer interactions, parameterizing these processes accurately remains a major hurdle.
The findings provide a rigorous mathematical framework for how energy variance cascades through the atmosphere, confirming that boundary layer dynamics and low-level circulations dictate the large-scale fate of tropical storms. As researchers prepare to explore how these local variances scale across different spatial dimensions in upcoming studies, these insights offer a clearer picture of the complex thermodynamic machinery powering our planet’s climate.
The study was posted to the arXiv preprint server on November 19, 2026.
This article has been fact checked for accuracy, with information verified against reputable sources. Learn more about us and our editorial process.
Last reviewed on .
Article history
- Latest version
Reference(s)
- Silvestri, Lorenzo. “Multi-scale dynamics of deep convective self-aggregation. Part I: physical-space structures and energy variance budget.” arXiv.org <http://arxiv.org/abs/2611.25807v1>.
Cite this page:
- Posted by Vikram Desai