New Simulation Reveals What Really Controlled the Brumadinho Mudflow
Researchers ran thousands of virtual scenarios to map how physical resistance forces stopped the catastrophic mining waste wave across the valley.
When the Brumadinho tailings dam collapsed in Brazil on January 25, 2019, releasing a massive 9.7 million cubic metres of iron-ore waste in under ten seconds, it triggered a disaster that claimed 270 lives. Until now, scientists studying the catastrophe have relied on deterministic models that use single fixed values to reconstruct the mudflow, missing how variable physical properties might alter the outcome.
A new study published in arXiv overturns that approach by applying a large-scale probabilistic framework to simulate 5,500 different breach scenarios. By combining advanced statistical metamodeling with hydrodynamic equations, the researchers mapped how uncertainties in the mud’s physical traits and initial rupture shape cascade through space and time across a 5.9-square-kilometre valley.
What Drives the Mudflow Uncertainty Near the Dam?
The research team, consisting of Yuri Taglieri Sáo, Geraldo de Freitas Maciel, and Julian Cardoso Eleutério, found that the forces driving the catastrophe change dramatically as the mud travels downstream. Right near Dam B1, the initial timing and volume of the surge are controlled entirely by hydrograph-related parameters, which describe how fast the failure happened and how quickly the material poured out.
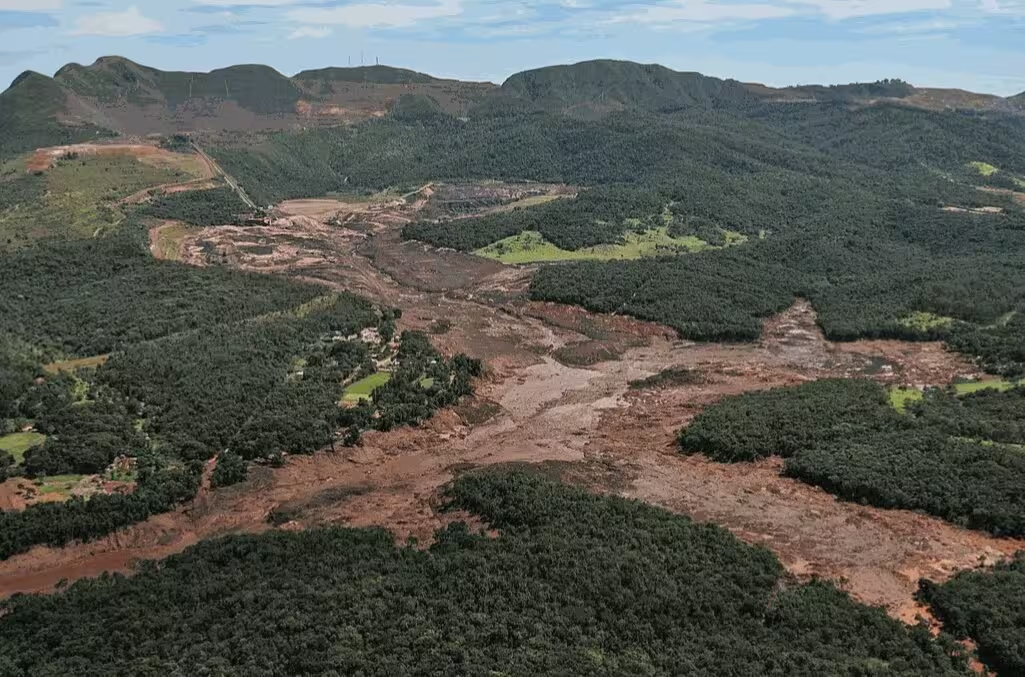
Within the first few hundred metres, variables like the total mobilization time and the relative peak time dictate the extreme flow depths, which topped 30 metres near the administrative buildings. However, this intense initial phase quickly gives way to a very different set of physical controls once the mud enters the narrow downstream valleys.
How Yield Stress Stops the Flow Farther Downstream
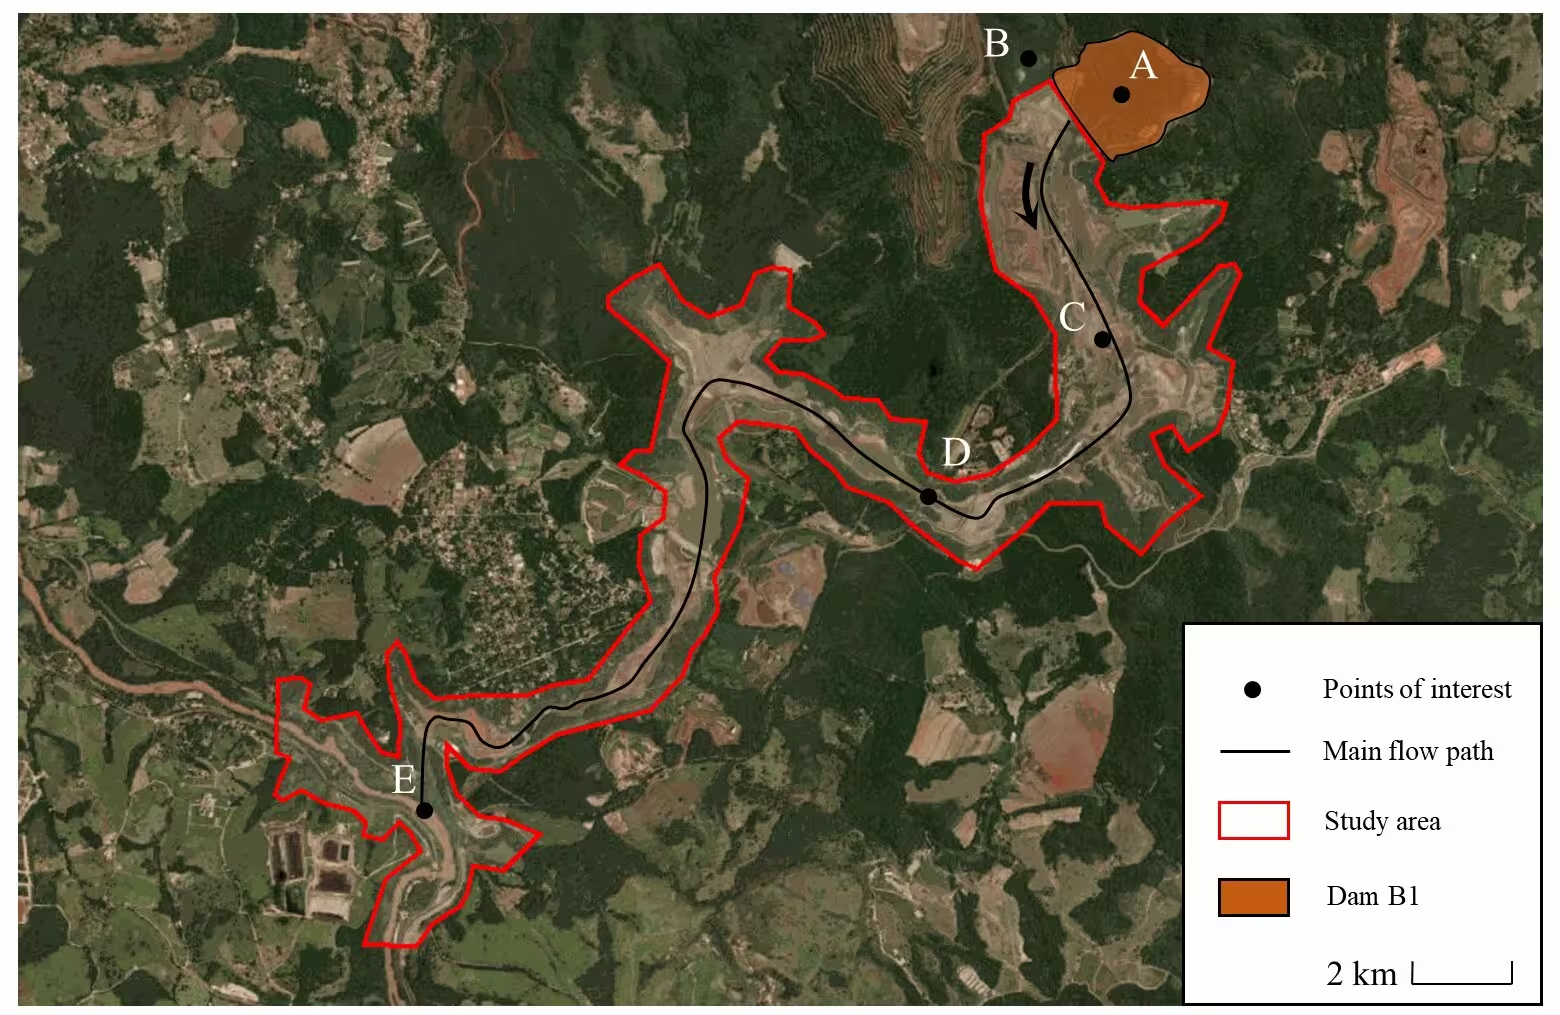
As the mud wave progresses toward control points like the destroyed railway bridge and eventually the Paraopeba river located 10 kilometres away, the initial release dynamics completely fade away. Instead, the behavior of the flow becomes dominated by the yield stress of the tailings material, which acts as a major resistance force against gravity.
The authors utilized the Bingham fluid model within the HEC-RAS v6.6 hydrodynamic software to show that yield stress dictates where the mud eventually arrests and stops moving. While scenarios with lower yield stress maintain high mobility and reach distant zones with significant depth, scenarios with higher yield stress cause earlier accumulation and stoppage in narrow topographic bottlenecks.
Why Probabilistic Risk Assessment Matters
Traditional single-scenario models often fail to capture areas that are only conditionally affected by mining waste disasters. By generating thousands of simulated outcomes, the probabilistic maps reveal a high-probability flooding zone spanning 90 to 100 percent across the immediate valley, while outlining wider peripheral zones with intermediate flooding risks where future hazard planning must account for deep uncertainty.
The researchers note that while approximations like the shallow-water equations and single-phase fluid assumptions cannot capture every micro-scale geotechnical nuance, the framework provides a robust way to evaluate complex environmental hazards. By identifying exactly which parameters matter most at different points along a flow path, engineering teams can better target their safety assessments and protect vulnerable downstream communities.
The study was posted to the arXiv preprint server on November 18, 2026.
This article has been fact checked for accuracy, with information verified against reputable sources. Learn more about us and our editorial process.
Last reviewed on .
Article history
- Latest version
Reference(s)
- Sáo, Yuri. “A probabilistic analysis of the Brumadinho tailings dam-breach using uncertainty quantification and global sensitivity analysis.” arXiv.org <http://arxiv.org/abs/2611.24172v1>.
Cite this page:
- Posted by Michael Ellison