AI Framework Predicts European Air and Rail Delays Using Hub Network Maps
A new knowledge graph model achieves high predictive accuracy by treating transit disruptions as interconnected causal events across five major European hubs.
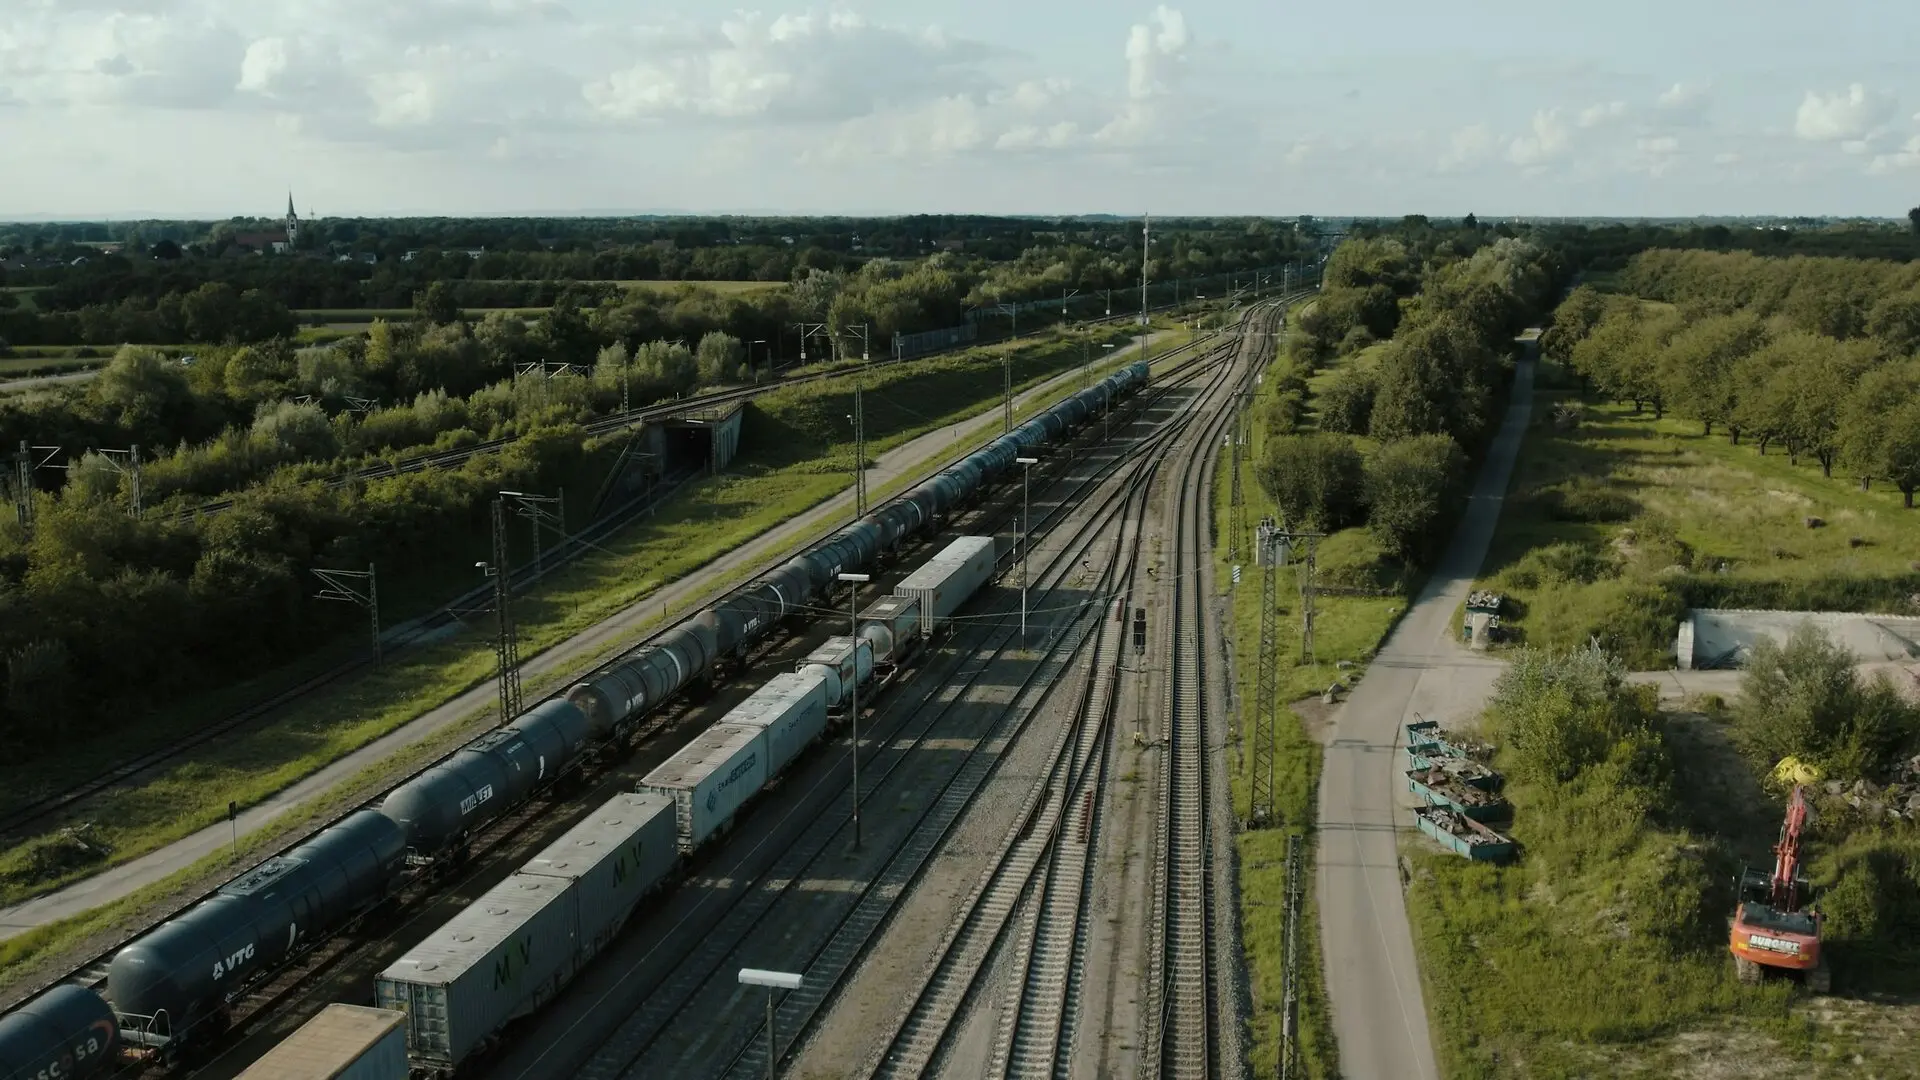
A new artificial intelligence framework successfully connects air and rail networks across five major European hubs by treating travel delays not as isolated incidents, but as a web of cascading events. Traditional transport management often treats a delayed flight or a broken train as a standalone problem, which leaves operators blind to how a single glitch can ruin thousands of passenger connections. To fix this blind spot, Ismini Stroumpou from the European Union Aviation Safety Agency and collaborators designed a collaborative system that maps the intricate web connecting airplanes, trains, and airport terminals. The results of the first phase of this initiative were published in Re-Generation in Transport, detailing how advanced data modeling can predict and prevent widespread transit chaos.
How Does a Knowledge Graph Connect Airplanes and Trains?
At the heart of the new system is a structure known as a Disruption Knowledge Model, which uses network mapping techniques to link physical infrastructure with operational failures. Instead of storing flight schedules and train timetables in separate databases, the knowledge graph models them as a directed graph where nodes represent operational entities such as airports, railway stations, and junction points. Edges connecting these nodes represent pathways that carry scheduled transfer times and real-time delay buffers. The model incorporates five core classes for railways, including disruption events, underlying cause factors, affected segments, individual train services, and resulting operational impacts. For aviation, the team added a sixth class representing the specific flight phase, such as pre-departure, departure, or en-route status, to capture the exact timing of airborne disturbances. By bringing together heterogeneous open datasets from operators across Europe, the researchers created a multi-instance modeling approach that preserves individual operator semantics while enabling cross-dataset benchmarking. A heuristic enrichment layer then estimates hidden variables like passenger load and infrastructure capacity to overcome the sparse nature of public transit data.
What Role Does Minimum Connection Time Play in Preventing Delays?
The pivotal metric governing passenger success across different modes of travel is the minimum connection time, which defines the shortest feasible buffer required for a traveler and their baggage to transfer between a train and a plane. Intermodal transfers depend heavily on terminal layouts, security checkpoints, baggage handling procedures, and the physical distance separating air and rail facilities. When an upstream delay shrinks this buffer below the required threshold, travelers risk missing their onward service, which triggers a wave of knock-on effects across the entire network. The AI system tracks static, dynamic, and multimodal variants of these connection times to calculate the precise probability of missed connections at five major European transport hubs. These hubs include Paris Charles de Gaulle, Amsterdam Airport Schiphol, Brussels Airport, Athens International Airport, and Bologna Guglielmo Marconi Airport.
Can Machine Learning Accurately Predict Severe Transit Disruptions?
To test whether the graph structure could actually forecast trouble, the researchers implemented a predictive analytics prototype using a machine learning algorithm called a Random Forest classifier. The model treats disruption management as a binary classification problem, aiming to predict whether an early-stage incident will escalate into a severe event. By leveraging relational features from the knowledge graph, such as infrastructure constraints, segment capacities, and rolling stock failures, the prototype achieved a receiver operating characteristic area under curve score of 0.834. This metric confirms that graph-based relational data holds superior predictive power compared to traditional, isolated event records.
How Do Different Hub Layouts Change Recovery Strategies?
The practical application of the artificial intelligence module varies significantly depending on the physical layout of each transport hub. At tightly integrated hubs like Amsterdam and Brussels, where train stations sit directly beneath airport terminals, the system can mitigate delays by triggering operational fast-track lanes for stranded passengers. At adjacent hubs like Athens, where the railway station stands right next to the terminal, the model relies on specific connection time parameters to calculate transfer loss probabilities and manage foot traffic. In contrast, at distributed hubs like Paris Charles de Gaulle and Bologna, where transfers require long bus rides or shuttle services, the system anticipates a much higher probability of missed connections. In those challenging scenarios, the algorithm autonomously evaluates complex recovery options, such as holding outbound flights or proactively rebooking passengers, to minimize the cascading impact across the broader European network. Moving forward, the development team plans to transition from the initial open-data prototype to operational deployment on the Italian multimodal network, introducing temporal graph neural networks to better forecast the magnitude of delay propagation.
The research was published in Re-Generation in Transport on November 22, 2026.
This article has been fact checked for accuracy, with information verified against reputable sources. Learn more about us and our editorial process.
Last reviewed on .
Article history
- Latest version
Reference(s)
- Stroumpou, Ismini., et al. “Bridging Disruptions: AI-Driven Coordination Across Air and Rail Networks.” Lecture Notes in Mobility, November 22, 2026, pp. 1185-1193. Springer Nature Switzerland, doi: 10.1007/978-3-032-36098-4_140. <https://doi.org/10.1007/978-3-032-36098-4_140>.
Cite this page:
- Posted by Michael Ellison