Zebrafish Study Reveals How Cellular Pushing And Pulling Forces Build Open Blood Vessels
Medicine

Zebrafish Study Reveals How Cellular Pushing And Pulling Forces Build Open Blood Vessels

High-resolution imaging shows that oscillating protrusions and targeted protein contraction allow endothelial cells to reshape tissue architecture.
By Sana Malik
Published:
Email this Article
Zebrafish Study Reveals How Cellular Pushing And Pulling Forces Build Open Blood Vessels
Photo by Aakash Dhage on Unsplash

When developing blood vessels in zebrafish embryos assemble their fluid-carrying channels, specialized cellular structures known as junction-based lamellipodia generate alternating pushing and pulling forces to reshape tissue architecture. The findings, published in eLife, reveal how endothelial cells within blood vessel walls rearrange themselves to create continuous, open channels required for circulation.

During the formation of vascular networks, individual cells must coordinate their movements to hollow out solid cords of tissue and form patent tubes. Researchers led by Heinz-Georg Belting and Markus Affolter at the Biozentrum of the University of Basel investigated the physical and molecular mechanics behind this process, focusing on oscillating membrane protrusions that form at cell-cell contacts. Using high-resolution live imaging in zebrafish embryos, the team tracked how these protrusions drive the elongation of junctions between neighboring endothelial cells.

How Do Cellular Protrusions Push And Pull To Shape Blood Vessels?

The analysis showed that junction-based lamellipodia operate in a cyclical, four-step pattern that acts like a physical ratchet mechanism. First, the protrusions form at the front edge of a cell junction. The team discovered that this initial step depends entirely on the activity of the Arp2/3 protein complex, which drives the polymerization of a protein scaffold known as F-actin to push the membrane forward.
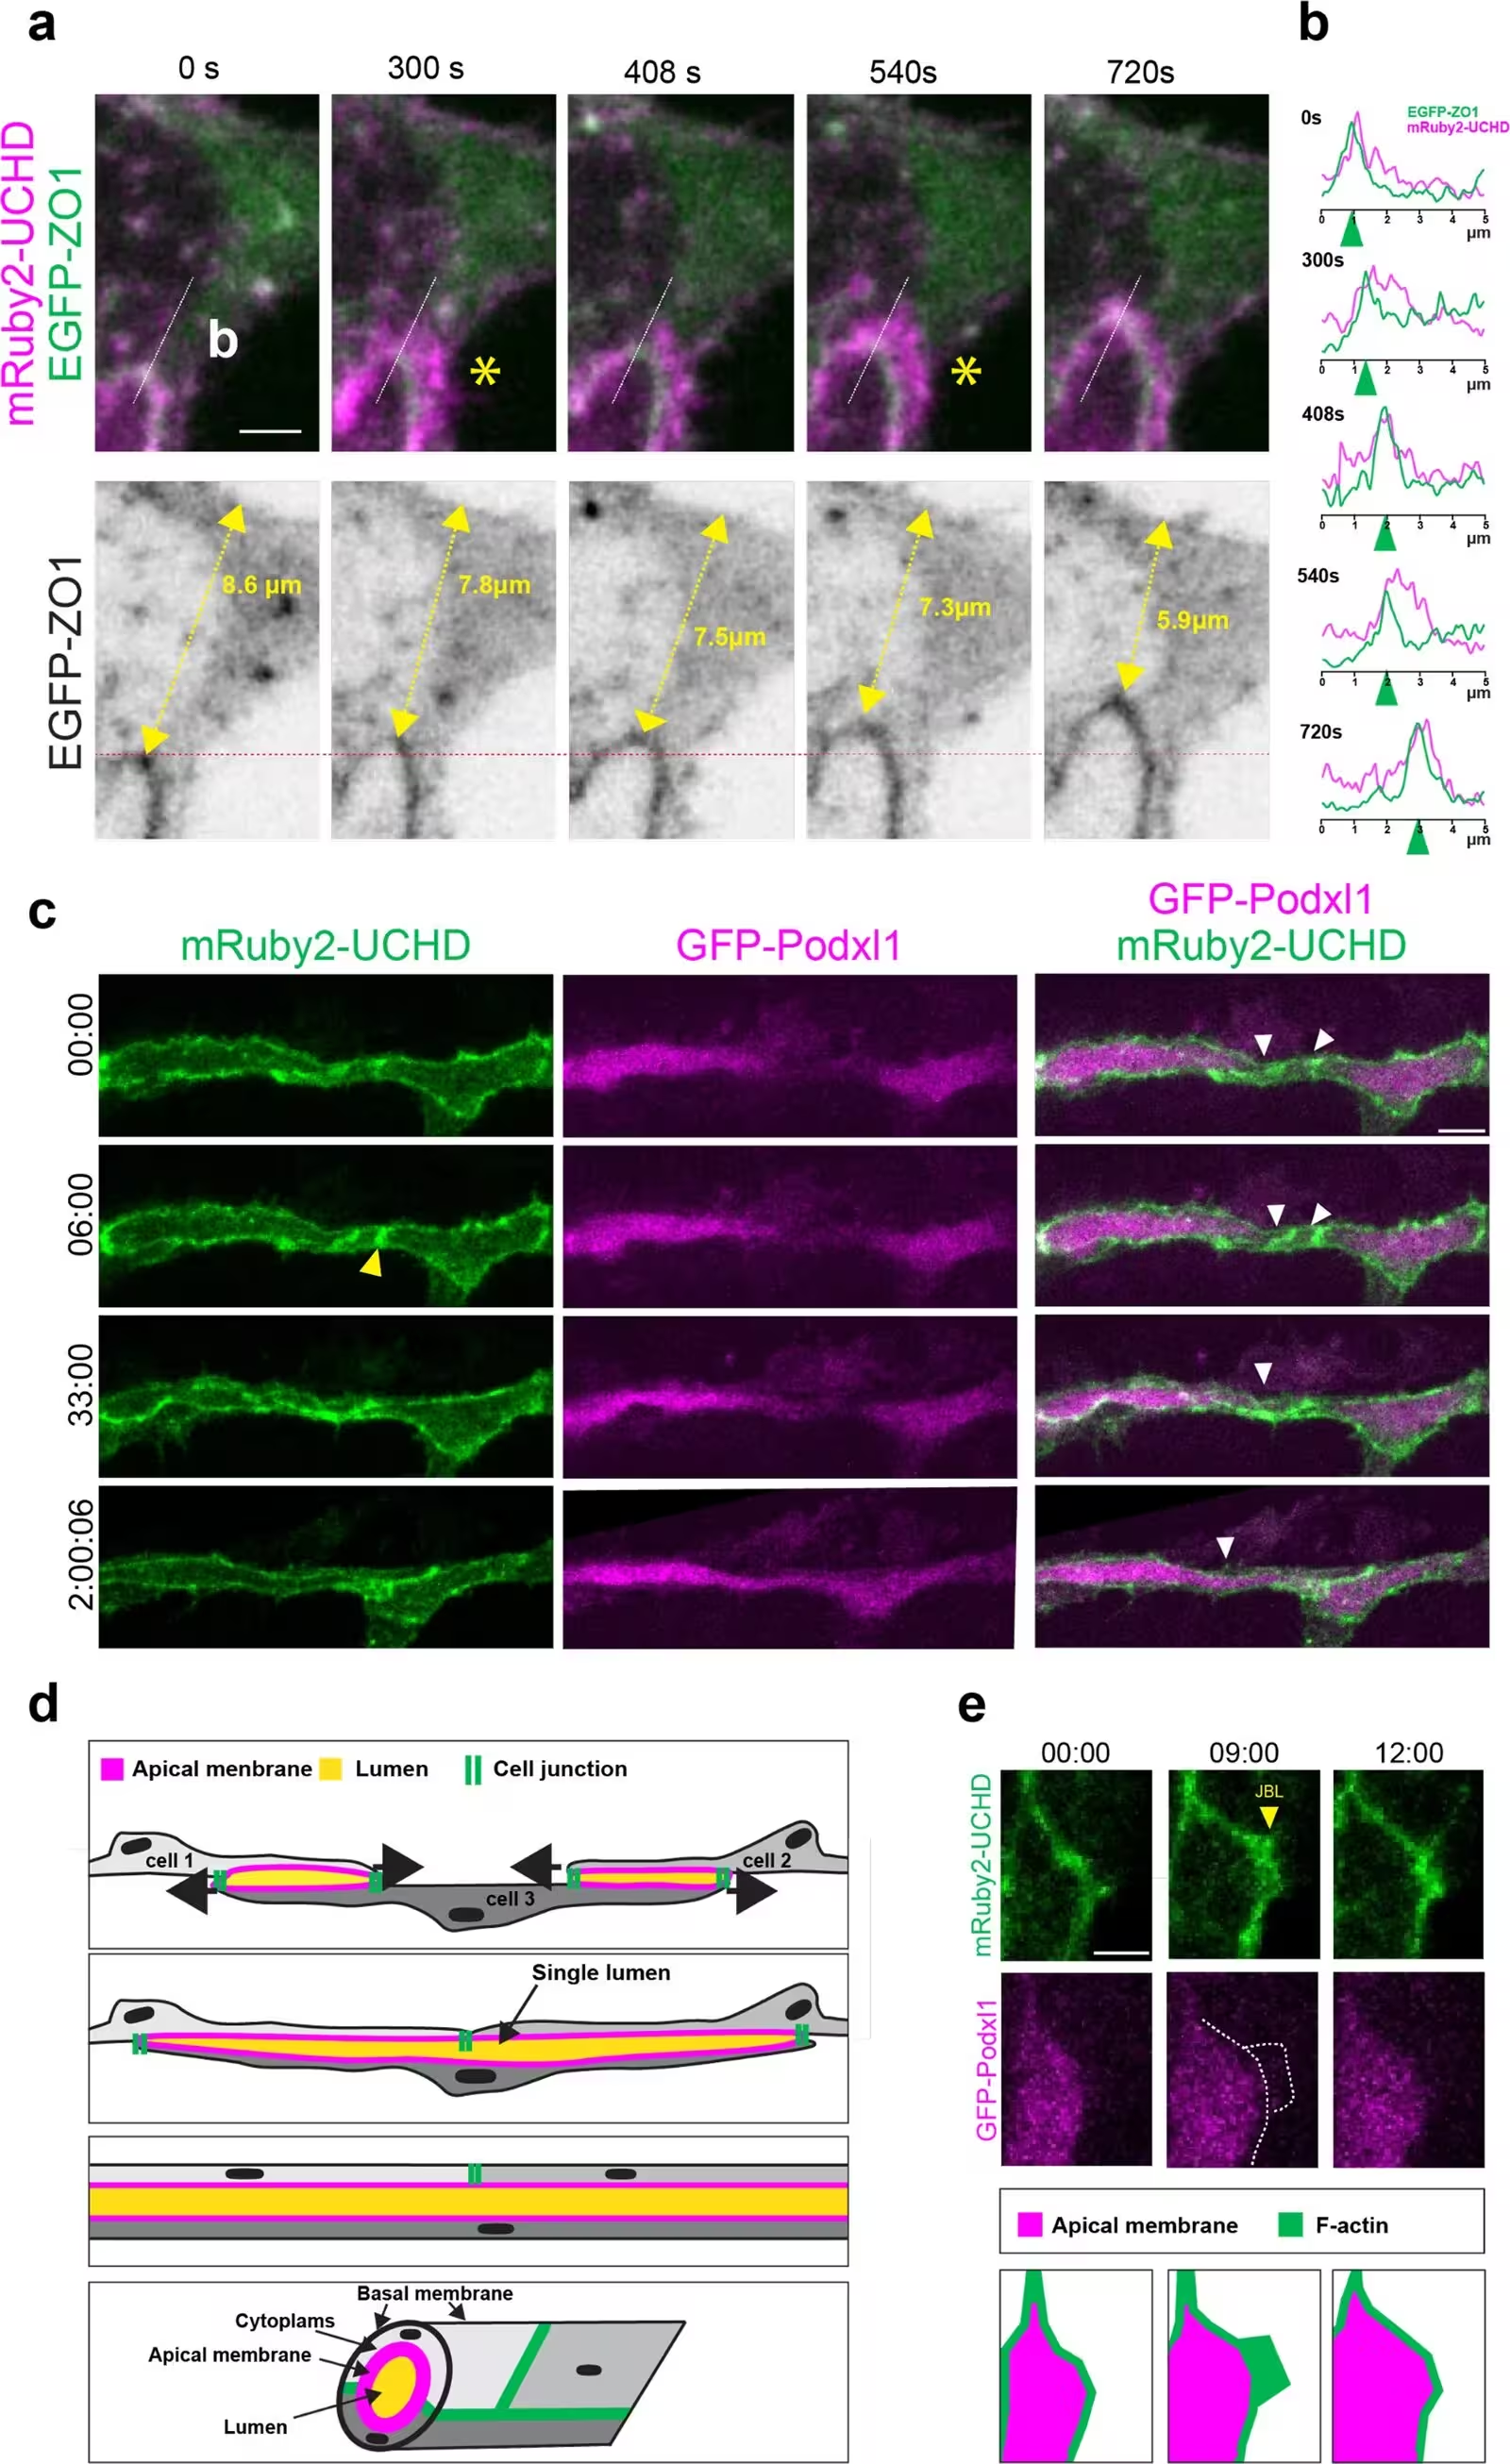
Figure 1: JBL generate luminal connectivity. (a) High-resolution time-lapse video (Figure 1—video 1) of EGFP-ZO1 and mRuby2-UCHD during junctional rearrangements. Yellow asterisks point to JBL. Yellow double-headed arrows indicate the distance between the junction and the dorsal end of the DLAV. Scale bar: 2 μm. (b) Plots displaying the signal intensities of EGFP-ZO1 and mRuby2-UCHD, along the white lines, at different time points during several JBL cycles. (c) Still images of time-lapse video (Figure 1—video 2) showing EGFP-Podxl1 and mRuby2-UCHD during luminal fusion, starting at approximately 32 hpf. The leading edges of the converging junctions are indicated by white arrowheads. Yellow arrowheads point to JBL. Scale bar: 10 μm. (d) Graphic depiction of blood vessel lumenization by cell convergence. Top: At first, cells 1 and 3 and cells 2 and 3, respectively, are forming cell–cell interfaces (cell junctions: green), which enclose local lumens (apical membrane: purple). Middle: JBL drive conv
JBL generate luminal connectivity. (a) High-resolution time-lapse video (Figure 1—video 1) of EGFP-ZO1 and mRuby2-UCHD during junctional rearrangements. Yellow asterisks point to JBL. Yellow double-headed arrows indicate the distance between the junction and the dorsal end of the DLAV. Scale bar: 2 μm. (b) Plots displaying the signal intensities of EGFP-ZO1 and mRuby2-UCHD, along the white lines, at different time points during several JBL cycles. (c) Still images of time-lapse video (Figure 1—video 2) showing EGFP-Podxl1 and mRuby2-UCHD during luminal fusion, starting at approximately 32 hpf. The leading edges of the converging junctions are indicated by white arrowheads. Yellow arrowheads point to JBL. Scale bar: 10 μm. (d) Graphic depiction of blood vessel lumenization by cell convergence. Top: At first, cells 1 and 3 and cells 2 and 3, respectively, are forming cell–cell interfaces (cell junctions: green), which enclose local lumens (apical membrane: purple). Middle: JBL drive conv Credit: Ludovico Maggi et al. / eLife

As the F-actin network expands the protrusion, a new cell-cell contact forms at the distal tip from a pool of specialized adhesion molecules called VE-cadherin. Photoconversion experiments demonstrated that this new distal junction forms de novo through the recruitment of VE-cadherin from outside pools, rather than through the disassembly of existing local junctions.

What Happens When Contractile Forces Take Over?

Once the distal junction is established, the cellular machinery shifts from pushing to pulling. Imaging fluorescently tagged myosin regulatory light chain proteins revealed a heavy accumulation of non-muscle myosin II within the inter-junctional space between the proximal and distal contacts. This localized concentration of contractile proteins generates a pulling force that draws the two separate junctions together until they merge.
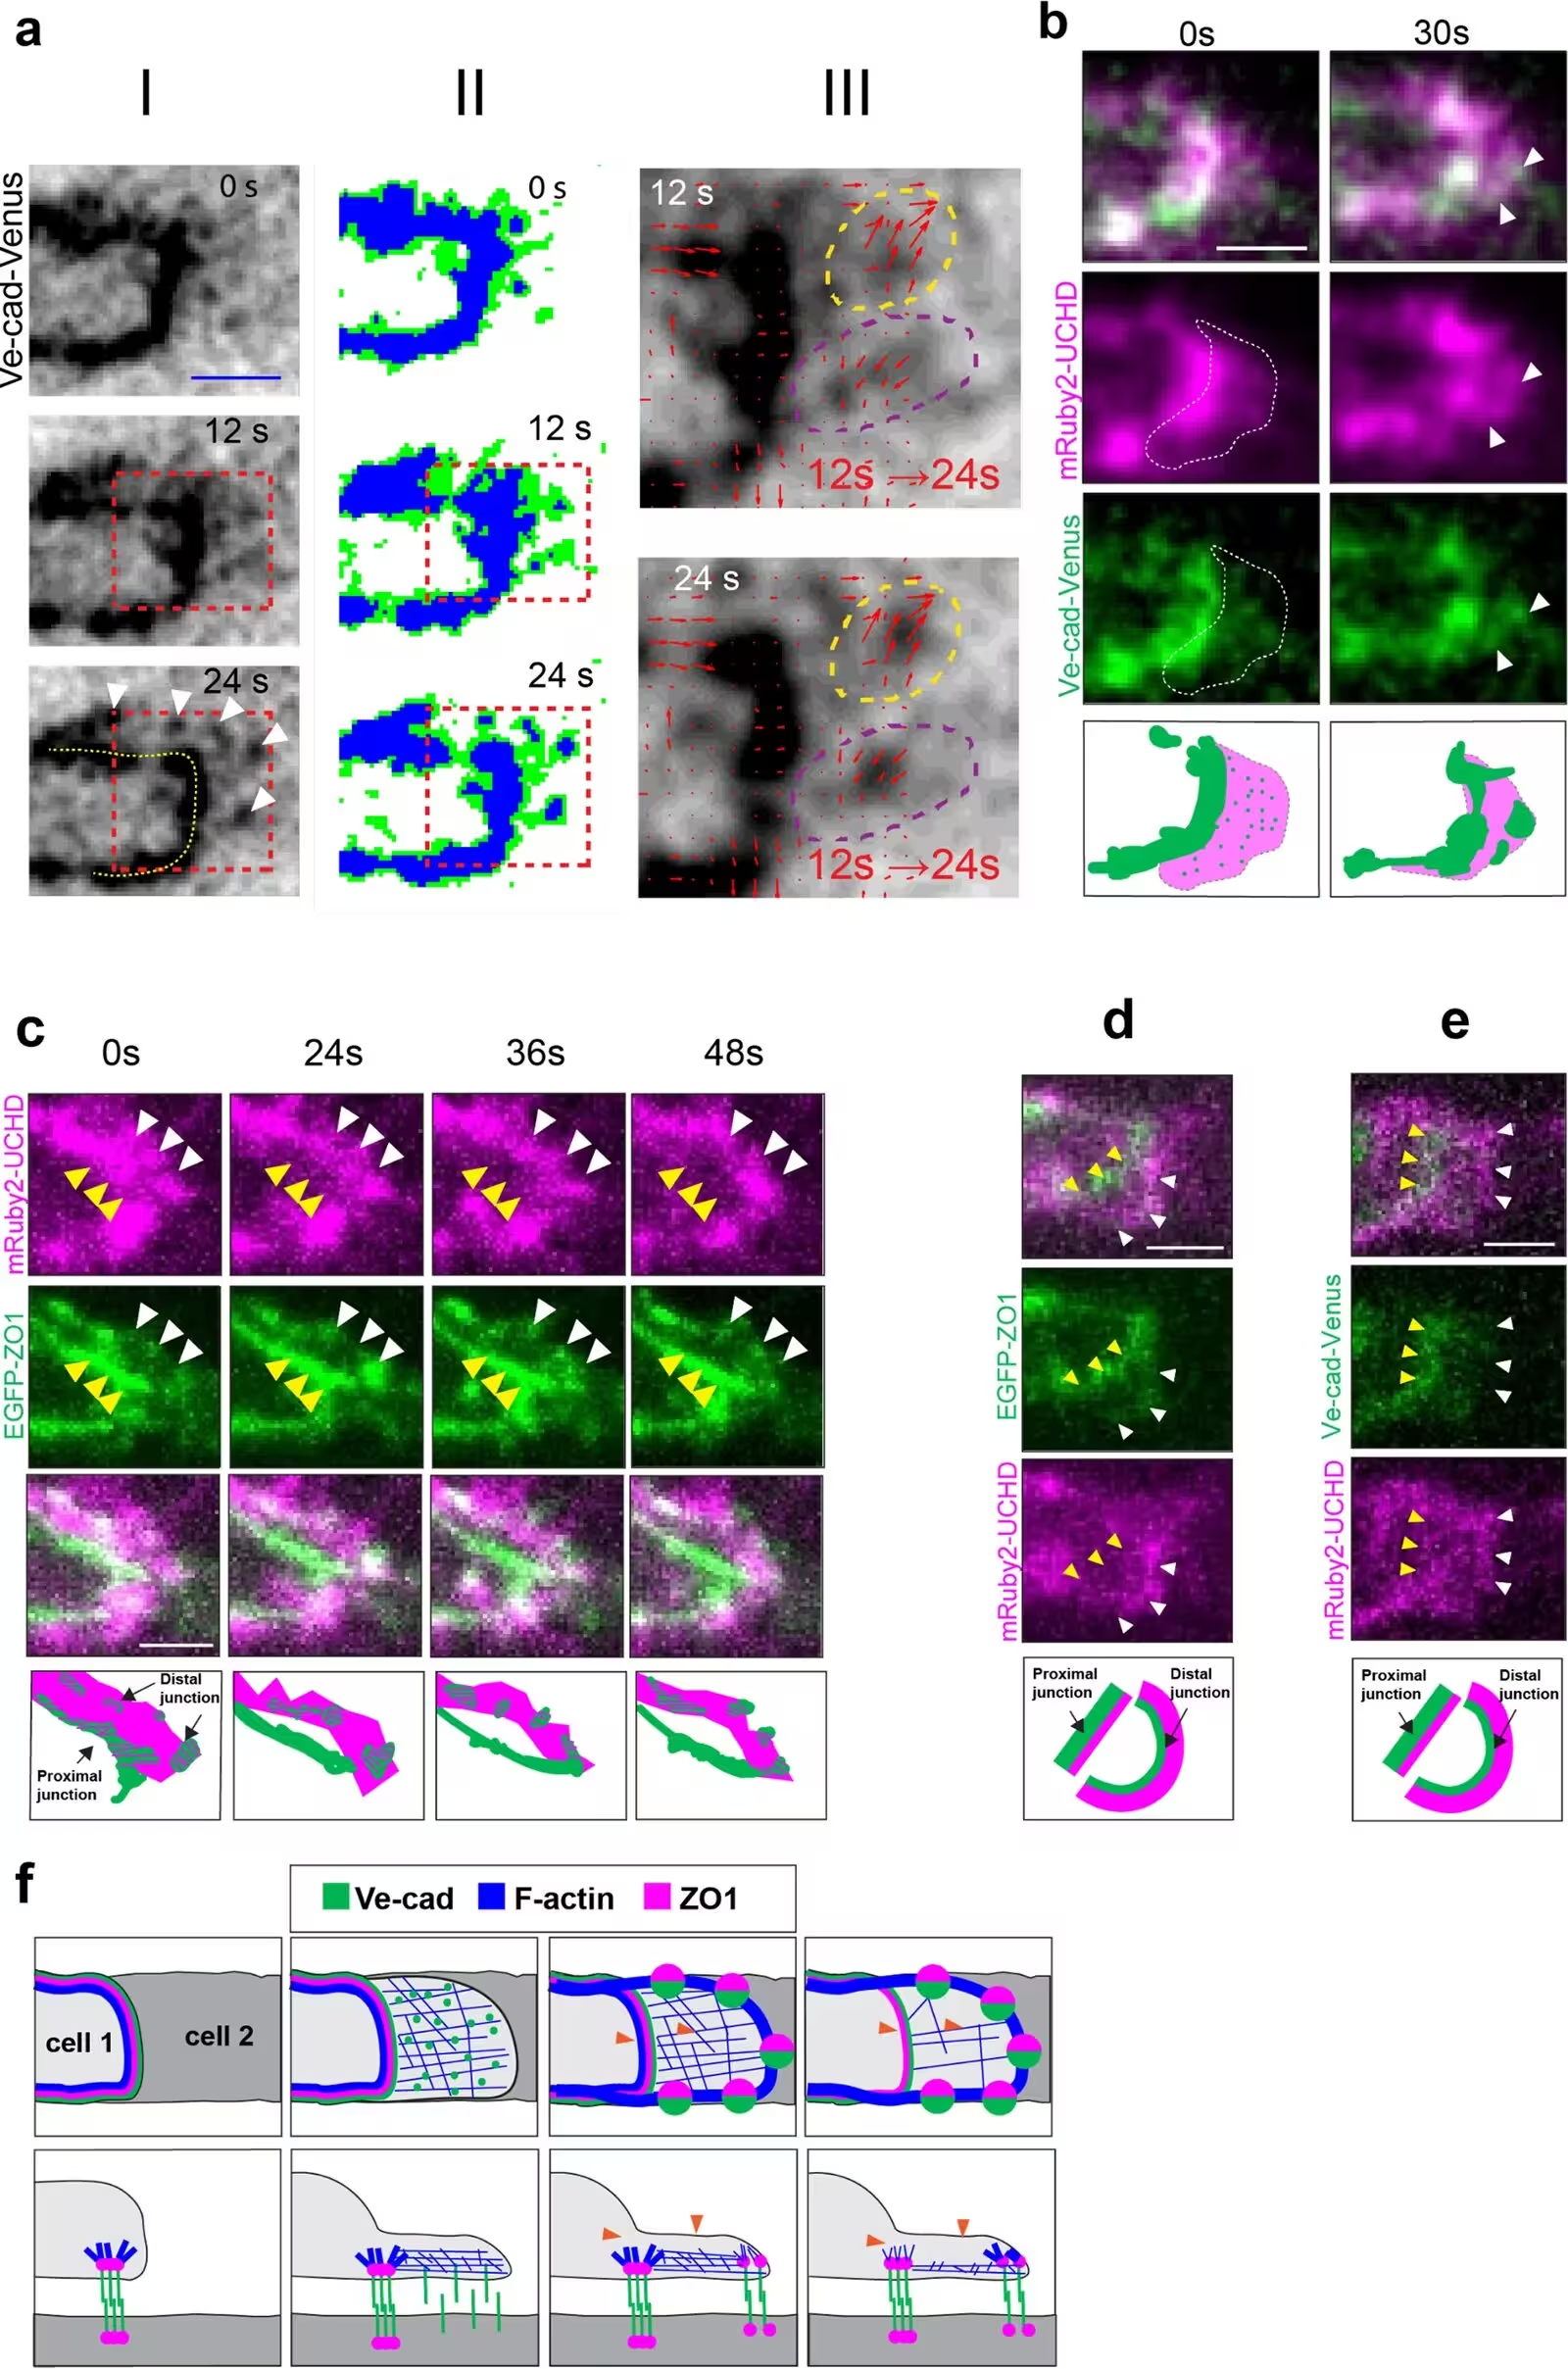
Figure 2: JBL form new junctions at the distal end of the membrane protrusion. (a) (I) Time-lapse video (Figure 2—video 1) of VE-cad-Venus imaged at a rate of 1 stack/12 s during distal junction formation. New distal junctions emerge in clusters at the distal end of the JBL. VE-cad is diffusely localized in early JBL, while it accumulates in big foci at later time points. Scale bar: 2 μm. (II) Three-level thresholding of a grayscale image. The original grayscale image (I) is segmented into three intensity levels: background (white), intermediate signal (green), and strong signal (blue). (III) Tracking of VE-cad aggregates from 12 to 24 s. Particle trajectories are shown as arrows from 12 to 24 s, with arrowheads indicating the direction of movement. Dashed circles highlight dynamic aggregation of VE-cad at distal junctions. White arrowheads point distal to the junction. Yellow dashed line highlights the proximal junction. (b) Still images of time-lapse video showing mRuby2-UCHD and VE-cad-Venus
JBL form new junctions at the distal end of the membrane protrusion. (a) (I) Time-lapse video (Figure 2—video 1) of VE-cad-Venus imaged at a rate of 1 stack/12 s during distal junction formation. New distal junctions emerge in clusters at the distal end of the JBL. VE-cad is diffusely localized in early JBL, while it accumulates in big foci at later time points. Scale bar: 2 μm. (II) Three-level thresholding of a grayscale image. The original grayscale image (I) is segmented into three intensity levels: background (white), intermediate signal (green), and strong signal (blue). (III) Tracking of VE-cad aggregates from 12 to 24 s. Particle trajectories are shown as arrows from 12 to 24 s, with arrowheads indicating the direction of movement. Dashed circles highlight dynamic aggregation of VE-cad at distal junctions. White arrowheads point distal to the junction. Yellow dashed line highlights the proximal junction. (b) Still images of time-lapse video showing mRuby2-UCHD and VE-cad-Venus Credit: Ludovico Maggi et al. / eLife

To test whether these forces are strictly required for vessel formation, the researchers applied pharmacological inhibitors to disrupt the system. Treating embryos with CK666 to block the Arp2/3 complex prevented proper protrusion formation, leading to a surge of abnormal filopodia and dropping the speed of junctional elongation from an average of eight micrometers per hour down to three. Similarly, inhibiting actomyosin contractility with a compound called Y-27632 blocked the merging of proximal and distal junctions, trapping the cells in a stalled double-junction state.

The authors suggest that the stable junctions flanking the contractile zone act as physical insulators, keeping tension tightly confined to the area where rearrangement is needed. These observations provide a detailed mechanical model for how multicellular blood vessels open their lumens during early vertebrate development.

The research was published in eLife on November 19, 2026.

Fact Checked

This article has been fact checked for accuracy, with information verified against reputable sources. Learn more about us and our editorial process.

Last reviewed on .

Article history

  • Latest version

Reference(s)

  1. Maggi, Ludovico., et al. “Junctional and actomyosin dynamics drive endothelial cell rearrangements during vascular tube formation.” eLife, vol. 14, November 19, 2026 eLife Sciences Publications, Ltd, doi: 10.7554/eLife.109264. <https://doi.org/10.7554/eLife.109264>.

Cite this page:

Malik, Sana. “Zebrafish Study Reveals How Cellular Pushing And Pulling Forces Build Open Blood Vessels.” BioScience. BioScience ISSN 2521-5760, 22 November 2026. <https://www.bioscience.com.pk/en/subject/medicine/junctional-and-actomyosin-dynamics-drive-endothelial-cell-rearrangements-during-vascular-tube-formation>. Malik, S. (2026, November 22). “Zebrafish Study Reveals How Cellular Pushing And Pulling Forces Build Open Blood Vessels.” BioScience. ISSN 2521-5760. Retrieved November 22, 2026 from https://www.bioscience.com.pk/en/subject/medicine/junctional-and-actomyosin-dynamics-drive-endothelial-cell-rearrangements-during-vascular-tube-formation Malik, Sana. “Zebrafish Study Reveals How Cellular Pushing And Pulling Forces Build Open Blood Vessels.” BioScience. ISSN 2521-5760. https://www.bioscience.com.pk/en/subject/medicine/junctional-and-actomyosin-dynamics-drive-endothelial-cell-rearrangements-during-vascular-tube-formation (accessed November 22, 2026).
End of the article