Smart Shelter Redesign Dramatically Boosts Disaster Survival Odds
Strategic spatial reordering of existing emergency shelters expands population coverage by over ten percent without building new facilities.
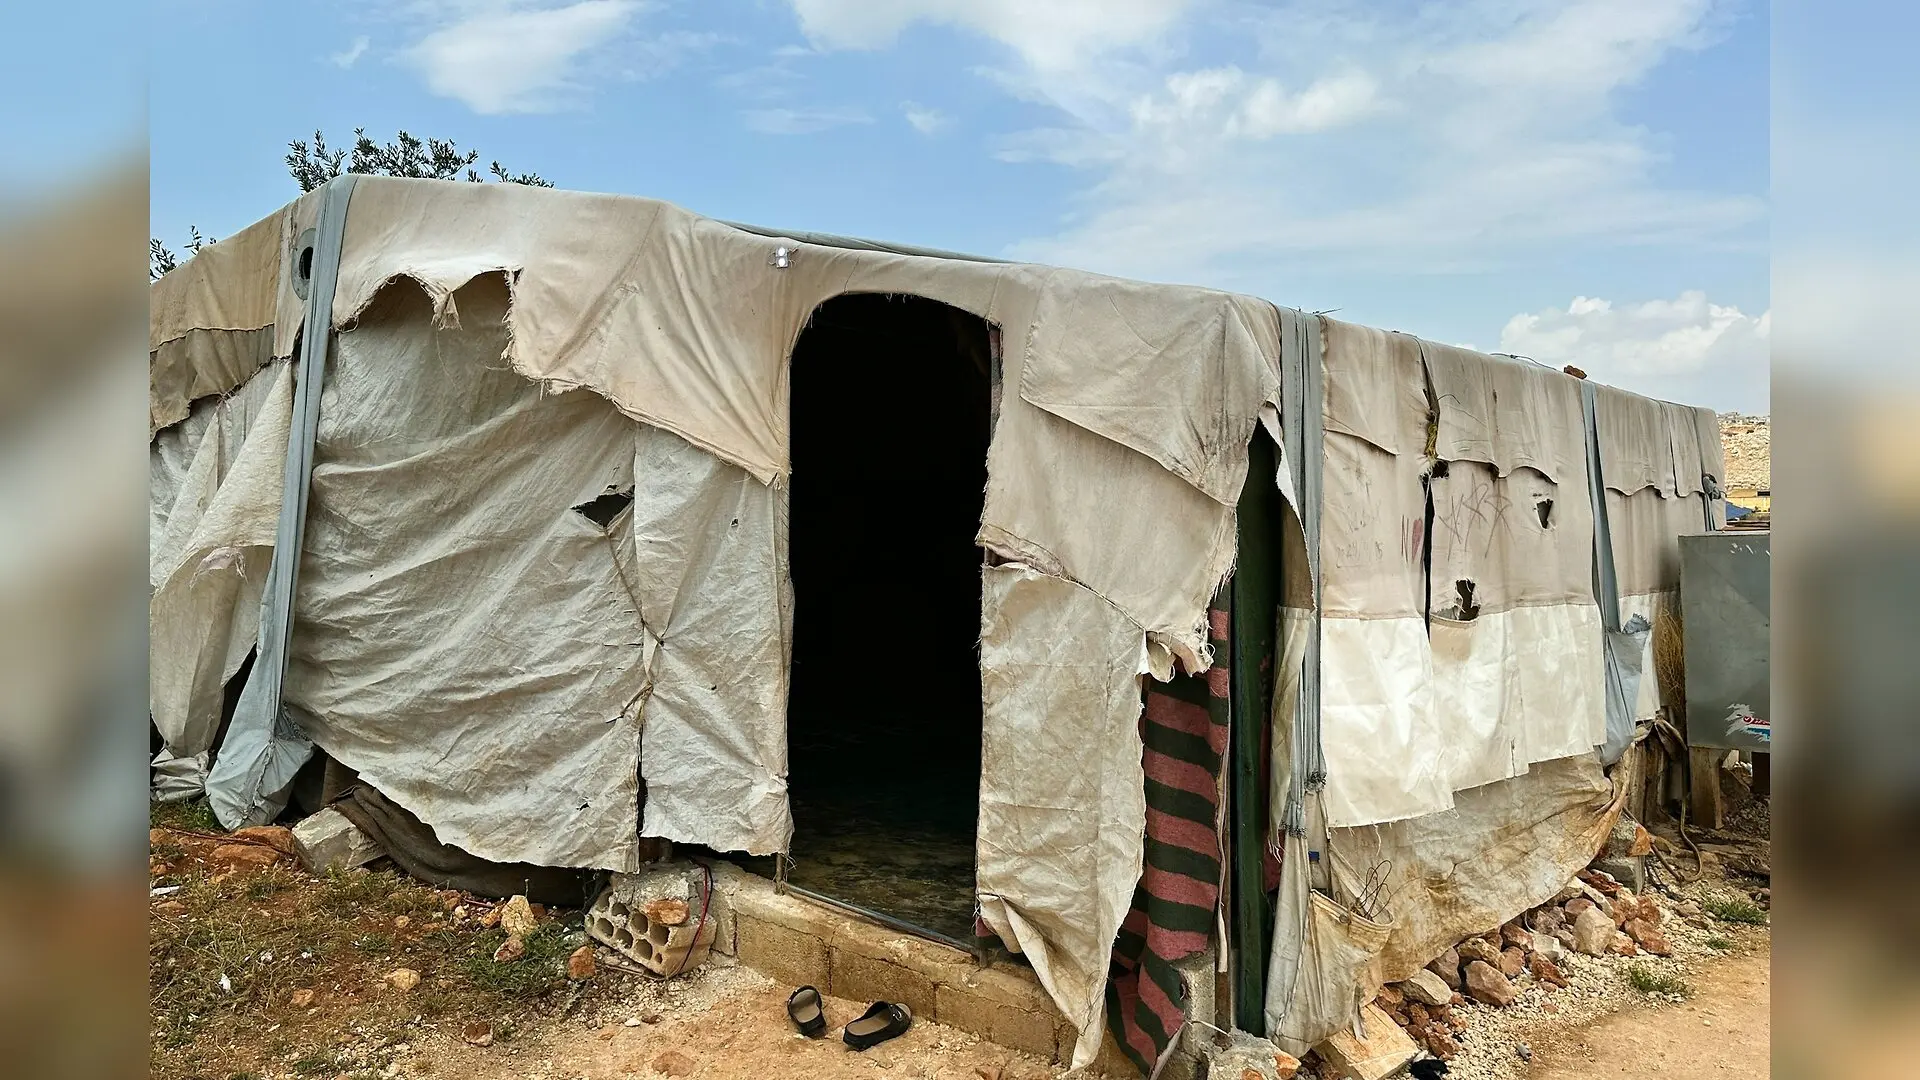
Emergency shelters designed to protect residents from single threats often leave communities dangerously exposed when multiple disasters strike at once, raising urgent questions about how cities plan for crises. A team of researchers studying mountainous regions in China discovered that strategically rearranging existing emergency refuges rather than building entirely new ones can dramatically expand life-saving coverage during overlapping threats like earthquakes, landslides, floods, and secondary fires.
By mapping terrain hazards and population distributions, the study published in PloS one demonstrates a novel way to upgrade urban safety without expanding city footprints. Mountainous cities face severe structural challenges because steep slopes and winding river systems restrict where safe spaces can be established. Traditional emergency planning usually evaluates individual risks in isolation, overlooking how an earthquake might trigger destructive debris flows or how rising floodwaters can block evacuation routes.
How Can Cities Balance Multiple Hazards in Shelter Planning?
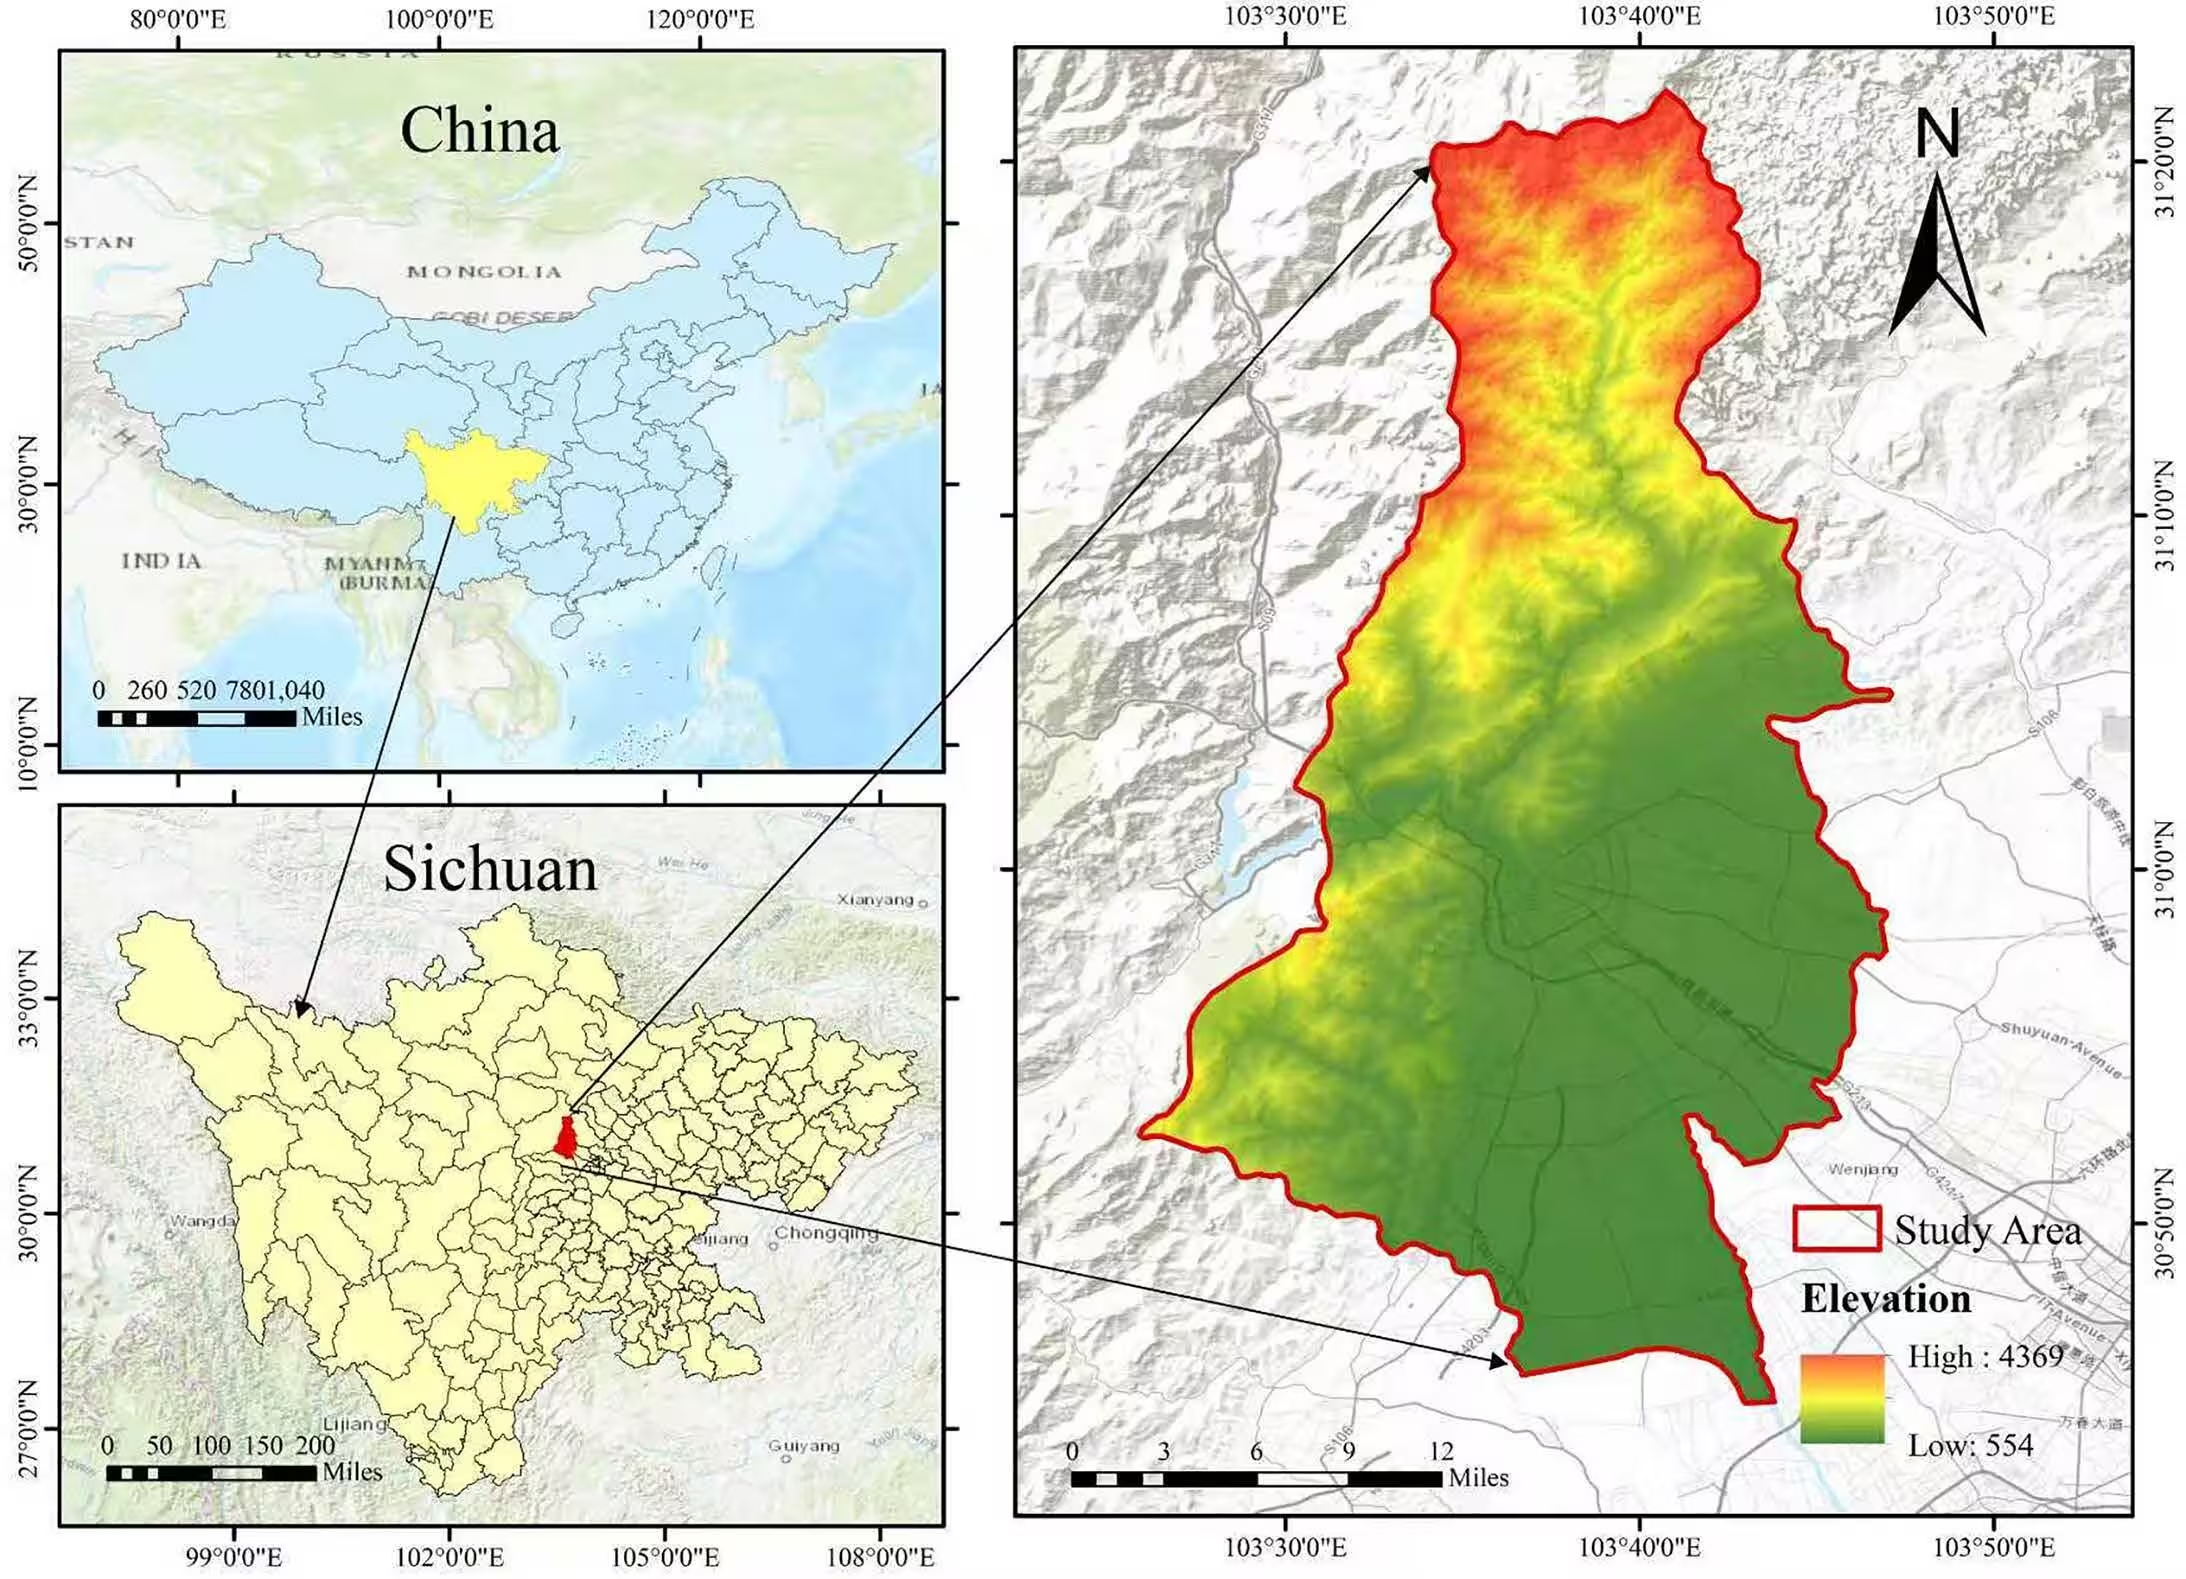
To solve the complex puzzle of multi-hazard vulnerability, the researchers constructed a high-resolution geographic information system model centered on Dujiangyan City, a region covering 1,208 square kilometers along the seismically active Longmenshan Fault Zone. This terrain transitions sharply from high mountain valleys exceeding 2,000 meters in elevation down to the densely populated alluvial plains of the Chengdu Plain. The team evaluated 135 existing emergency shelters alongside 182 potential candidate sites derived from public infrastructure data such as schools, parks, and plazas.

Instead of relying solely on subjective expert opinions, the authors employed a hybrid weighting approach that combined the Entropy Weight Method for objective data variability with a Random Forest machine learning algorithm to capture non-linear relationships among risk indicators. This system evaluated four primary dimensions: exposure of at-risk elements, physical hazard proximity, infrastructure connectivity, and population service efficiency. The resulting multi-objective spatial optimization model sought to maximize population coverage and shelter suitability while minimizing redundant service-area overlaps.
What Happens When Refuges Are Reconfigured Instead of Expanded?
Maintaining the exact same total of 135 shelters allowed the team to isolate the pure effect of spatial reorganization. The optimized layout significantly boosted population coverage from 55.9 percent up to 66.1 percent, expanding the number of protected residents from 393,927 to 465,732 people. Furthermore, per-shelter service efficiency increased from 2,918 to 3,450 people per facility, reflecting a more balanced distribution of resources across densely populated neighborhoods.
Service redundancy dropped substantially, with overlapping coverage areas decreasing from 87.6 percent down to 56.8 percent. Although the average safety score showed a minor decline from 0.4577 to 0.4409, the authors describe this small drop of 3.7 percent as an acceptable trade-off for the massive gains in overall coverage and operational efficiency. The optimized network categorizes shelters into three distinct operational tiers, including 53 comprehensive hubs, 21 specialized facilities tailored to specific threats, and 61 basic service points.
What Are the Limitations of This Spatial Framework?
Despite these promising improvements, the researchers noted several constraints that should be considered before applying the framework elsewhere. Building capacity limits were not directly embedded into the mathematical optimization objective, and accessibility was estimated using straight-line Euclidean distances rather than actual network travel times, which may not fully capture the rugged terrain of mountainous urban environments. Additionally, population data were treated as static, and hazard exposures relied on proximity metrics rather than real-time probabilistic intensity maps.
Future iterations of this work aim to incorporate dynamic population movements derived from mobile phone signals and integrate detailed road network conditions. Nevertheless, the current findings indicate that municipal authorities can achieve substantial resilience gains simply by reevaluating the spatial arrangement of existing infrastructure before investing in costly new construction projects.
The research was published in PloS one on November 19, 2026.
This article has been fact checked for accuracy, with information verified against reputable sources. Learn more about us and our editorial process.
Last reviewed on .
Article history
- Latest version
Reference(s)
- Chen, Gang., et al. “A proximity‑based multi‑indicator framework for optimizing emergency shelter layout in a mountainous city: A case study of Dujiangyan, China.” PLOS One, vol. 21, no. 11, November 19, 2026, pp. e0363150 Public Library of Science (PLoS), doi: 10.1371/journal.pone.0363150. <https://doi.org/10.1371/journal.pone.0363150>.
Cite this page:
- Posted by Vikram Desai