James Webb Telescope Maps 677,000 Stars in Milky Way’s Largest Cluster Core
High-precision infrared tracking uncovers tens of thousands of hidden stars and sets the stage to weigh an elusive central black hole.
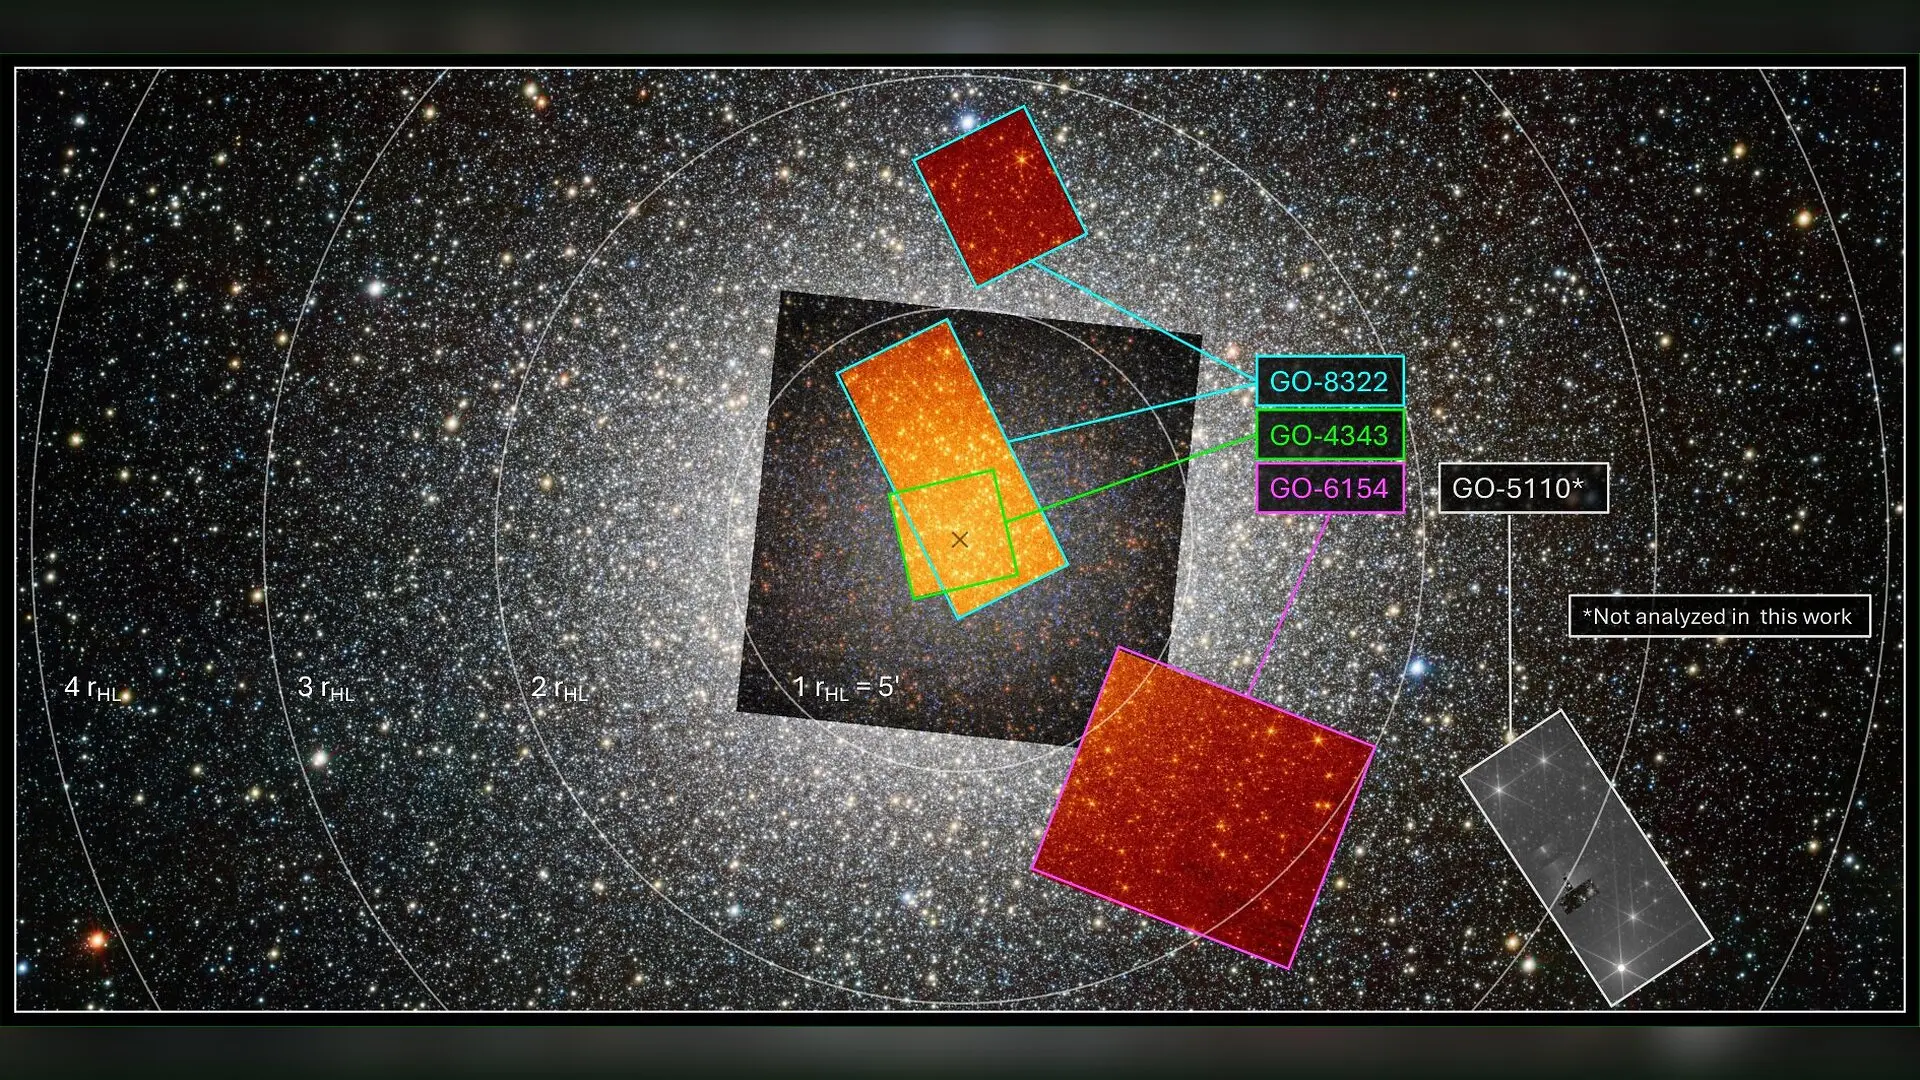
Deep inside Omega Centauri, the most massive globular cluster in the Milky Way, located roughly 17,900 light-years away, thousands of faint stars are being tracked with unprecedented precision. An international team of astronomers has mapped nearly 677,000 stellar sources in and around the cluster’s core, uncovering tens of thousands of previously hidden stars and revealing complex details about its stellar populations.
Omega Centauri (NGC 5139) spans a total mass of about 3.55 million solar masses and is widely considered to be the stripped nucleus of a dwarf galaxy that merged with our Milky Way long ago. Because of this violent history, the cluster serves as a frozen fossil of early galactic evolution and a prime candidate for hosting a central intermediate-mass black hole, an elusive class of black holes with masses between 100 and 100,000 solar masses that help bridge the gap between stellar-mass black holes and supermassive giants.
The research, available as a preprint on the arXiv server, details the creation of the oMEGACat-JWST catalog, combining imaging data gathered across three separate programs using the James Webb Space Telescope. By focusing on near-infrared wavelengths, the space telescope bypassed the thick dust and dense stellar crowding that obscure the cluster’s heart in visible light.
How Sharper Infrared Vision Reveals Hidden Stellar Populations
The core of Omega Centauri is packed so tightly that older telescopes struggled to resolve individual faint stars near brilliant red giants. The authors report that the exceptional angular resolution and sensitivity of the James Webb Space Telescope allowed them to recover over 86,000 new sources that fell below the detection limits of previous Hubble Space Telescope surveys.
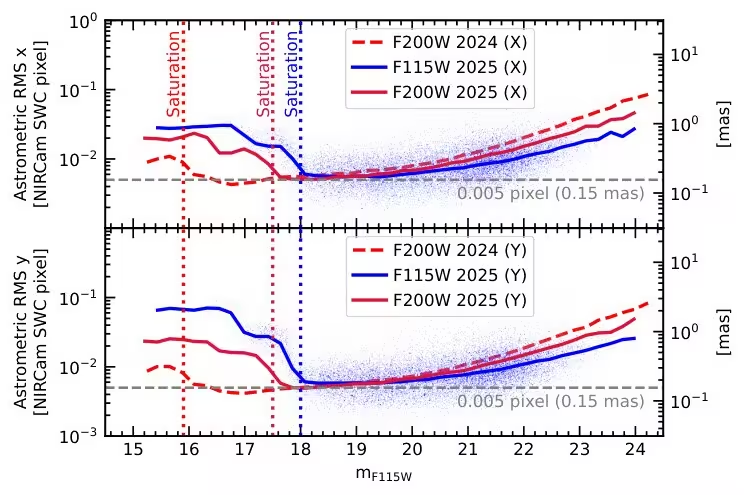
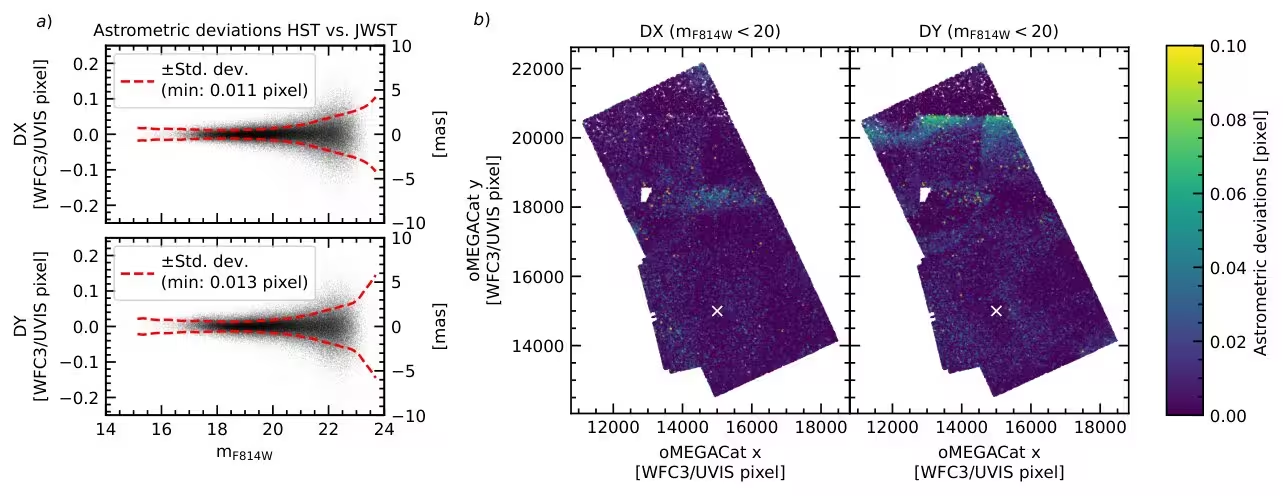
The newly compiled catalog demonstrates a single-image astrometric precision as fine as 0.5 percent of a NIRCam pixel, or roughly 150 microarcseconds, for bright unsaturated stars. Even for faint targets reaching magnitudes around 23, the positional precision remained near one milliarcsecond. By comparing data collected across a one-year baseline, the research team successfully measured the internal velocity dispersion of the cluster, showing that future observations will map individual stellar accelerations with extreme accuracy.
What Color-Magnitude Diagrams Tell Us About Helium and Star Formation
When the researchers plotted color-magnitude diagrams using the new infrared filters, they found remarkably clear splits along the main sequence. These distinct branches reflect multiple stellar generations within the cluster, specifically separating a primordial population from a second population heavily enriched in helium. Elevated helium fractions increase the mean molecular weight of a star, driving up core temperatures and shifting stellar colors toward the blue end of the spectrum.
Furthermore, by cross-matching the infrared data with ultraviolet observations from older Hubble archives, the team constructed hybrid color-magnitude diagrams spanning a massive baseline of wavelengths. These combined charts expose intricate subpopulation tracks, confirming that the cluster contains multiple distinct generations of stars with varying chemical signatures.
What Happens Next in the Hunt for the Cluster Black Hole
The primary driver behind the new observation campaign is the search for definitive dynamical proof of an intermediate-mass black hole lurking in the center of Omega Centauri. Previous Hubble studies identified several fast-moving stars zooming past the cluster center faster than the local escape velocity, a hallmark dynamical sign of a massive central mass.
The authors note that while the current dataset contains only the first set of observations from a multi-cycle monitoring campaign, upcoming epochs scheduled for 2027 and 2028 will provide the temporal baseline needed to track the curved trajectories of these high-speed stars. Accurately measuring their accelerations will allow scientists to weigh the central black hole directly and map its precise location within the ancient star cluster.
The study was posted to the arXiv preprint server on November 17, 2026.
This article has been fact checked for accuracy, with information verified against reputable sources. Learn more about us and our editorial process.
Last reviewed on .
Article history
- Latest version
Reference(s)
- Häberle, Maximilian. “oMEGACat-JWST I.: Project description and photometric data release.” arXiv.org <http://arxiv.org/abs/2611.23150v1>.
Cite this page:
- Posted by Aisha Ahmed