Euclid Releases First Calibration for 170 Million Cosmic Spectra
Astronomy

Euclid Releases First Calibration for 170 Million Cosmic Spectra

Global models and specialized calibration fields ensure high precision for the space mission probing dark energy and dark matter.
By Nida Rehman
Published:
Email this Article
Euclid Releases First Calibration for 170 Million Cosmic Spectra
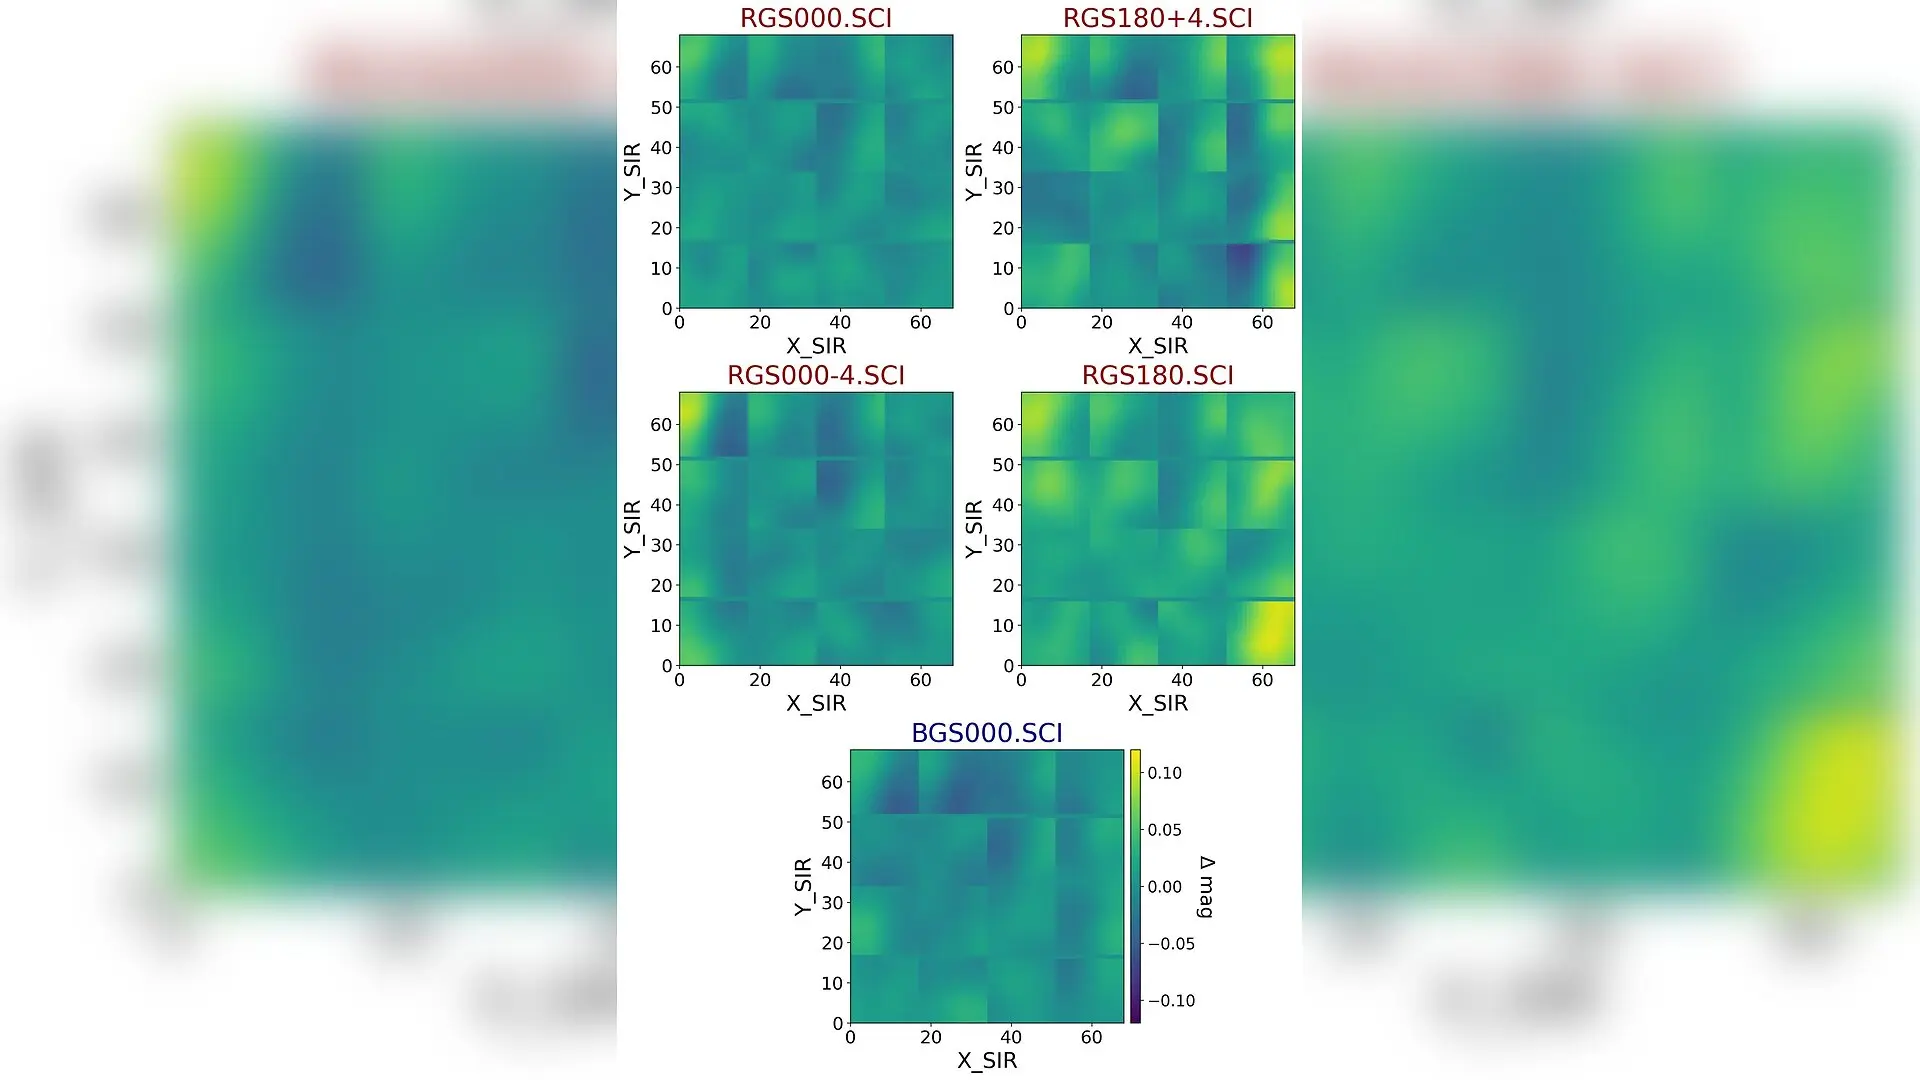
Wavelength-averaged relative flux solutions computed for the different grism configurations over the FP for DR1 (all plots share the same colour scale). Expected features such as vignetting at the edges in the tilted-grism configurations are apparent. Euclid Collaboration et al. / arXiv

Over 170 million cosmic spectra captured by the Euclid space telescope have received their first comprehensive calibration, revealing exceptional precision in mapping the invisible universe. The massive dataset forms the foundation of Euclid Data Release 1, setting a new benchmark for processing slitless spectroscopic observations across a wide area spanning roughly 14,000 square degrees.

The Euclid mission aims to unravel the mysteries of dark energy and dark matter by charting the large-scale structure of the cosmos. To achieve this, the Near-Infrared Spectrometer and Photometer aboard the spacecraft simultaneously collects thousands of spectra without physical slits, a technique that maximizes survey efficiency but introduces significant optical complexities.

How Global Models Overcome Detector Gaps

Because slitless spectroscopy allows light from adjacent sources to overlap and spill across detector boundaries, standard pipeline calibration becomes exceptionally difficult. The processing pipelines, detailed in a study published on the arXiv preprint server, rely on a unified global modeling approach rather than isolated detector corrections. This framework accounts for geometric distortions, dispersion laws, and point spread functions across the entire 16-detector focal plane.
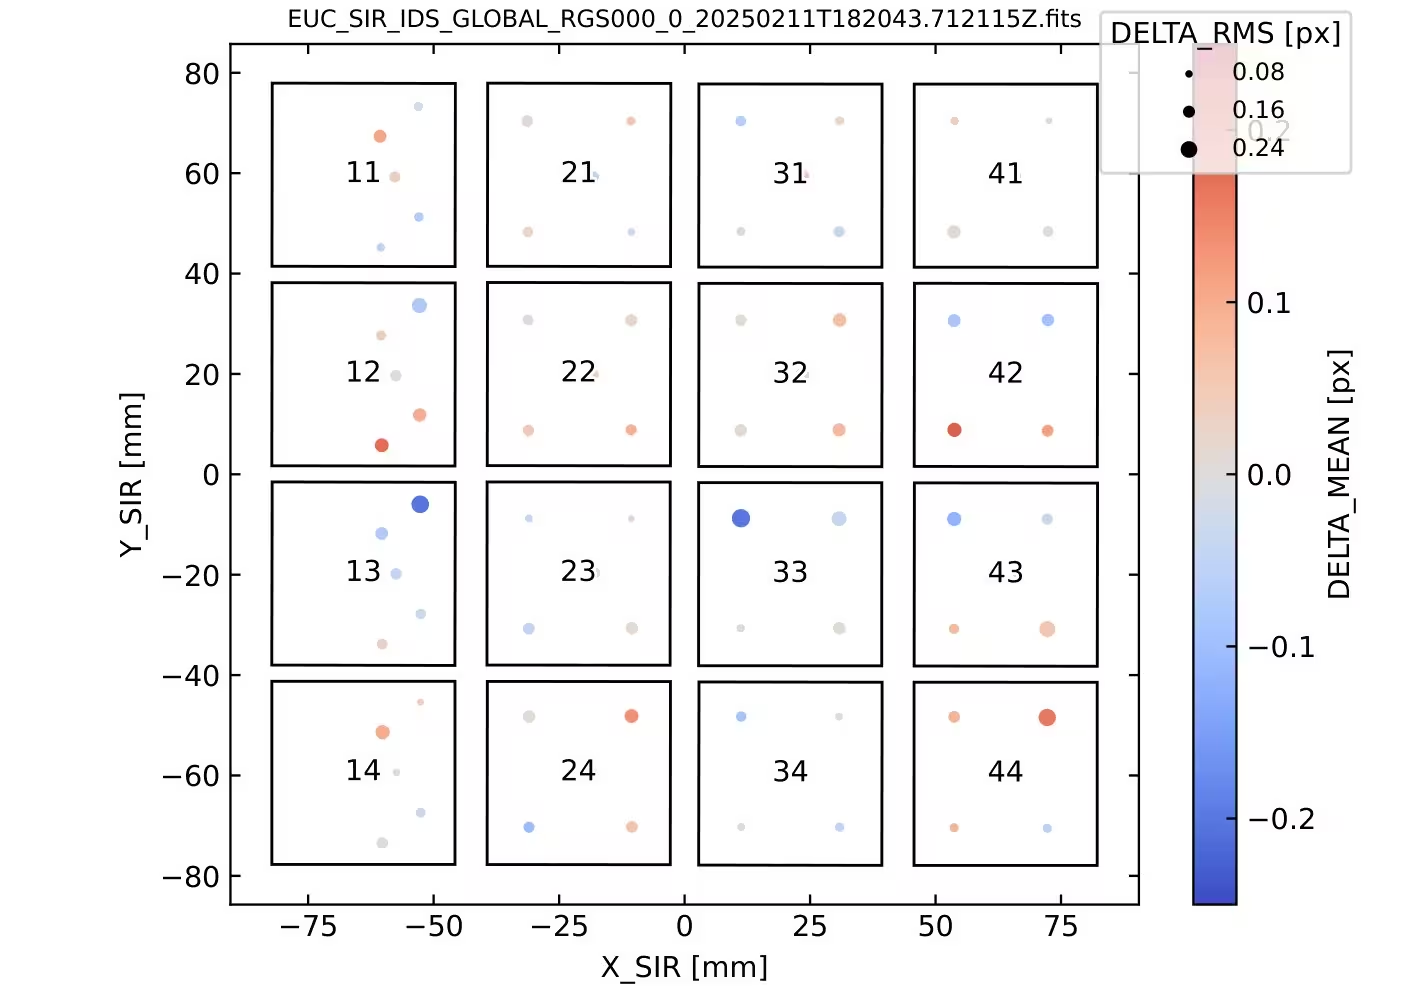
Figure 1: Pattern of observation of the PN in CALBLOCK-PV-009, with five distinct positions on each detector, following a quincunx pattern, for grism-tilt RGS000+0. The target positions across the FP during the 80 acquisitions are shown, along with mean (dot colour) and RMS (dot size) error of the global inverse dispersion solution (IDS), in pixels (see Sect. 5.4). The quincunx patterns on detectors 1x have been ‘compressed’ so that corresponding zeroth-order spectrograms (to the left for RGS000+0) still fit within the FP.
Pattern of observation of the PN in CALBLOCK-PV-009, with five distinct positions on each detector, following a quincunx pattern, for grism-tilt RGS000+0. The target positions across the FP during the 80 acquisitions are shown, along with mean (dot colour) and RMS (dot size) error of the global inverse dispersion solution (IDS), in pixels (see Sect. 5.4). The quincunx patterns on detectors 1x have been ‘compressed’ so that corresponding zeroth-order spectrograms (to the left for RGS000+0) still fit within the FP. Credit: Euclid Collaboration et al. / arXiv

The focal plane itself features physical gaps measuring approximately 6 millimeters and 3 millimeters. Light hitting these inactive regions is still dispersed by the instrument grisms, creating fragmented spectra captured by neighboring sensors. Global mathematical models allow scientists to predict source positions even when they fall within these gaps or outside standard detector footprints.

Calibration Fields and Wavelength Precision

To calibrate these complex observations, the collaboration utilized dedicated performance-verification fields containing well-characterized astronomical targets. Observations of a compact planetary nebula provided nearly 80 dithered positions per grism configuration, establishing a robust wavelength solution. Researchers tracked emission lines across the near-infrared spectrum, ensuring that positional residuals remained below the stringent mission requirement of 0.3 pixels.

Spectro-photometric calibrations further converted instrumental signals into calibrated astrophysical units. By analyzing repeated observations of bright calibration stars, the team constructed relative flux models to correct large-scale transmission variations caused by optical throughput and vignetting. Absolute flux calibration utilized white dwarf standards to establish accurate sensitivity functions across all grism configurations.
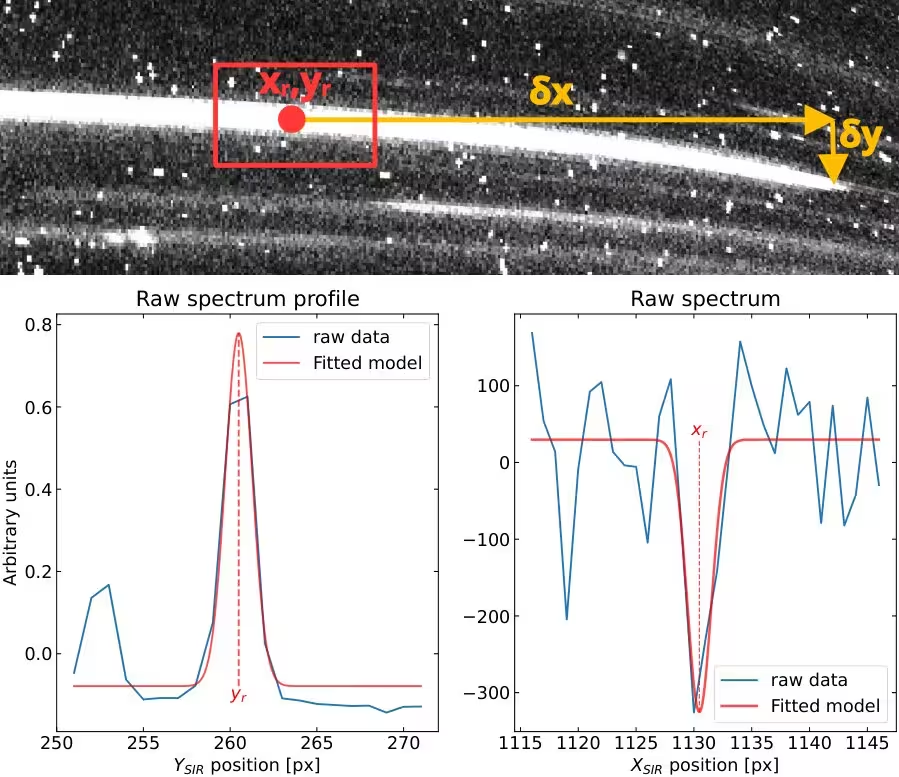
Figure 2: Illustration of the OPT and CRV spectrometric models, jointly used to describe the spectrogram geometry. Upper panel: a raw spectrogram, with an artificially enhanced curvature to facilitate the visualisation of the geometric distortions. The red box is the area selected by the OPT calibration to compute the (xr,yr)(x_{\text{r}},y_{\text{r}}) spectrogram reference position (red dot); cross-dispersion offset δ​y\delta y as a function of along-dispersion distance δ​x\delta x (yellow arrows) allow the characterisation of the spectrogram tilt and distortions. Lower left panel: the yry_{\text{r}} coordinate is determined by fitting the cross-dispersion profile averaged over the red box along the dispersion axis. A similar procedure is used to measure δ​y\delta y along the trace (Sect. 3.3). Lower right panel: the xrx_{\text{r}} position is derived by fitting reference absorption spectral feature (here Mg I, see text) of the raw spectrum obtained by summing the red box along the cross-disper
Illustration of the OPT and CRV spectrometric models, jointly used to describe the spectrogram geometry. Upper panel: a raw spectrogram, with an artificially enhanced curvature to facilitate the visualisation of the geometric distortions. The red box is the area selected by the OPT calibration to compute the (xr,yr)(x_{\text{r}},y_{\text{r}}) spectrogram reference position (red dot); cross-dispersion offset δ​y\delta y as a function of along-dispersion distance δ​x\delta x (yellow arrows) allow the characterisation of the spectrogram tilt and distortions. Lower left panel: the yry_{\text{r}} coordinate is determined by fitting the cross-dispersion profile averaged over the red box along the dispersion axis. A similar procedure is used to measure δ​y\delta y along the trace (Sect. 3.3). Lower right panel: the xrx_{\text{r}} position is derived by fitting reference absorption spectral feature (here Mg I, see text) of the raw spectrum obtained by summing the red box along the cross-disper Credit: Euclid Collaboration et al. / arXiv

Addressing Limitations and Preparing for Future Releases

Despite meeting primary mission requirements, the evaluation identified minor areas for future optimization. Ground-based metrology did not fully reflect the thermal and mechanical configuration experienced in flight, leading to slight residual patterns at individual detector edges. Additionally, grating-wheel positioning jitter introduced small uncertainties into the dispersion direction.

Planned improvements for the upcoming Data Release 2 include dedicated calibration pipelines for detector metrology, advanced stabilization techniques to prevent unphysical polynomial oscillations, and refined emission-line centroiding. These enhancements will minimize systematic uncertainties, ensuring that subsequent data releases reach the full scientific potential of the mission.

The study was posted to the arXiv preprint server on November 12, 2026.

Fact Checked

This article has been fact checked for accuracy, with information verified against reputable sources. Learn more about us and our editorial process.

Last reviewed on .

Article history

  • Latest version

Reference(s)

  1. Collaboration, Euclid. “Euclid data release 1 (DR1) - SIR spectroscopic calibration.” arXiv.org <http://arxiv.org/abs/2611.17305v1>.

Cite this page:

Rehman, Nida. “Euclid Releases First Calibration for 170 Million Cosmic Spectra.” BioScience. BioScience ISSN 2521-5760, 13 November 2026. <https://www.bioscience.com.pk/en/subject/astronomy/euclid-data-release-1-dr1-sir-spectroscopic-calibration>. Rehman, N. (2026, November 13). “Euclid Releases First Calibration for 170 Million Cosmic Spectra.” BioScience. ISSN 2521-5760. Retrieved November 13, 2026 from https://www.bioscience.com.pk/en/subject/astronomy/euclid-data-release-1-dr1-sir-spectroscopic-calibration Rehman, Nida. “Euclid Releases First Calibration for 170 Million Cosmic Spectra.” BioScience. ISSN 2521-5760. https://www.bioscience.com.pk/en/subject/astronomy/euclid-data-release-1-dr1-sir-spectroscopic-calibration (accessed November 13, 2026).
End of the article