Solar Magnetic Trap Crushes Rising Plasma Filament in Rare Multi-Instrument Observation
Astronomy

Solar Magnetic Trap Crushes Rising Plasma Filament in Rare Multi-Instrument Observation

New solar physics observations reveal how a powerful overlying magnetic cage halted an eruption and forced external reconnection to dismantle the trapped structure.
By Nida Rehman
Published:
Email this Article
Solar Magnetic Trap Crushes Rising Plasma Filament in Rare Multi-Instrument Observation
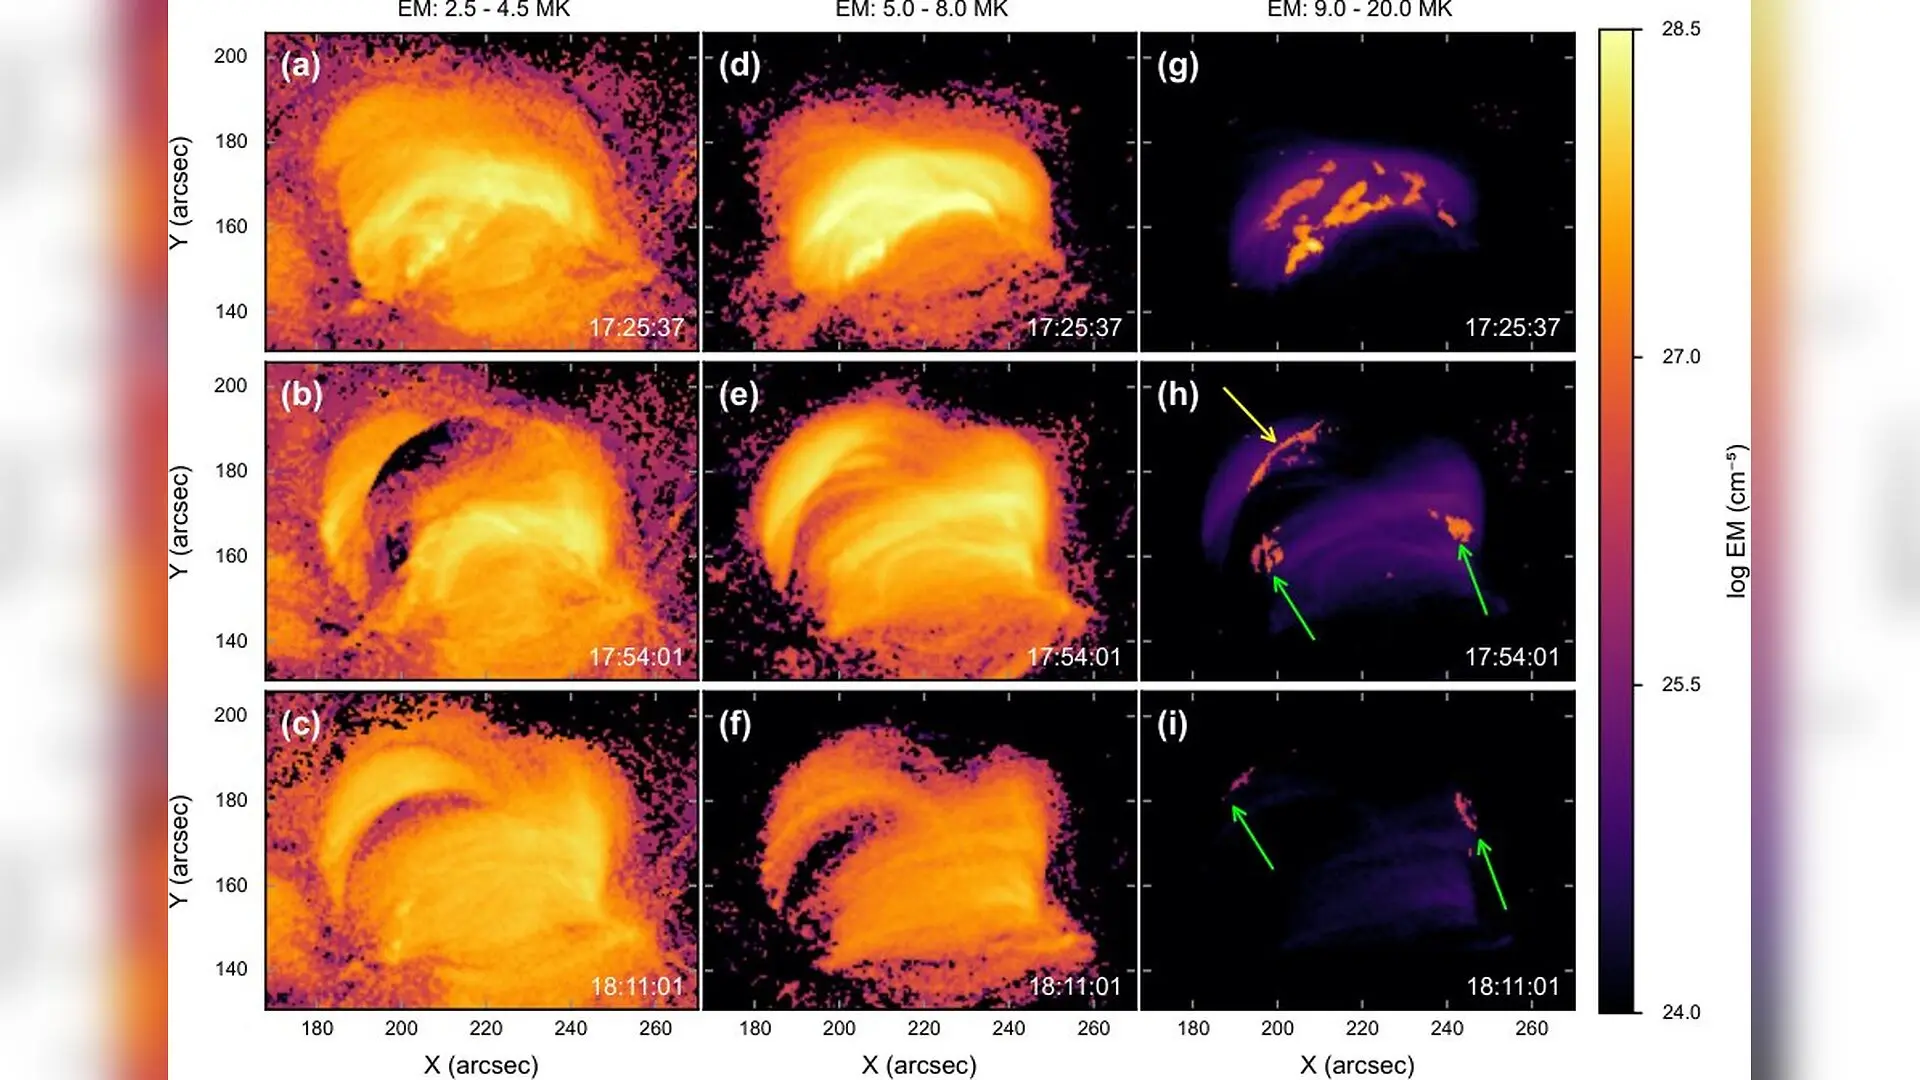
Thermal evolution during the failed eruption. The maps show log10⁡[EM/(cm−5)]\log_{10}[\mathrm{EM}/(\mathrm{cm}^{-5})], with the EM calculated by integrating the DEM over 2.5–4.5 MK in (a)–(c), 5.0–8.0 MK in (d)–(f), and 9.0–20.0 MK in (g)–(i). The rows correspond to 17:25:37, 17:54:01, and 18:11:01 UT. The yellow arrow in (h) marks the narrow, unusually hot structure at the F–L1 interface that is consistent with the inferred external reconnection current sheet. The green arrows in (h) and (i) mark compact high-temperature enhancements near the projected footpoints of the loop systems associated with the filament and the overlying or reconnected fields. The accompanying animation covers approximately 17:10:01–18:29:49 UT. Yudi Ou et al. / arXiv

A colossal magnetic cage on the Sun trapped a rising filament of plasma and crushed it against overlying loops on May 23, 2015, triggering an unexpected chain of events that heated a massive active region. The failed eruption, which researchers analyzed using high-resolution ground-based and spaceborne instruments, reveals how magnetic confinement can actively dismantle trapped solar structures rather than simply halting them.

Solar eruptions typically start when bundles of twisted magnetic field lines called flux ropes destabilize and burst into space. However, many events fail to escape, leaving the cool plasma to drain back down to the solar surface. In the May 2015 event within NOAA Active Region 12353, two smaller filamentary structures merged in the lower atmosphere through internal reconnection, forming a single elongated filament with an initial upward speed of roughly 28.7 kilometers per second. As the structure accelerated, modeling published in arXiv indicates that its core entered a regime susceptible to kink instability, where magnetic twists become dangerously high.

Why Did This Solar Eruption Fail to Escape

Despite its initial upward push, the rising flux rope slammed into a much larger, pre-existing system of coronal loops known as L1. The overlying magnetic field was exceptionally strong and asymmetric, exerting a powerful downward restraint that caused the filament to decelerate and stall completely. Rather than ending the activity, this heavy containment set the stage for a violent interaction.
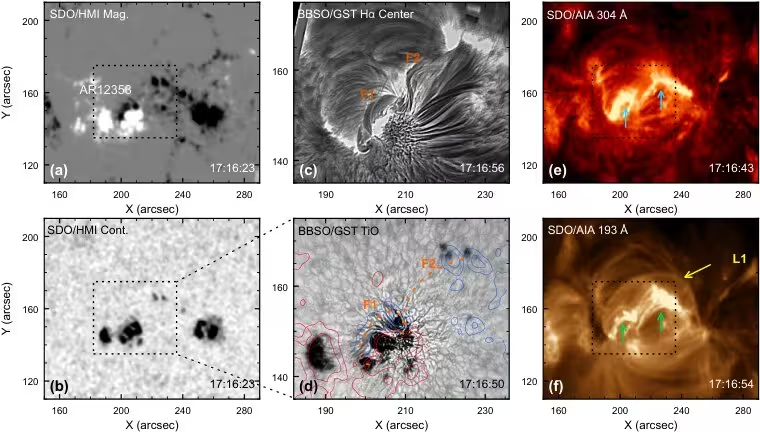
Figure 1: Multiwavelength overview of the source region. (a) HMI line-of-sight magnetogram. (b) HMI continuum image. The black dotted boxes in (a), (b), (e), and (f) outline the core region observed by GST. (c) GST Hα\alpha line-center image showing the filamentary structures F1 and F2. (d) GST TiO image overlaid with HMI line-of-sight magnetic field contours at ±200\pm 200 and ±600\pm 600 G. Red and blue contours represent positive and negative magnetic fields, respectively, and the orange dashed curves mark the projected locations of F1 and F2 identified in (c). (e) AIA 304 Å image. The blue arrows mark bright structures above the GST filament region. (f) AIA 193 Å image. The green arrows mark bright coronal loops, and the yellow arrow indicates the larger-scale overlying loop system L1.
Multiwavelength overview of the source region. (a) HMI line-of-sight magnetogram. (b) HMI continuum image. The black dotted boxes in (a), (b), (e), and (f) outline the core region observed by GST. (c) GST Hα\alpha line-center image showing the filamentary structures F1 and F2. (d) GST TiO image overlaid with HMI line-of-sight magnetic field contours at ±200\pm 200 and ±600\pm 600 G. Red and blue contours represent positive and negative magnetic fields, respectively, and the orange dashed curves mark the projected locations of F1 and F2 identified in (c). (e) AIA 304 Å image. The blue arrows mark bright structures above the GST filament region. (f) AIA 193 Å image. The green arrows mark bright coronal loops, and the yellow arrow indicates the larger-scale overlying loop system L1. Credit: Yudi Ou et al. / arXiv

As the rising rope pressed continuously against the overlying loops, the intervening boundary narrowed into a razor-thin layer. This persistent compression created optimal conditions for current sheet formation and external magnetic reconnection. The authors report that the external reconnection stripped magnetic flux away from the trapped rope, systematically eroding its coherent structure and causing the main filament body to fade from view.

How Magnetic Reconnection Heated the Solar Corona

To understand the thermal aftermath of this trapped collision, the research team performed a differential emission measure analysis to track plasma temperatures across the active region. Before the eruption, localized high-temperature patches marked the lower-atmosphere merging process. Once external reconnection engaged at the upper boundary, a scorching, ultra-thin structure reaching between 9.0 and 20.0 million degrees Celsius flashed at the interface.
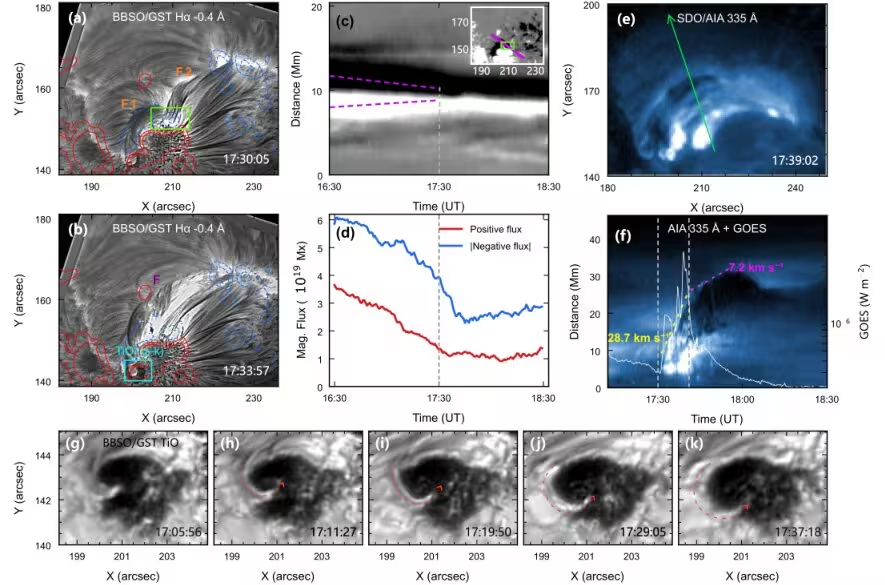
Figure 2: Formation, magnetic evolution, and initial rise of filament F. (a)–(b) GST Hα\alpha −0.4-0.4 Å images showing F1 and F2 merging into F, overlaid with HMI line-of-sight magnetic field contours. Red and blue contours represent positive and negative magnetic fields, respectively. The green box in (a) marks the localized brightening, and the cyan box in (b) outlines the eastern footpoint region enlarged in (g)–(k). (c) HMI time-distance map along the purple slit shown in the inset. The purple dashed lines trace the converging opposite-polarity magnetic features. (d) Positive magnetic flux and the absolute value of the negative magnetic flux within the green box in the inset of (c). (e) AIA 335 Å image of the rising F. (f) Time-distance map along the green arrow in (e), overlaid with the GOES 1–8 Å soft X-ray flux. The colored dashed lines trace the two rising phases, and the vertical dashed lines mark the duration of the C2.3 flare. (g)–(k) Enlarged GST TiO images showing the apparent coun
Formation, magnetic evolution, and initial rise of filament F. (a)–(b) GST Hα\alpha −0.4-0.4 Å images showing F1 and F2 merging into F, overlaid with HMI line-of-sight magnetic field contours. Red and blue contours represent positive and negative magnetic fields, respectively. The green box in (a) marks the localized brightening, and the cyan box in (b) outlines the eastern footpoint region enlarged in (g)–(k). (c) HMI time-distance map along the purple slit shown in the inset. The purple dashed lines trace the converging opposite-polarity magnetic features. (d) Positive magnetic flux and the absolute value of the negative magnetic flux within the green box in the inset of (c). (e) AIA 335 Å image of the rising F. (f) Time-distance map along the green arrow in (e), overlaid with the GOES 1–8 Å soft X-ray flux. The colored dashed lines trace the two rising phases, and the vertical dashed lines mark the duration of the C2.3 flare. (g)–(k) Enlarged GST TiO images showing the apparent coun Credit: Yudi Ou et al. / arXiv

Simultaneously, widespread active region heating lit up two massive loop systems with temperatures ranging from 5.0 to 8.0 million degrees Celsius. Compact high-temperature sources also appeared near the footpoints of the magnetic loops. The researchers interpret these footpoint brightenings as the signature of energetic particles accelerated at the reconnection site, which then cascaded down the newly connected magnetic field lines to dump their kinetic energy into the dense lower atmosphere.

What This Means for Predicting Space Weather

These findings demonstrate that external magnetic reconnection does more than just determine whether an eruption successfully launches into space. When a strong overlying cage suppresses an eruption, the resulting prolonged compression can force external reconnection to tear apart the trapped magnetic structure while redistributing its magnetic energy across vast swaths of the Sun’s corona. The authors conclude that factoring in the three-dimensional geometry and strength of surrounding magnetic cages is essential for understanding the full lifecycle of solar storms.

The study was posted to the arXiv preprint server on November 11, 2026.

Fact Checked

This article has been fact checked for accuracy, with information verified against reputable sources. Learn more about us and our editorial process.

Last reviewed on .

Article history

  • Latest version

Cite this page:

Rehman, Nida. “Solar Magnetic Trap Crushes Rising Plasma Filament in Rare Multi-Instrument Observation.” BioScience. BioScience ISSN 2521-5760, 13 November 2026. <https://www.bioscience.com.pk/en/subject/astronomy/a-failed-filament-eruption-and-associated-active-region-heating-driven-by-external-magnetic-reconnection>. Rehman, N. (2026, November 13). “Solar Magnetic Trap Crushes Rising Plasma Filament in Rare Multi-Instrument Observation.” BioScience. ISSN 2521-5760. Retrieved November 13, 2026 from https://www.bioscience.com.pk/en/subject/astronomy/a-failed-filament-eruption-and-associated-active-region-heating-driven-by-external-magnetic-reconnection Rehman, Nida. “Solar Magnetic Trap Crushes Rising Plasma Filament in Rare Multi-Instrument Observation.” BioScience. ISSN 2521-5760. https://www.bioscience.com.pk/en/subject/astronomy/a-failed-filament-eruption-and-associated-active-region-heating-driven-by-external-magnetic-reconnection (accessed November 13, 2026).
End of the article