Medically reviewed and approved by a board-certified member
Hemotology
TERMINOLOGIES USED IN FLOWCYTOMETRY
By Dayyal Dg.Twitter Profile | Updated: Monday, 31 July 2017 11:13 UTC

Fluorescence
A fluorochrome absorbs light energy and emits excess energy in the form of photon light (fluorescence). Fluorescence is the property of molecules to absorb light at one wavelength and emit light at a longer wavelength. The fluorescent dyes commonly used in flow cytometry are fluorescein isothiocyanate (FITC) and phycoerythrin (PE). The fluorochrome-labeled antibodies are used for detection of antigenic markers on the surface of cells. A particular cell type can be identified on the basis of the antigenic profile expressed. Multiple fluorochromes can be used to identify different cell types in a mixed population of cells.
Light Scatter
Light is scattered when the incident light is deflected by a particle traversing through a beam of light. This depends on the physical properties of the cell. Two forms of light scatter are used to identify different cell types: forward scatter and side scatter. Forward scatter (light scattered in the same direction as the laser beam) is related to cell size. Side scatter (light scattered at a 90° angle to the laser beam) is related to internal granularity of the cell. Main subpopulations of leukocytes are identified on the basis of correlated measurements of forward and side scatters. When a cell passes through laser beam, side scatter and fluorescent signals that are emitted by the cell are directed to photomultiplier tubes, while the forward scatter signals are directed to a photodiode. Photomultiplier tubes and photodiodes are called as detectors. Optical filters are placed before the detectors that allow only a narrow range of wavelengths to reach the detectors (see Figure 806.1).
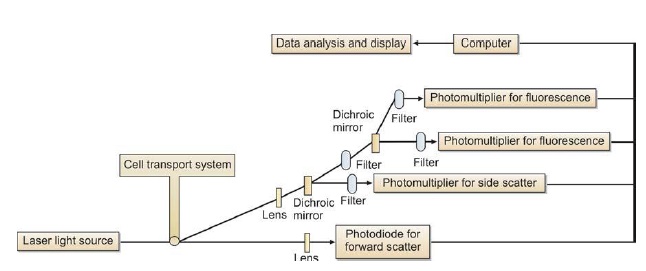
Figure 806.1 Principle of working of a flow cytometer
Data Analysis
The data collected and stored in the computer can be displayed in various formats. A parameter means forward scatter, or side scatter, or emitted fluorescence from a particle as it passes through a laser beam. A histogram is a data plot of a single parameter, with the parameter’s signal value in channel numbers or relative fluorescence intensity on X-axis (horizontal axis) and number of events on the Y-axis. A dot plot is a two parameter data graph in which each dot represents one event that the flow cytometer analyzed; one parameter is displayed on the X-axis and the other on the Y-axis. A 3-D plot represents one parameter on X-axis, another parameter on Y-axis, and number of events per channel on Z-axis.
Gating
A gate is a boundary that can be set to restrict the analysis to a specific population within the sample. For example, a gate boundary can be drawn on a dot plot or histogram to restrict the analysis only to cells with the size of lymphocytes. Gates can be inclusive (selection of events that fall within the boundary) or exclusive (selection of events that fall outside the boundary). Data selected by the gate is then displayed in subsequent plots.
Sorting
Usually, when a cell passes through the laser beam, it is sent to waste. Sorting consists of collecting cells of interest (defined through criteria of size and fluorescence) for further analysis (such as microscopy or functional or chemical analysis). Sorting feature is available only in some flow cytometers.
- Comment
- Posted by Dayyal Dg.
Tags:
End of the article