Medically reviewed and approved by a board-certified member
Cell Biology
Red Cell Indices
By Dayyal Dg.Twitter Profile | Updated: Tuesday, 25 July 2017 06:20 UTC
Red Cell Indices
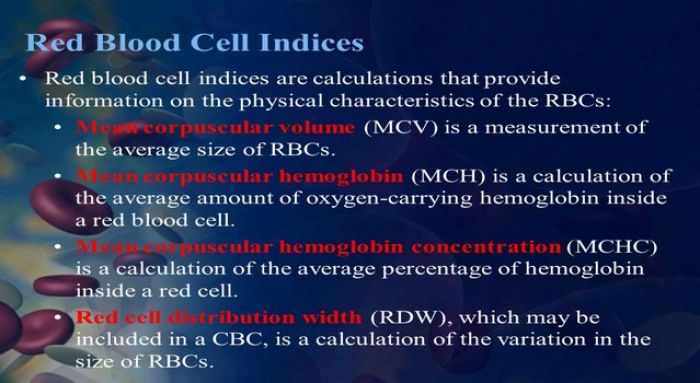
Red cell indices are mean cell volume (MCV), mean cell hemoglobin (MCH), and mean cell hemoglobin concentration (MCHC). They are also called as “absolute values”. They are derived from the values of hemoglobin, packed cell volume (PCV or hematocrit), and red cell count. Red cell indices are accurately measured by automated hematology analyzers. Recently, a new parameter called red cell distribution width (RDW) has been introduced.
USES OF RED CELL INDICES
(1) Morphological classification of anemia: Based on values of red cell indices, anemia is classified into three main types: normocytic normochromic, microcytic hypo-chromic, and macrocytic normo-chromic. Calculation of red cell indices is especially helpful in mild or moderate anemia when red cell changes are subtle and often difficult to appreciate on stained blood smear.
(2) Differentiation of iron deficiency anemia from thalassemia trait: In iron deficiency, MCV, MCH, and MCHC are low, while in thalassemia trait, MCV and MCH are low and MCHC is normal.
(2) Differentiation of iron deficiency anemia from thalassemia trait: In iron deficiency, MCV, MCH, and MCHC are low, while in thalassemia trait, MCV and MCH are low and MCHC is normal.
MEAN CELL VOLUME
MCV is a measure of average size of the red cells. It is measured directly by automated instruments from the measurement of volume of each red cell. With semiautomated instruments and by manual method, it is obtained by dividing PCV by red cell count.
MCV = PCV in% x 10
RBC count in million/cmm
RBC count in million/cmm
MCV is expressed in femtoliters or fl (10⁻¹⁵ of a liter). It corresponds with red cell diameter on blood smear. Normal MCV is 80-100 fl.
Causes of Increased MCV
• Megaloblastic anemia
• Non-megaloblastic macrocytosis: Chronic alcoholism, liver disease, hypothyroidism, normal pregnancy, reticulocytosis
• Newborns.
• Non-megaloblastic macrocytosis: Chronic alcoholism, liver disease, hypothyroidism, normal pregnancy, reticulocytosis
• Newborns.
Causes of Low MCV
• Microcytic hypochromic anemia
MCV is normal in normocytic normochromic anemia (acute blood loss, hemolysis, aplastic anemia).
In the presence of large number of abnormal red cells like sickle cells, and in dimorphic anemia (e.g. mixed normocytic and microcytic), MCV may be normal (since it is an average value) and thus unreliable for morphological classification.
Mentzer index is derived by dividing MCV with red cell count. Ratio of less than 13 is seen in thalassemia while ratio is more than 13 in iron deficiency anemia.
MEAN CELL HEMOGLOBIN (MCH)
MCH is the average amount of hemoglobin in a single red cell. It is obtained by dividing hemoglobin value by red cell count.
MCH = Hemoglobin in grams/dl x 10
RBC count in millions/cmm
RBC count in millions/cmm
MCH is expressed in picograms or pg (10⁻¹² gram). Reference range is 27-32 pg.
MCH is decreased in microcytic hypochromic anemia, and increased in macrocytic anemia and in newborns.
MCH is decreased in microcytic hypochromic anemia, and increased in macrocytic anemia and in newborns.
MEAN CELL HEMOGLOBIN CONCENTRATION (MCHC)
MCHC is obtained by dividing hemoglobin value by PCV and expressed in grams/dl or grams/liter. It refers to concentration of hemoglobin in 1 dl or 1 liter of packed red cells.
MCHC = Hemoglobin in grams/dl x 100
PCV in %
PCV in %
Reference range is 30-35 grams/dl. MCHC is raised in hereditary spherocytosis, and is decreased in hypochromic anemia. MCHC corresponds with degree of hemoglobinization of red cells on a blood smear. If MCHC is normal, red cell is normochromic, and if low, red cell is hypochromic.
Red Cell Distribution Width (RDW)
Some automated analyzers measure red cell distribution width or RDW. It is a measure of degree of variation in red cell size (anisocytosis) in a blood sample. It is helpful in differential diagnosis of some anemias. Amongst microcytic anemias, RDW is low in ß thalassemia trait, high in iron deficiency anemia, and normal in anemia of chronic disease. Normal RDW is 9.0 to 14.5.
REFERENCE RANGES
• Mean cell volume: 80-100 fl
• Mean cell hemoglobin: 27-32 pg
• Mean cell hemoglobin concentra-tion: 30-35 g/dl
• Red cell distribution width: 9.0-14.5
• Mean cell hemoglobin: 27-32 pg
• Mean cell hemoglobin concentra-tion: 30-35 g/dl
• Red cell distribution width: 9.0-14.5
REFERENCES
1. Henry JB. Clinical diagnosis and management by laboratory methods (20th Ed). Philadelphia: WB Saunders Company, 2001.
2. Wallach J. Interpretation of Diagnostic Tests (7th Ed). Philadelphia: Lippincott Williams and Wilkins, 2000⁻¹⁵
- Comment
- Posted by Dayyal Dg.
End of the article