Delta Checks in the Clinical Laboratory
Delta checks compare current and prior lab results to detect unexpected changes, specimen errors, and true clinical shifts. Based on biological variation and reference change value, they serve as a patient-based quality safeguard in modern laboratories.
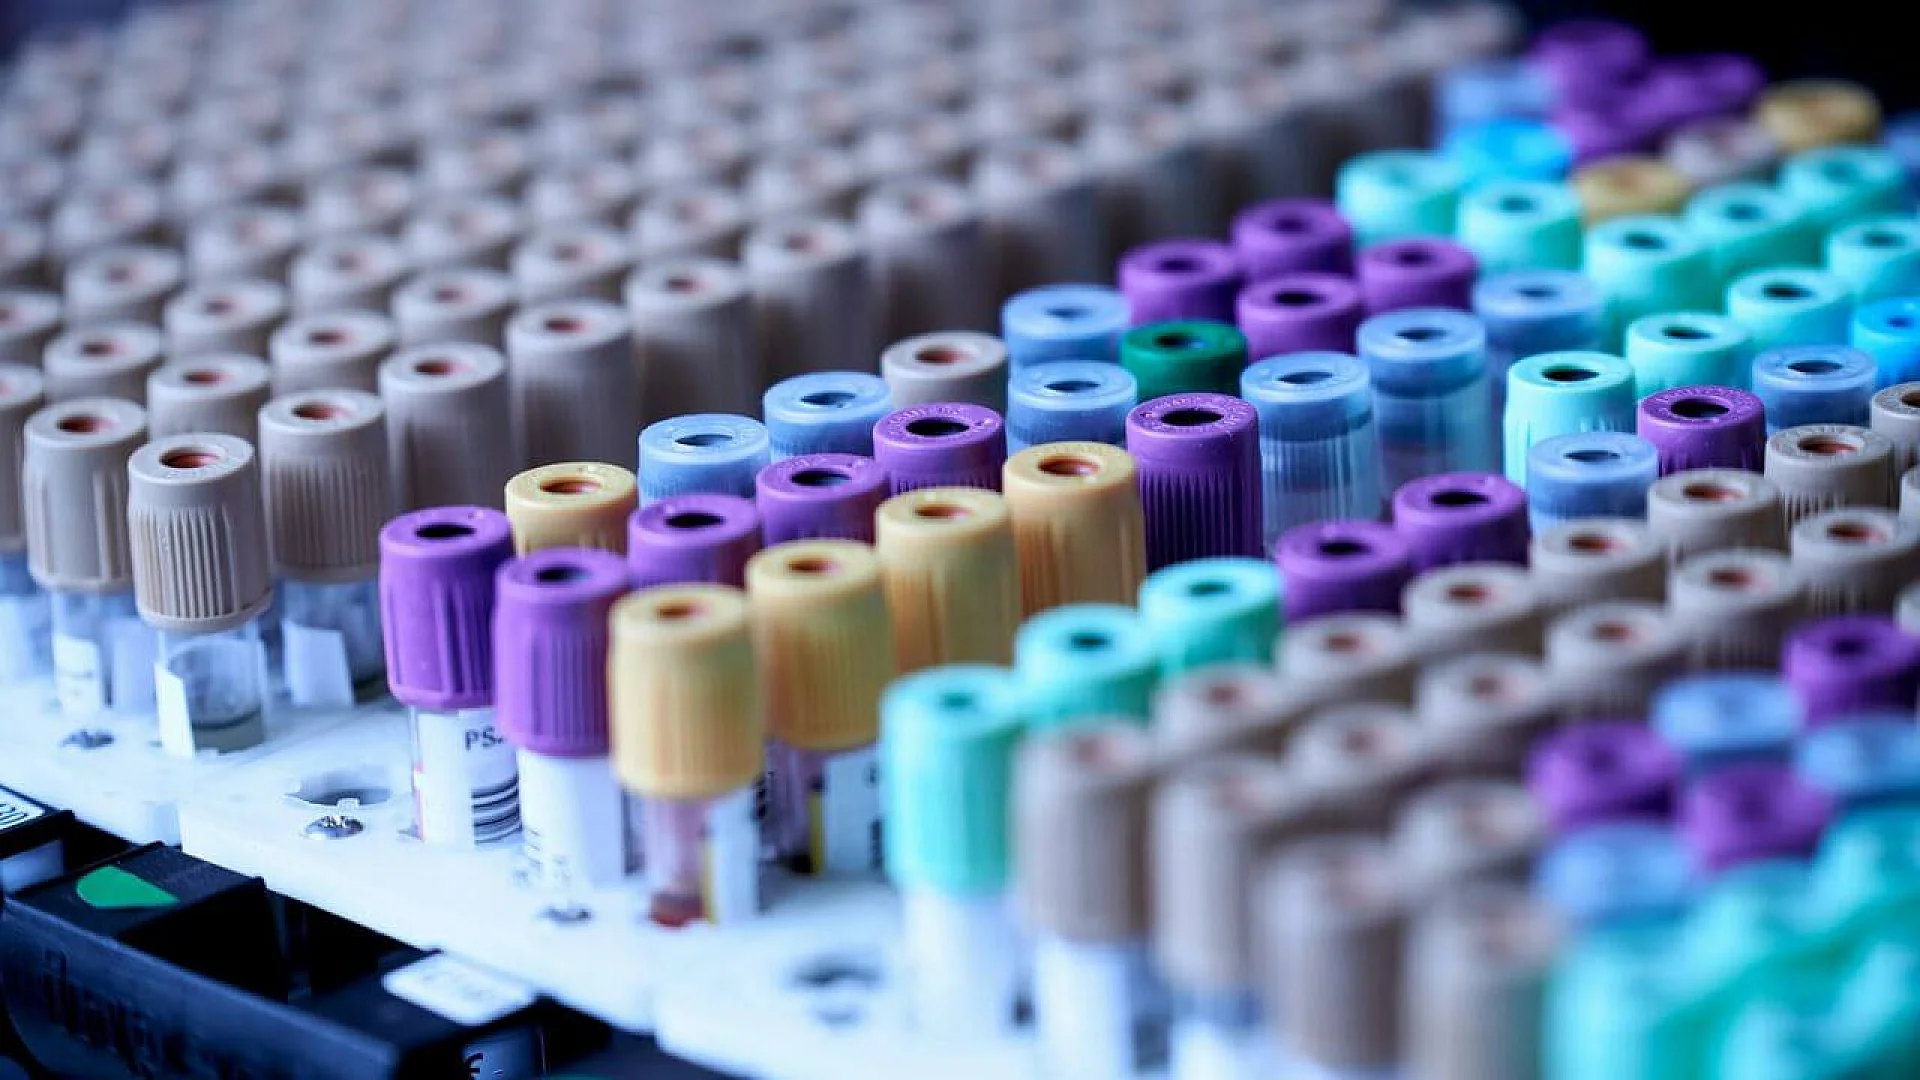
In routine laboratory practice, a delta check refers to the comparison of a patient’s current test result with one or more of their previous results. The comparison is always within the same individual. We are not comparing to reference ranges here. We are comparing the patient to themselves.
This concept may sound simple, but it is extremely powerful.
Every person has a certain biological stability. Hemoglobin does not usually drop 3 g/dL in a few hours without a reason. Serum sodium does not jump from 138 mmol/L to 160 mmol/L overnight in a stable patient. When such changes appear, they demand attention.
A delta check is designed to detect:
- Unexpected changes
- Clinically implausible shifts
- Analytically improbable differences
In practical terms, it functions as a patient-based quality assurance tool. Instead of only monitoring instruments with internal QC materials, we monitor the patient’s own data pattern. The patient becomes part of the quality control system.
This is especially useful in detecting:
- Specimen mislabeling
- Wrong patient sampling
- Data entry errors
- Significant but real clinical deterioration
As laboratory professionals working at the bench, we often focus on analyzer flags and control charts. However, delta checks add another layer. They ask a simple but critical question: does this result make sense for this patient?
That question protects both the laboratory and the patient.
Historical Development
Delta checks did not begin as automated rules inside modern Laboratory Information Systems. In earlier hematology laboratories, technologists manually reviewed previous reports when something looked unusual.
For example, if a hemoglobin value appeared unexpectedly low, the technologist would physically retrieve prior records and compare results. This was time-consuming, but it was part of careful laboratory practice.
As laboratory workloads increased and automation expanded, manual comparison became impractical. With the development of Laboratory Information Systems, delta check rules were gradually integrated into software platforms.
Now, most LIS platforms can:
- Automatically retrieve prior results
- Calculate absolute or percentage changes
- Apply predefined thresholds
- Hold or release results based on those rules
Over time, the methodology also evolved. Early delta limits were often based on experience and intuition. A senior technologist might say, “More than 2 g/dL change in hemoglobin within 24 hours should be checked.”
Today, we move toward statistically derived models. Concepts such as biological variation and reference change value are used to define more scientifically justified limits. This shift has improved both sensitivity and specificity.
So the evolution of delta checks reflects the broader evolution of laboratory medicine itself. We moved from manual observation, to automated comparison, and now toward data-driven, statistically grounded quality systems.
For laboratory technicians, understanding this framework is important. When a delta flag appears on the screen, it is not just a software alert. It represents decades of development in clinical pathology and quality control, all focused on one goal: ensuring that every reported result truly belongs to the right patient and accurately reflects their clinical condition.
Scientific Basis of Delta Checks
Delta checks are not just software rules inside the LIS. They are built on solid statistical and biological principles. If we do not understand these principles, we risk setting limits that are either too strict or too loose.
As laboratory technicians, when we see a delta flag, we should know what science is working behind that alert.
Biological Variation
Every analyte in the human body fluctuates naturally. Even in healthy individuals, laboratory values are not fixed numbers. They move slightly from day to day. This movement is called biological variation.
Understanding biological variation is essential when designing or interpreting delta checks.
Within-Subject Biological Variation (CVi)
Within-subject biological variation refers to the normal fluctuation of a test result in the same person over time.
For example, a patient’s hemoglobin may vary slightly due to hydration status. Serum potassium may change a little depending on diet or minor physiological shifts. These small changes are normal.
CVi helps us answer an important question:
How much change is expected in this patient, even if nothing is wrong?
If we ignore CVi and set very tight delta limits, we will generate excessive flags. On the other hand, if we allow too wide a range, we may miss significant errors.
So CVi forms the foundation for expected stability in delta check systems.
Between-Subject Biological Variation (CVg)
Between-subject variation refers to differences among individuals in a population.
For example, one healthy person may naturally have a hemoglobin of 12.5 g/dL, while another consistently runs at 15.0 g/dL. Both are normal for them.
CVg is more relevant when establishing reference intervals. It is less directly used in delta checks because delta checks compare a patient to themselves, not to others.
Still, understanding CVg reminds us that each patient has their own biological baseline. And that baseline matters.
Analytical Variation
Even if a patient’s biological state remains stable, laboratory instruments introduce some degree of variation. No analyzer is perfectly precise.
This variation must be considered when setting delta check thresholds.
Analytical Imprecision (CVa)
Analytical imprecision, often expressed as CVa, represents the variability introduced by the method and instrument.
For example:
- Pipetting variation
- Reagent lot differences?
- Instrument drift
- Minor calibration shifts
If a test has high imprecision, we expect slightly larger fluctuations in repeated measurements. Therefore, delta limits for that analyte must account for this reality.
Ignoring CVa can lead to unnecessary delta flags. That increases workload and may cause alert fatigue.
From a quality control perspective, CVa connects internal QC performance directly with delta check reliability.
Total Allowable Error (TEa)
Total allowable error represents the maximum error that is clinically acceptable for a test result.
It combines imprecision and bias into a single performance goal. Regulatory bodies and accreditation standards often define TEa limits for various analytes.
While TEa is not the same as a delta check limit, it influences how strict our monitoring systems should be.
If a method operates close to its TEa boundary, we may need tighter oversight. If the method performs with excellent precision and low bias, delta limits may be more confidently defined using biological data.
Reference Change Value (RCV)
The Reference Change Value is one of the most scientifically sound tools for delta check design.
Instead of choosing an arbitrary percentage or fixed number, RCV uses statistics to determine whether a change is significant.
Statistical Formula and Components
RCV incorporates both:
- Analytical variation (CVa)
- Within-subject biological variation (CVi)
The general concept involves calculating a threshold that exceeds expected random variation, often using a Z-score corresponding to a selected confidence level.
In simple terms, RCV answers this:
Is the difference between two results greater than what we would expect from normal biological fluctuation plus analytical noise?
If yes, the change is statistically significant.
If no, it may simply represent normal variability.
Clinical Interpretation
Even when a change exceeds the RCV, interpretation is still required.
A statistically significant change does not automatically mean laboratory error. It may reflect a real clinical event, such as:
- Acute bleeding
- Rapid renal deterioration
- Electrolyte imbalance
- Hemolysis
This is where laboratory judgment becomes critical.
As technicians, we must combine:
- Knowledge of biological variation
- Awareness of instrument performance
- Clinical context when available
Delta checks are strongest when they integrate science with professional interpretation. They are not meant to replace critical thinking. They are meant to support it.
Understanding the scientific basis behind delta checks transforms them from simple flags on a screen into meaningful quality tools rooted in clinical pathology and statistical reasoning.
Types of Delta Check Methods
Delta checks are not designed in only one way. Different laboratories apply different methods depending on workload, analyzer performance, and clinical setting. As laboratory technicians, we should understand how each method works, because when a delta flag appears, the logic behind it matters.
Some methods are simple and practical. Others are more refined and data-driven. Each has strengths and limitations.
Absolute Delta Difference
This is the most straightforward method.
The current result is subtracted from the previous result. The difference is compared to a predefined numerical limit.
For example:
If yesterday’s hemoglobin was 13.5 g/dL and today’s value is 10.8 g/dL, the absolute delta is 2.7 g/dL. If the laboratory has set a delta limit of 2.0 g/dL within 24 hours, this result will be flagged.
This method is commonly used in hematology because many parameters are relatively stable over short periods. Hemoglobin, hematocrit, MCV, and platelet count are typical examples.
The advantage of absolute delta difference is simplicity. It is easy to calculate and easy to interpret. However, it may not work well for analytes that have a wide concentration range across patients. A fixed numerical difference may be too strict for one patient and too loose for another.
So while it is practical, it must be applied thoughtfully.
Percentage Change Method
Instead of looking at a fixed number, this method calculates the relative change between two results.
The formula is:
This gives the percent change.
For example, a creatinine rising from 0.8 mg/dL to 1.2 mg/dL represents a 50 percent increase. That is clinically significant, even though the absolute difference is only 0.4 mg/dL.
Percentage delta checks are especially useful in clinical chemistry, where analyte concentrations vary widely among patients. Sodium, potassium, bilirubin, and creatinine often benefit from this approach.
However, percentage change can become exaggerated when the previous value is very low. A small numerical shift can appear as a very large percentage difference. Because of this, some laboratories use hybrid rules that combine both absolute and percentage criteria.
When reviewing a flagged result, it helps to quickly estimate whether the percentage change truly looks unreasonable for that patient.
Rate-of-Change Approach
The rate-of-change method adds another dimension: time.
It does not only ask how much the value changed. It also asks how quickly it changed.
For example, a hemoglobin drop of 2 g/dL over six months may be expected in chronic disease. The same drop in six hours raises serious concern.
This approach is particularly useful in acute care settings such as emergency departments and intensive care units. Rapid shifts in potassium, glucose, or hemoglobin may reflect real clinical deterioration. Or they may signal pre-analytical error.
By incorporating time intervals, the delta check becomes more clinically intelligent.
Still, accurate timestamp documentation is essential. If collection times are incorrect in the system, the rate-of-change calculation becomes unreliable.
Multivariate Delta Checks
Traditional delta checks evaluate one analyte at a time. Multivariate delta checks assess several related parameters together.
For example, in a complete blood count:
- Hemoglobin
- Hematocrit
- RBC count
- MCV
If all four parameters change in a consistent pattern, the result may represent a real physiological event. But if only one parameter shifts dramatically while others remain stable, analytical or clerical error becomes more likely.
Multivariate approaches are especially powerful in detecting specimen mix-ups. If a patient’s entire laboratory profile suddenly resembles a different biological pattern, that should trigger deeper investigation.
This method is more complex and often requires advanced LIS configuration or algorithm-based systems. However, it reduces false flags and improves detection of true identification errors.
As automation advances, multivariate delta checks are becoming more common.
Understanding these different methods helps laboratory technicians respond appropriately to delta alerts. A 2 g/dL hemoglobin drop flagged by an absolute rule is different from a 60 percent creatinine increase flagged by a percentage rule.
Behind every delta check is a calculation. Behind every calculation is a quality principle. And behind every quality principle is patient safety.
Selection of Analytes for Delta Checks
Not every laboratory test is suitable for delta checking.
Some analytes change rapidly with normal physiology. Others remain relatively stable unless something significant happens. The effectiveness of a delta check depends heavily on choosing the right parameters.
As laboratory technicians, we should understand why certain tests are selected and others are not. A well-designed delta check system begins with smart analyte selection.
Hematology Parameters
Hematology is traditionally the strongest area for delta checks.
Many red cell indices remain fairly stable over short periods in stable patients. Because of this, unexpected changes are easier to detect.
Commonly selected hematology parameters include:
- Hemoglobin
- Hematocrit
- Mean Corpuscular Volume (MCV)
- Platelet count
For example, hemoglobin does not usually fluctuate dramatically within 24 hours without bleeding, transfusion, or significant fluid shifts. So if you see a sudden 3 g/dL drop in a patient with no clinical explanation, that deserves careful review.
MCV is even more stable. It changes slowly because red cell size reflects erythropoiesis over weeks. A large overnight shift in MCV often points toward instrument issues or specimen mix-up.
Platelet counts can vary more than red cell indices, especially in critical patients. Still, major unexpected changes should trigger verification.
Hematology parameters are powerful for delta checks because they are:
- Biologically stable in short intervals
- Frequently ordered
- Clinically significant
That combination makes them ideal candidates.
Clinical Chemistry Parameters
Clinical chemistry analytes are more variable, but several are still useful for delta checking.
Common examples include:
- Creatinine
- Sodium
- Potassium
- Bilirubin
Creatinine is particularly valuable. In stable patients, it does not rise or fall dramatically within hours. A sharp increase may reflect acute kidney injury. Or it may indicate a sample problem.
Electrolytes such as sodium and potassium are slightly more dynamic. They can change with fluid therapy, medication, or acute illness. Because of this, delta limits for electrolytes must be carefully defined.
Bilirubin may change in liver disease or hemolysis, but large unexpected shifts in a short period should still be reviewed.
In chemistry, percentage-based delta checks often work better than fixed numerical differences, especially for analytes with wide concentration ranges.
Blood Bank and Transfusion Markers
Delta checks are extremely important in transfusion services.
ABO grouping consistency is a classic example. A patient’s blood group should not change. If current typing does not match historical records, that is a serious red flag.
Similarly, antibody screening trends can be reviewed over time. A new unexpected antibody result in a patient with no transfusion history requires careful confirmation.
In blood bank practice, delta checks are directly linked to patient safety. Misidentification here can have life-threatening consequences.
Criteria for Selection
When selecting analytes for delta checks, several criteria should be considered.
Biological Stability
Tests that remain relatively stable over short periods are better candidates.
If an analyte naturally fluctuates widely within hours, delta checks may generate too many false alerts. Glucose, for example, changes rapidly with meals and insulin therapy. It is generally less suitable for strict delta rules.
Clinical Relevance
The analyte should have meaningful clinical implications.
If a large unexpected change could indicate specimen mix-up or serious clinical deterioration, it is a strong candidate.
Hemoglobin, creatinine, and sodium meet this criterion well.
Analytical Precision
The method used to measure the analyte must have acceptable precision.
If the analytical imprecision is high, small fluctuations may reflect instrument variability rather than true patient change. In such cases, delta limits must be wider, or the analyte may not be ideal for delta monitoring.
Internal quality control performance should always be reviewed before setting delta rules.
Selecting analytes for delta checks is not random. It is a deliberate quality decision.
The goal is to balance sensitivity and practicality. Too many flags create alert fatigue. Too few flags weaken patient safety.
When the right analytes are chosen, delta checks become a quiet but powerful safeguard running in the background of daily laboratory work.
Establishing Delta Check Limits
Setting delta check limits is one of the most critical steps in building an effective quality system. If the limits are too tight, you will face constant flags and unnecessary workload. If they are too wide, important errors may pass unnoticed.
There is no universal number that fits every laboratory. Limits must be designed carefully, using data, statistics, and clinical understanding.
Data-Driven Approach
A strong delta check system begins with your own laboratory data.
Instead of guessing acceptable changes, we analyze historical patient results. This makes the system realistic and tailored to the population we actually serve.
Retrospective Data Analysis
The first step is reviewing past results from your laboratory information system.
You can extract paired results for specific analytes, such as:
- Hemoglobin values within 24 hours
- Creatinine results within 48 hours
- Sodium changes in admitted patients
By calculating the differences between consecutive results, you begin to see patterns. Most changes will fall within a predictable range. A few will stand out.
Those outliers are important. Some represent real clinical events. Others may reflect errors. Studying them gives insight into how sensitive your delta rule should be.
This approach grounds your delta limits in real-world laboratory performance rather than theory alone.
Percentile-Based Thresholds
After collecting sufficient data, percentile analysis can be applied.
For example, you may determine that 95 percent of hemoglobin changes within 24 hours fall within ±1.5 g/dL. Only 5 percent exceed that.
You could then set the delta limit near that boundary.
Some laboratories use the 95th percentile. Others prefer the 99th percentile to reduce false flags.
Choosing the percentile is a balance. A lower percentile increases sensitivity but also increases workload. A higher percentile reduces flags but may miss subtle errors.
There is no perfect answer. The goal is practical safety.
Statistically Derived Limits
Beyond simple percentiles, more rigorous statistical models can be used.
RCV-Based Thresholds
Reference Change Value provides a scientifically grounded method for setting delta limits.
RCV incorporates:
- Analytical imprecision (CVa)
- Within-subject biological variation (CVi)
This approach calculates how much change must occur before it is statistically significant at a chosen confidence level.
In simple terms, RCV tells us whether a difference is larger than expected random variation.
Using RCV strengthens the scientific basis of delta checks. It aligns quality control with biological reality. However, accurate CVa and CVi data must be available.
If internal QC performance changes, RCV-based limits may also need adjustment.
Confidence Interval Considerations
RCV calculations depend on selected confidence levels, often 95 percent.
Choosing a higher confidence level increases the threshold and reduces false alerts. Lower confidence levels increase sensitivity.
As laboratory professionals, we must decide what level of risk is acceptable. That decision should involve quality management and, in some cases, clinical leadership.
Clinically Adjusted Limits
Not all patient populations behave the same.
A stable outpatient population differs greatly from critically ill ICU patients. Oncology patients receiving chemotherapy may show rapid hematologic changes. Neonates have unique physiological patterns.
Because of this, delta limits sometimes require clinical adjustment.
For example:
- ICU patients may require wider limits for electrolytes.
- Chronic dialysis patients may need customized creatinine delta rules.
- Oncology wards may require modified hemoglobin thresholds.
These adjustments reduce unnecessary flags while preserving patient safety.
Special populations should never be ignored when designing delta check systems. One rule applied blindly across all departments can create frustration and reduce trust in the system.
Establishing delta check limits is both science and judgment.
It requires:
- Careful data analysis
- Understanding of analytical performance
- Awareness of biological variation
- Sensitivity to clinical context
When done properly, delta limits become intelligent safeguards rather than constant alarms. They support laboratory technicians in identifying real problems without overwhelming daily workflow.
Time Interval Considerations
When we talk about delta checks, we often focus on the size of the change. But there is another equally important factor: time.
A 2 g/dL drop in hemoglobin does not mean the same thing over six months as it does over six hours. The numbers may look identical, yet the clinical meaning is completely different.
That is why time interval rules are built into well-designed delta check systems.
Defined Comparison Windows
A delta check must compare results within a defined time frame. Without a clear comparison window, the system becomes inconsistent and unreliable.
Common comparison windows include:
- 24-hour comparison
- 48- or 72-hour comparison
- Long-term comparison, such as 30 days or more
Each window serves a different purpose.
24-Hour Comparison
This is commonly used for hospitalized patients.
In stable inpatients, many analytes should not change dramatically within 24 hours. So a large shift during this period often deserves attention.
For example:
- Sudden hemoglobin drop
- Rapid creatinine rise
- Unexpected sodium fluctuation
Short comparison windows are highly sensitive for detecting specimen mix-ups and acute clinical events.
However, they may generate more alerts in critical care settings where rapid changes are expected.
72-Hour Comparison
A slightly wider window can reduce excessive flags while still maintaining safety.
This approach works well in general wards where patients are moderately stable. It allows for gradual clinical changes without triggering unnecessary reviews.
Many laboratories customize time intervals depending on patient location.
Long-Term Comparison Rules
Longer intervals, such as 30 days or even several months, are sometimes used for outpatients.
In these cases, the goal may not be immediate error detection but identification of major inconsistencies in patient history.
For example, a long-term shift in blood group records would be alarming. But small variations in chemistry values over months may be clinically expected.
Long-term comparisons are useful, but they must be interpreted with caution.
Impact of Clinical Context
Time intervals cannot be separated from clinical context.
The same analyte behaves differently in different settings.
Acute Versus Chronic Conditions
In acute conditions, rapid changes are expected.
A trauma patient may lose blood quickly. A septic patient may develop sudden electrolyte imbalance. In such cases, narrow time windows may produce frequent delta alerts that reflect true clinical events.
On the other hand, in chronic disease management, changes are often gradual. For example:
- Chronic kidney disease
- Stable anemia
- Long-term liver disease
Here, a slow trend over weeks is more meaningful than hourly variation.
Delta rules must respect this difference.
Inpatient Versus Outpatient Differences
Inpatients are monitored closely and may have daily testing. Outpatients may have weeks or months between tests.
Because of this:
- Inpatient delta checks often use short intervals.
- Outpatient delta checks may rely on broader windows and higher thresholds.
Applying the same rule to both groups can create confusion.
A sudden creatinine rise in an ICU patient may be clinically expected. The same rise in a stable outpatient requires careful verification.
Time interval design is not just a technical setting in the LIS. It is a quality decision.
As laboratory technicians, we should always consider:
- How much time passed between results
- Where the patient is located
- Whether rapid change is clinically plausible
When we combine magnitude of change with time context, delta checks become far more meaningful.
Without time awareness, numbers can mislead. With proper time consideration, they become powerful tools for patient safety and laboratory quality.
Workflow Integration in the Laboratory
Delta checks are only powerful when they are properly built into daily laboratory workflow. If they sit quietly in the system without clear rules, they either create chaos or get ignored. And honestly, both situations are risky.
In modern laboratories, delta checks are tightly connected with the Laboratory Information System (LIS). This is where automation, autoverification, and manual review processes come together.
Let’s break it down step by step.
Automation in LIS
Automation is what makes delta checks practical. Without it, comparing every new result with historical data would be impossible in a busy lab.
The LIS automatically:
- Retrieves previous patient results
- Applies predefined delta limits
- Flags results that exceed thresholds
- Routes them for review
But automation must be smart. Poorly configured rules can overload the bench with unnecessary alerts.
Autoverification Rules
Autoverification is one of the biggest advantages of LIS integration.
When a current result falls within acceptable delta limits, and all other QC parameters are valid, the system can release the result automatically.
This saves time. It reduces manual workload. And it allows technologists to focus on abnormal or critical cases.
However, autoverification rules should always include:
- Valid internal QC status
- No critical value flags
- No instrument error codes
- Acceptable delta difference
If even one condition fails, the result should stop for review. Patient safety comes first, always.
Flagging When Outside Limits
When a result exceeds the defined delta threshold, the LIS generates an alert.
Depending on configuration, this may appear as:
- A pop-up warning
- A highlighted result
- A review queue entry
Some systems categorize alerts based on severity. This helps prioritize urgent cases.
Alert Hierarchies
Not all delta flags are equal.
- Soft flags allow the technologist to review and override after proper verification.
- Hard stops prevent result release until a supervisor or authorized staff member approves it.
Hard stops are usually reserved for high-risk parameters, such as:
- Blood group discrepancies
- Large hemoglobin drops
- Critical electrolyte shifts
A balanced alert hierarchy prevents both under-reaction and alert fatigue. Too many hard stops slow the lab. Too many soft flags weaken control.
Finding that balance takes experience.
Manual Review Process
Even the best automation cannot replace professional judgment.
When a delta check fails, the manual review process begins. And this is where laboratory technicians play a central role.
Verification of Patient Identification
First, confirm the basics.
- Patient name
- Medical record number
- Accession number
- Date and time of collection
Many delta failures are due to specimen mislabeling or wrong-patient draws. A quick ID check can sometimes solve the issue immediately.
Review of Clinical History
Next, review available clinical information.
Ask yourself:
- Is the patient in ICU?
- Was there recent surgery?
- Is there active bleeding?
- Is dialysis ongoing?
A sudden change in creatinine for a dialysis patient may be expected. The same change in a stable outpatient could signal a serious issue.
Context changes everything.
Instrument and QC Check
Before calling the ward, check:
- Internal QC results
- Calibration status
- Maintenance logs
- Analyzer flags
Sometimes the delta alert reflects an analytical problem, not a patient issue.
If QC is out of range, do not release results until the issue is resolved. Document everything clearly.
Communication with Clinical Units
If no analytical or identification error is found, and the change remains unexplained, communication is necessary.
Call the nursing station or responsible clinician. Confirm:
- Patient condition
- Recent transfusions
- IV fluid administration
- Clinical events
Professional, clear communication strengthens trust between the laboratory and clinical team.
Delta checks are not just technical settings in software. They are living parts of the laboratory quality system.
When properly integrated into workflow, they:
- Reduce specimen errors
- Support autoverification
- Improve turnaround time
- Protect patient safety
As laboratory technicians, understanding how delta checks move through the system—from automation to manual review—helps us respond calmly, confidently, and correctly.
And that makes a real difference at the bench.
Common Causes of Delta Check Failures
When a delta check fails, the first reaction should never be panic. A flagged result does not automatically mean something is wrong with the patient. It simply means the change is large enough to demand attention.
As laboratory technicians, our job is to think logically. We move step by step. We rule out errors before assuming true clinical change.
Most delta check failures fall into four main categories: pre-analytical, analytical, post-analytical, and genuine clinical causes.
Pre-Analytical Factors
Pre-analytical errors are the most common reason for unexpected delta flags. These occur before the sample even reaches the analyzer.
Specimen Mislabeling
Wrong labels can completely distort delta comparisons.
If Patient A’s previous hemoglobin was 13.5 g/dL and today’s sample shows 7.2 g/dL, that sharp drop may trigger an immediate alert. But if the tube actually belongs to Patient B, the system is simply doing its job.
Always verify:
- Patient name
- Medical record number
- Barcode accuracy
- Collection time
Even a small labeling mistake can create a major discrepancy.
Wrong Patient Draw
Sometimes the tube is labeled correctly, but blood was drawn from the wrong patient.
This happens more often during busy shifts or in emergency settings. A delta failure in multiple parameters at the same time should raise suspicion.
For example:
- Hemoglobin, hematocrit, and MCV all change dramatically
- Blood group does not match historical record
When several unrelated analytes shift in different directions, think identification error first.
Sample Contamination
Contaminated samples can also cause unexpected changes.
Common examples include:
- IV fluid contamination causing low sodium or diluted hemoglobin
- EDTA contamination leading to falsely elevated potassium
- Hemolysis affecting potassium and LDH
If the clinical picture does not match the result, inspect the specimen condition carefully.
Analytical Factors
If pre-analytical issues are ruled out, the next step is to evaluate the analyzer and testing process.
Instrument Malfunction
Analyzer issues can produce sudden shifts in results.
Look for:
- Error codes
- Sudden calibration shifts
- Multiple patients showing similar unusual changes
If several unrelated patients show the same abnormal trend, the problem is likely technical, not clinical.
Reagent Instability
Reagents have stability limits. Improper storage, expired kits, or temperature variation can affect results.
A gradual drift in results over several samples may indicate reagent degradation.
Always check:
- Lot number
- Expiry date
- Open-vial stability
- Storage conditions
Small technical issues can produce big delta flags.
Calibration Drift
Calibration drift can slowly alter reported values.
For example, if creatinine values consistently trend higher than previous results for many patients, calibration should be reviewed.
Delta checks sometimes act as an early warning system for analytical bias. In that sense, they protect both the laboratory and patients.
Post-Analytical Factors
Errors do not stop after analysis. Post-analytical mistakes can also trigger delta failures.
Data Entry Errors
Manual transcription mistakes can create unrealistic differences.
Typing 14.2 instead of 4.2, or misplacing a decimal point, can instantly generate a large delta alert.
Even in automated systems, interface glitches can occur. If a result looks clinically impossible, verify the raw analyzer output.
Unit Conversion Mistakes
Changing units without proper conversion is another cause.
For example:
- Reporting glucose in mg/dL instead of mmol/L
- Mixing up g/dL and g/L
Such mistakes produce dramatic delta differences that have nothing to do with patient condition.
Always confirm units before releasing results.
True Clinical Changes
After ruling out all laboratory-related causes, we must consider the possibility that the change is real.
And sometimes, it is.
Acute Bleeding
A sudden drop in hemoglobin and hematocrit may indicate active bleeding.
In surgical or trauma patients, this can happen quickly. The delta check may be the first alert before clinical symptoms become obvious.
Hemolysis
In vivo hemolysis can cause:
- Increased potassium
- Increased LDH
- Decreased haptoglobin
This is different from sample hemolysis. Clinical correlation is essential.
Renal Failure
Creatinine and urea can rise significantly within a short period in acute kidney injury.
If a previously stable patient shows a rapid increase, the delta flag is clinically meaningful.
Electrolyte Imbalance
Sudden sodium or potassium shifts may reflect:
- Dehydration
- IV therapy changes
- Endocrine disorders
In these cases, the delta alert supports early intervention.
Delta check failures are not obstacles. They are signals.
As laboratory technicians, our responsibility is to analyze the signal carefully. First exclude identification and analytical issues. Then correlate with clinical context.
This structured thinking not only reduces unnecessary repeat testing but also strengthens patient safety. And over time, it sharpens our professional judgment at the bench.
Quality Management and Accreditation Considerations
In many labs, delta checks are not just a “nice extra.” They are actually part of the quality backbone. When used correctly, they help us catch patient misidentification, analytical drift, and even LIS mapping errors before those results reach the clinician. So yes, they are deeply tied to quality management systems, not just technical validation.
Let’s break down how this fits into accreditation and daily QA work.
Role in ISO 15189 Compliance
ISO 15189 emphasizes patient-based quality indicators, and delta checks are a perfect example of that concept in action.
Unlike internal QC materials, delta checks evaluate:
- Real patient data
- Real biological behavior
- Real workflow risks
This makes them powerful evidence during audits.
Why Auditors Like Delta Checks
Because delta checks demonstrate that the laboratory is:
- Monitoring result consistency over time
- Detecting pre-analytical errors, especially wrong-patient samples
- Using risk-based thinking, which ISO 15189 strongly encourages
During an assessment, you may be asked:
- How are delta limits established?
- How often are they reviewed?
- What happens when a delta flag occurs?
If your SOP clearly defines these steps, you’re already aligned with accreditation expectations.
Documentation Requirements
Make sure you maintain:
- Written delta check policy
- Defined analyte list and limits
- Review workflow for flagged results
- Evidence of periodic evaluation
Without documentation, even a well-working system does not count as quality control in the eyes of accreditation bodies.
Performance Monitoring
Now comes the part many labs forget — measuring whether the delta check system is actually useful.
Just because flags are appearing does not mean the system is working correctly.
Track the Delta Flag Rate
You should routinely monitor:
- Percentage of results generating delta alerts
- Distribution by analyte
- Trends over time
If your delta flag rate is:
- Too low → You may be missing real errors
- Too high → Staff may ignore alerts (alert fatigue)
A balanced flag rate usually means your thresholds reflect real biological variation.
Evaluate True Positives vs False Positives
Each flagged result should be categorized, for example:
| Category | Example |
|---|---|
| True positive | Sample mix-up detected |
| Expected clinical change | Patient received transfusion |
| Analytical issue | Instrument calibration shift |
| False positive | Limit too strict |
This analysis tells you whether your delta limits are scientifically appropriate… or just guessing.
And honestly, many labs start with educated guesses. That’s okay — as long as you refine them using data.
Continuous Quality Improvement
Delta checks are not static. They must evolve with your laboratory.
New instruments, new reagents, new patient populations — all of these can change variation patterns. If limits are never updated, they slowly lose relevance.
Periodic Review of Thresholds
Best practice is to reassess delta limits:
- Annually, at minimum
- After major method changes
- When unexplained flag trends appear
Use retrospective LIS data again. Compare:
- Current variation patterns
- Historical thresholds
- Clinical relevance of flagged cases
This closes the quality loop.
Adjust Based on Laboratory Performance Data
For example:
- ICU population may need wider limits due to rapid physiology changes.
- Oncology patients may require analyte-specific rules.
- Highly precise analyzers may allow tighter thresholds.
Quality systems should adapt to real-world lab behavior, not textbook theory.
Practical Tip for Technicians
When reviewing a delta flag, remember:
You are participating in quality assurance, not just result validation.
Ask yourself:
- Does this change make clinical sense?
- Could this be the wrong sample?
- Is there an analyzer issue?
- Has the patient undergone treatment explaining the shift?
That short pause, sometimes just 20 seconds, is exactly what ISO 15189 calls risk control at the point of testing.
And that is where delta checks quietly protect both the patient and the laboratory.
Advanced and Emerging Approaches
Delta checks are no longer limited to simple “compare with last result” logic. Modern laboratories are moving toward smarter, data-driven monitoring systems. These tools do not replace the laboratory professional, they actually support us by catching patterns that are difficult to see manually, especially when workload is heavy and turnaround time is tight.
Let’s look at what is changing in real practice.
Patient-Based Real-Time Quality Control (PBRTQC)
PBRTQC is one of the biggest shifts in laboratory quality thinking. Instead of relying only on commercial QC materials, we continuously monitor real patient data as it flows through the analyzer.
This approach answers an important question:
Is the analyzer behaving normally for our patient population right now?
Moving Averages
Moving averages calculate the average of consecutive patient results over time. If the analyzer begins to drift, even slightly, the average will shift before traditional QC flags appear.
For example:
- Gradual calibration shift in sodium may not fail QC immediately.
- But the moving average of patient sodium values will slowly rise or fall.
- That trend signals a problem earlier.
It’s like an early-warning system. Quiet, but very effective.
Algorithmic Monitoring
Some LIS platforms now apply rules such as:
- Excluding critical values from averages
- Using truncation limits to remove outliers
- Monitoring separate patient groups (ICU vs OPD)
These refinements make PBRTQC more clinically meaningful and reduce noise in the data.
Machine Learning Applications
Now we are entering the phase where laboratories begin using predictive analytics. Machine learning models can analyze multiple parameters together and recognize patterns that traditional delta checks cannot detect.
This does not mean robots replacing technologists, it means better tools for decision support.
Pattern Recognition in Multivariate Data
Instead of checking hemoglobin alone, advanced systems may evaluate:
- Hemoglobin
- Hematocrit
- RBC indices
- Patient location
- Time interval
All at once.
If the pattern does not match expected biological behavior, the system flags it as suspicious — often identifying specimen mix-ups faster than single-analyte delta checks.
Reduction of Unnecessary Flags
One common complaint about delta checks is over-flagging. Machine learning models can be trained using historical lab data to distinguish:
- Expected clinical change
- Analytical variation
- True laboratory error
This improves specificity and reduces alert fatigue. In simple words, fewer useless alarms, more meaningful ones.
Integration with Electronic Health Records (EHR)
Delta checks are becoming more clinically connected, not just laboratory isolated tools.
When integrated with EHR systems, delta alerts can incorporate:
- Diagnosis information
- Medication history
- Surgical events
- Transfusion records
This context matters a lot.
For example:
A sudden hemoglobin drop may trigger a delta flag. But if the EHR shows recent surgery, the system can classify it as expected change instead of a laboratory error.
Trend Visualization Dashboards
Modern middleware allows graphical display of patient trends directly within the LIS or connected dashboard tools.
Technologists can quickly visualize:
- Longitudinal creatinine changes
- Electrolyte trends over hospitalization
- Stability versus sudden shifts
Seeing the data visually often provides clarity faster than reading numbers alone. And honestly, when workload is high, that visual confirmation helps decision-making a lot.
What This Means for the Laboratory Technician
These advanced systems are tools, not replacements. They still rely on:
- Correct sample handling
- Proper analyzer maintenance
- Critical thinking during result validation
Technology can detect patterns. But only a trained laboratory professional can interpret them within clinical context.
As labs adopt PBRTQC, AI-assisted delta checks, and EHR integration, the technician’s role actually becomes more analytical, more investigative… and yes, more valuable than ever.
This content has been reviewed by subject-matter experts to ensure scientific accuracy. Learn more about us and our editorial process.
Last reviewed on .
Article history
- Latest version
Reference(s)
- Fraser, C.G.. “Biological Variation: From Principles to Practice.”, AACC Press, 2001, isbn: 9781890883492. <https://books.google.com.pk/books?id=1YsDPMABuwEC>.
- Fraser, C.G.., et al. “Generation and Application of Data on Biological Variation in Clinical Chemistry.” Critical Reviews in Clinical Laboratory Sciences, vol. 27, no. 5, 1989, pp. 409-437., doi: 10.3109/10408368909106595. <https://doi.org/10.3109/10408368909106595>.
- Westgard, J.O.. “Basic Quality Control Practices.” 4th ed., 2016, isbn: 9781886958302. <https://westgard.com/resources/resources/basic-qc-practices-4th-ed.html>.
- Westgard, J.O.., et al. “Cost-Effective Quality Control: Managing the Quality and Productivity of Analytical Processes.”, AACC Press, 1986, isbn: 0915274353. <https://openlibrary.org/books/OL2714940M/Cost-effective_quality_control>.
- International Organization for Standardization. “ISO 15189: Medical laboratories – Requirements for quality and competence.” 4th ed., Geneva: ISO <https://www.iso.org/standard/76677.html>.
- CLSI. “EP29-A: Expression of Measurement Uncertainty in Laboratory Medicine.”, Wayne, PA: Clinical and Laboratory Standards Institute, 2012 <https://clsi.org/shop/standards/ep29/>.
- CLSI. “C24: Statistical Quality Control for Quantitative Measurement Procedures: Principles and Definitions.” 4th ed., Wayne, PA: Clinical and Laboratory Standards Institute, 2016 <https://clsi.org/shop/standards/c24/>.
- Badrick, Tony., et al. “Patient-Based Real-Time Quality Control: Review and Recommendations.” Clinical Chemistry, vol. 65, no. 8, 01 August 2019, pp. 962-971., doi: 10.1373/clinchem.2019.305482. <https://doi.org/10.1373/clinchem.2019.305482>.
- van Rossum, Huub H.. “Moving Average Quality Control: Principles, Practical Application and Future Perspectives.” Clinical Chemistry and Laboratory Medicine, vol. 57, no. 6, 2019, pp. 773-782., doi: 10.1515/cclm-2018-0795. <https://doi.org/10.1515/cclm-2018-0795>.
- Fraser, C.G.. “Reference Change Values.” Clinical Chemistry and Laboratory Medicine, vol. 50, no. 5, 2012, pp. 807-812., doi: 10.1515/cclm.2011.733. <https://doi.org/10.1515/cclm.2011.733>.
Cite this page:
- Posted by Dayyal Dungrela
- Analytical Imprecision
- Biological Variation
- Clinical Laboratory Workflow
- Clinical Pathology
- Delta Check Limits
- Delta Checks
- ISO 15189
- Laboratory Accreditation
- Laboratory Quality Control
- Laboratory Technique
- LIS Autoverification
- Patient-Based Quality Control
- Reference Change Value
- Specimen Mislabeling Detection
- Total Allowable Error