Levey-Jennings Chart: Interpretation and Its Role in Laboratory Quality Control
Pathology / Clinical Pathology
Levey-Jennings Chart: Interpretation and Its Role in Laboratory Quality Control
The Levey-Jennings chart is a graphical representation used to monitor laboratory quality control. It detects deviations, shifts, and trends, while Westgard rules are applied to identify systematic and random errors.
Published:
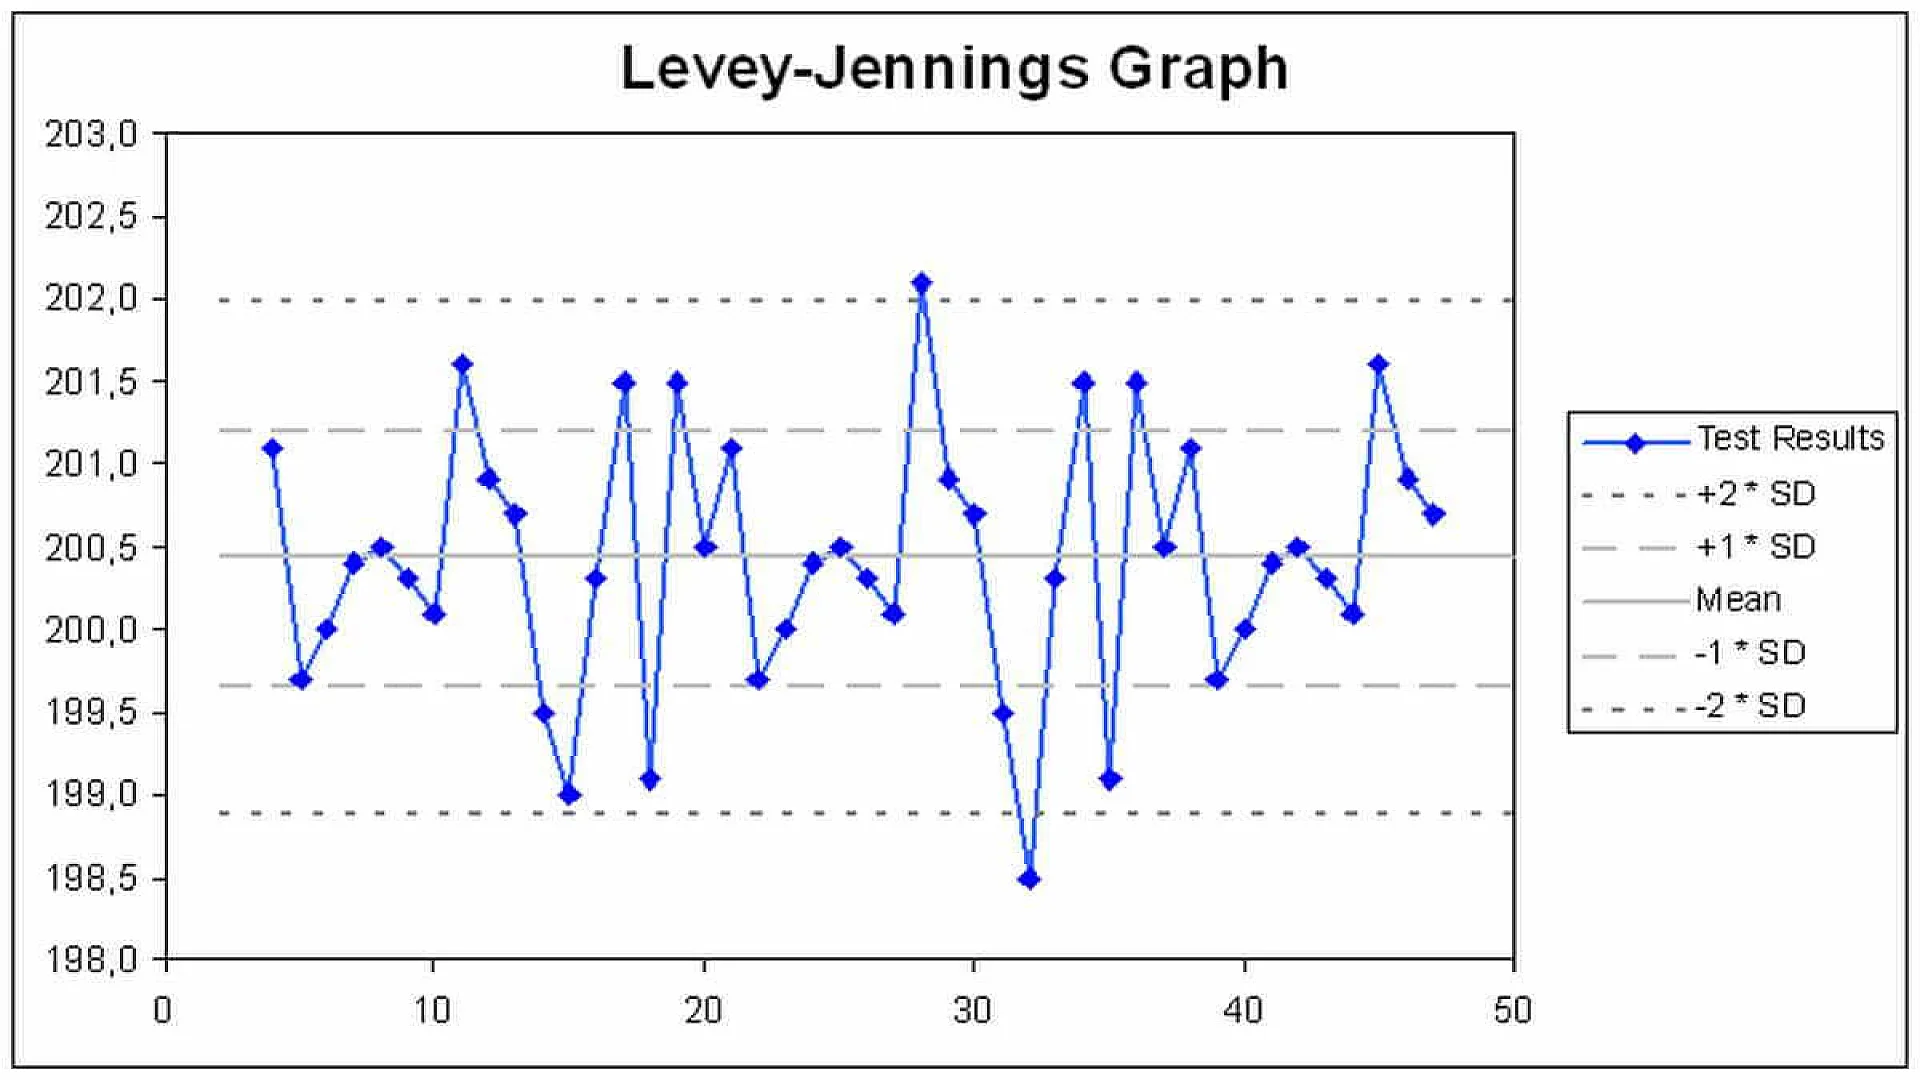
The Levey-Jennings (LJ) chart is a graphical representation of measured results of control samples over time. It is used to identify deviations, shifts and trends in analytical performance during laboratory quality control.
Structure of the Levey-Jennings Chart
- X-axis: The x-axis is the horizontal line in an LJ chart that represents the sequence of measured results of control samples. The values are plotted in chronological order (e.g., daily runs).
- Y-axis: The y-axis is the vertical line in an LJ chart that represents the measured results of control samples.
- A mean line is plotted at the center, representing the established average value of the control.
- Standard deviation (SD) lines are drawn at ±1 SD, ±2 SD, and ±3 SD from the mean.
How It Works
QC samples (control materials) are run with patient samples, and their values are plotted sequentially on the chart.
If the values remain randomly distributed around the mean and within acceptable control limits (generally ±2 SD), the assay is considered in control.
If values show trends, shifts, or fall outside control limits, it indicates systematic or random analytical errors.
Interpretation Using Westgard Rules
Levey-Jennings charts are often interpreted with Westgard rules to identify specific error patterns:
- 1-2s rule: A warning if one control exceeds ±2 SD.
- 1-3s rule: Rejection if one control exceeds ±3 SD.
- 2-2s rule: Rejection if two consecutive controls exceed ±2 SD on the same side.
- R-4s rule: Rejection if the difference between two controls in a single run exceeds 4 SD.
Advantages of Levey-Jennings Chart
- Simple Graphical Representation: It provides an easy-to-understand control data for monitoring assay performance.
- Early Detection of Analytical Errors: It is easy to detect the deviations, shifts, and trends using LJ chart allowing laboratory technologists to take corrective actions before reporting patient results.
- Detection of Both Systematic and Random Errors: Patterns such as trends or shifts indicate systematic errors, while sporadic outliers suggest random errors.
- QC Monitoring: By plotting daily or routine QC results, the LJ chart offers continuous surveillance of an assay’s performance.
- Improves Reliability of Patient Results: By ensuring that only results from “in-control” runs are reported, it improves the accuracy and reliability of laboratory testing.
- Supports Standardized QC Practices: The use of standard deviation (SD) limits makes it a globally accepted QC method, ensuring comparability between laboratories.
Usefulness in QC Certifications
- Compliance with Accreditation Standards: Accrediting bodies such as ISO 15189, the College of American Pathologists, and the Clinical Laboratory Improvement Amendments require laboratories to maintain documentation as evidence of quality control. LJ charts are widely accepted as proof of continuous QC monitoring.
- Demonstrates Competence in External Audits: Properly maintained LJ charts demonstrate that a laboratory actively monitors and interprets QC data, which is important for passing audits and inspections.
- Supports Proficiency Testing: Consistent QC monitoring with LJ charts helps laboratories to maintain analytical performance and improving their success rate in external proficiency testing programs, which is often required for certification.
- Training and Standardization: QC certifications often require staff to be trained in recognized QC methods. Familiarity with LJ charts demonstrates competency in standard laboratory quality practices.
Last reviewed on .
Article history
- Latest version
Reference(s)
- L. Barry, Patricia. “The Levey-Jennings Control Chart.” Westgard QC <https://westgard.com/lessons/basic-qc-practices-l/lesson12.html>.
- Westgard, J O. “The Calculations.” Westgard QC <https://westgard.com/lessons/basic-qc-practices-l/lesson14.html>.
- Code of Federal Regulations. “42 C.F.R. § 493.1256 – Standard: Control Procedures.” Code of Federal Regulations <https://www.ecfr.gov/current/title-42/section-493.1256>.
Cite this page:
- Posted by Dayyal Dungrela
Tags:
End of the article