HbA1c Explained: What Your A1C Number Really Means
A practical, evidence-first breakdown of what glycated hemoglobin actually measures, how to convert your result between percent and mmol/mol, which health conditions can throw the number off, and what the research says about bringing a high A1C down.
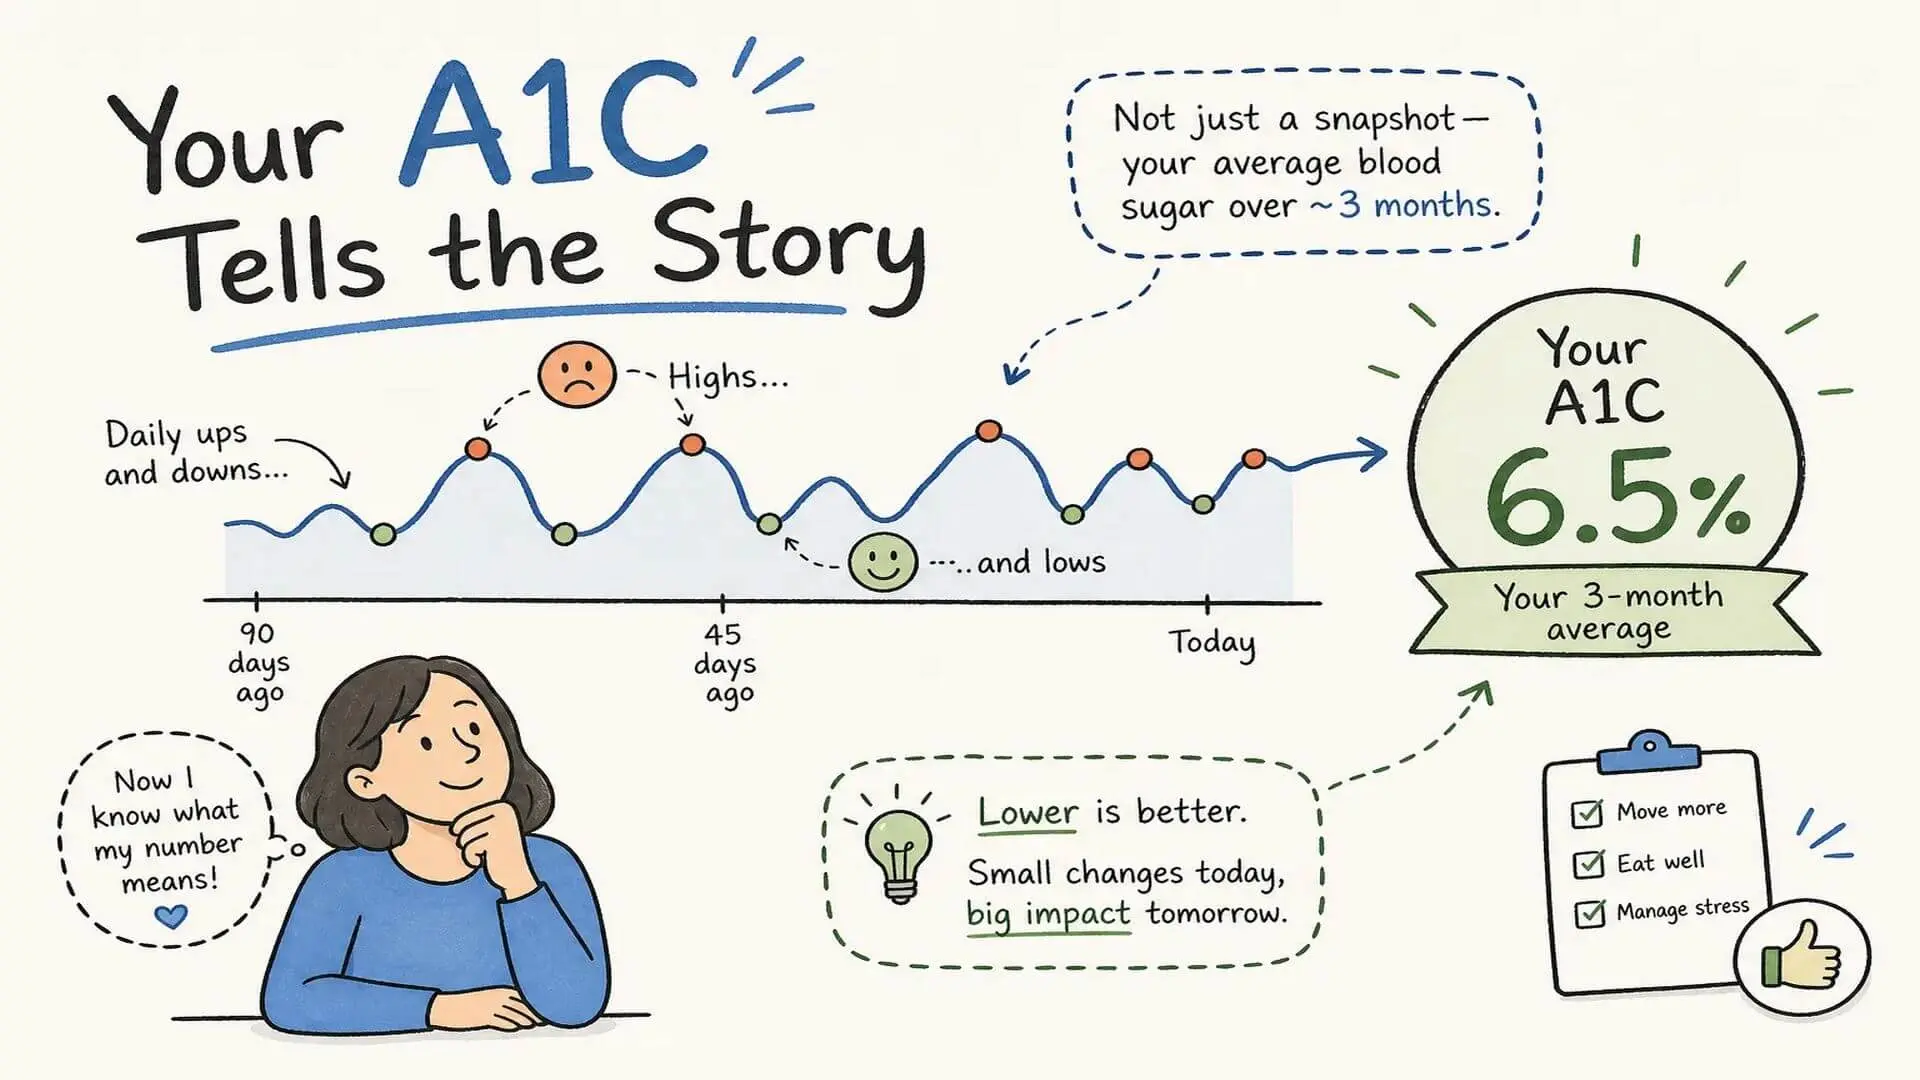
You get your blood work back, scan the results, and land on a line that reads “HbA1c: 6.2%.” No explanation, no context, just a number sitting there. For most people, that moment triggers a quick, unhelpful internet search rather than a real understanding of what the result means for their health. Consider this your HbA1c explained: a practical guide to what that number actually measures, how to read it, and what you can do about it.
HbA1c is not a snapshot. Unlike a fasting glucose reading that captures a single moment, this test reveals your average blood sugar level over the past two to three months. Clinicians rely on it as the primary tool for diagnosing and monitoring both diabetes and prediabetes precisely because of that long-range view. HbA1c and A1C refer to the same test, you will see both terms used interchangeably in lab reports, clinical guidelines, and patient literature.
This guide covers the full picture: how the test works at the biochemical level, how to read your result in percent and mmol/mol, what conditions can skew the number up or down, how often you should test, and what the evidence actually says about bringing a high result down. It follows the same expert-reviewed, evidence-first standards used across BioScience’s clinical biomarker series, making it equally useful for nursing students working through lab values and health-conscious readers decoding their own reports.
HbA1c explained: how glycated hemoglobin forms in your blood
The chemistry behind the three-month window
HbA1c forms through a process called glycation: glucose molecules in your bloodstream attach spontaneously to hemoglobin proteins inside red blood cells. This is a nonenzymatic reaction, meaning your body does not direct it. Glucose simply binds to the N-terminal amino acid of the hemoglobin molecule, first forming a loose, reversible bond called a Schiff base.
That initial attachment quickly undergoes what chemists call an Amadori rearrangement, converting the unstable Schiff base into a stable ketoamine compound. That stable compound is HbA1c. Once that bond forms, it does not break. The hemoglobin molecule stays glycated for the rest of that red blood cell’s life.
Why the 90-day lifespan is the key to the test
Red blood cells survive roughly 90 to 120 days. Because glycation accumulates continuously across that entire window, the proportion of glycated hemoglobin in a blood sample directly reflects how much glucose those cells were exposed to over those months. Think of it as a glucose memory built into the cells themselves.
The relationship is straightforward: higher average blood glucose means more hemoglobin molecules glycate, which pushes the HbA1c percentage higher. This is why the test tells a fundamentally different story than a fasting glucose reading, which can shift dramatically based on a single stressful morning or one unusual meal the night before.
Reading your A1C result: what the numbers actually mean
The diagnostic ranges in percent and mmol/mol
Both the American Diabetes Association (ADA) and the World Health Organization (WHO) use the same cutoff to diagnose diabetes: a result of 6.5% or higher, which equals 48 mmol/mol or higher. Below that threshold, results fall into one of two other categories. Normal is defined as below 5.7% (below 39 mmol/mol). Prediabetes, per the ADA, spans 5.7% to 6.4%, or 39 to 47 mmol/mol. It is worth noting that while the ADA and WHO share the diabetes diagnostic cutoff, the organizations differ on intermediate categories: the WHO identifies 42, 47 mmol/mol (approximately 6.0, 6.4%) as “non-diabetic hyperglycaemia” rather than formally adopting the ADA’s full prediabetes range.
Treatment targets are individualized. The ADA recommends a general goal of less than 7% (53 mmol/mol) for most non-pregnant adults. A stricter target of less than 6.5% is appropriate for younger patients with short-duration diabetes who can achieve it safely. A more relaxed target of less than 8% may apply to patients with high hypoglycemia risk or limited life expectancy. One practical note: a single abnormal reading requires a repeat confirmatory test unless obvious symptoms of hyperglycemia are already present.
HbA1c explained: converting A1C to estimated average glucose (eAG) and mmol/mol
The ADA’s ADAG-derived formula converts your HbA1c into an estimated average glucose (eAG): multiply your HbA1c percentage by 28.7, then subtract 46.7 to get a result in mg/dL. The table below maps common values across both units.
| HbA1c (%) | eAG (mg/dL) | eAG (mmol/L) |
|---|---|---|
| 6.0 | 126 | 7.0 |
| 6.5 | 140 | 7.8 |
| 7.0 | 154 | 8.6 |
| 7.5 | 169 | 9.4 |
| 8.0 | 183 | 10.1 |
Keep in mind that eAG represents a 24-hour average, including post-meal spikes. It will often read higher than the average of your home glucose meter readings, which capture isolated moments rather than the full arc of each day.
Why HbA1c outperforms a single fasting glucose test
The snapshot problem with point-in-time glucose
A fasting glucose reading reflects where your blood sugar sits at one specific moment. Acute stress, recent illness, disrupted sleep, or a single dietary deviation can shift that number meaningfully in either direction. That volatility makes it a less reliable picture of your true long-term glycemic health.
HbA1c averages glucose exposure across thousands of hours, making it far more resistant to short-term noise. This is why major diabetes guidelines list glycated hemoglobin as the preferred diagnostic and monitoring test for most patients. The test’s three-month window filters out the day-to-day variation that can make fasting glucose misleading.
Where fasting glucose and time in range (TIR) still earn their place
Fasting glucose remains essential when HbA1c accuracy is compromised by interfering conditions. For gestational diabetes, the 75 g oral glucose tolerance test (OGTT) is the standard diagnostic tool recommended by major guidelines; fasting glucose may be used as an initial screening step in some clinical settings but is not the definitive diagnostic standard. Time in range (TIR), measured via continuous glucose monitors (CGM), captures something HbA1c cannot: glucose variability. Dangerous swings between high and low glucose can average out to an A1C that looks acceptable, masking real risk.
A 2019 consensus report from the Advanced Technologies and Treatments for Diabetes (ATTD) conference confirmed that a 10% increase in TIR typically corresponds to a 0.5% to 0.8% decrease in HbA1c, and that a TIR of at least 70% generally aligns with an A1C around 7.0%. When used together, HbA1c and TIR give a more complete picture of glycemic control than either metric alone.
A1C accuracy and interfering factors
When your A1C reads falsely low
Any condition that shortens red blood cell lifespan reduces the time hemoglobin has to accumulate glycation, pulling the result downward regardless of actual glucose levels. The most clinically significant culprits include hemolytic anemia, sickle cell anemia, thalassemia, recent blood transfusion, hemorrhage, and the second and third trimesters of pregnancy, when physiological RBC turnover increases substantially.
Several medications also suppress HbA1c readings: erythropoietin, high-dose vitamin C, ribavirin, and hydroxyurea all interfere through various mechanisms, though the magnitude of these effects can vary depending on the specific laboratory assay used. Chronic kidney disease adds another layer of complexity. Uremia causes carbamylation of hemoglobin, which can directly interfere with laboratory assay methods and produce a falsely low reading even when blood glucose is consistently elevated.
When your A1C reads falsely high, and the hemoglobin variant problem
Iron deficiency anemia, along with folate and vitamin B12 deficiency, prolongs red blood cell lifespan by reducing normal RBC production rates. Older cells accumulate more glycation over their extended lifetimes, pushing HbA1c upward even when blood sugar is actually normal. Asplenia, the absence of a functional spleen, reduces the normal destruction of aging RBCs and produces the same upward bias.
Hemoglobin variants present a separate challenge. Carriers of HbS trait, HbC trait, or elevated fetal hemoglobin (HbF) may yield results skewed in either direction depending on the laboratory assay method used. People of African, Mediterranean, or Southeast Asian descent are more likely to carry variants that make HbA1c less reliable. In these cases, clinicians should confirm results using fasting plasma glucose or an oral glucose tolerance test (OGTT), or consider fructosamine as an alternative marker entirely.
How often you should get your A1C tested
Testing frequency for prediabetes
For people with prediabetes who are actively working to reduce risk through dietary changes and exercise, testing every six months gives meaningful feedback on whether those interventions are actually moving the number. Six months is sufficient to detect meaningful change without over-testing. For those with stable results and lower immediate risk, spacing tests to every one to two years is reasonable.
Quarterly testing makes practical sense for anyone who has recently made significant changes to diet or physical activity and wants to measure the response. That 90-day window aligns neatly with how the test works biologically, so waiting at least three months between tests ensures the result reflects the full effect of any changes made.
Testing frequency for diagnosed diabetes
The ADA and NICE guidelines align on the core framework: test every three months when glycemic targets are not being met or when treatment has recently changed, and every six months when control is stable and goals are consistently reached. These thresholds apply across both type 1 and type 2 diabetes.
Pregnancy demands the most intensive monitoring schedule, often monthly or more frequently, because tight glycemic control directly affects fetal development and outcomes. HbA1c alone is not sufficient during pregnancy. The OGTT remains the standard diagnostic for gestational diabetes, given the inaccuracies that physiological changes in red blood cell turnover introduce during the second and third trimesters.
HbA1c explained: evidence-based ways to lower your A1C
Dietary and lifestyle changes with the strongest clinical evidence
Aerobic exercise has the strongest single-modality evidence for reducing HbA1c in adults with type 2 diabetes. Published meta-analyses show average reductions of 0.6 to 0.7 percentage points from structured aerobic training alone, independent of weight loss. Achieving this requires at least 12 weeks of consistent effort, with research pointing to roughly 100 minutes per week of moderate-to-vigorous activity as the threshold where meaningful reductions appear.
On the dietary side, both low-glycemic-index diets and carbohydrate-restricted diets show clinically meaningful A1C reductions across randomized controlled trials. The Mediterranean diet has produced some of the largest effects in these trials, up to 1.5 percentage points in certain studies. Weight loss amplifies these results: losing 5 to 10% of body weight produces significant A1C improvements, and the effect is dose-dependent. Greater weight loss consistently produces greater A1C reduction. Combined exercise and diet programs delivered through structured, self-management-focused programs can push reductions as high as 1.8 percentage points.
Medication adherence, monitoring, and when to contact your clinician
For people already on diabetes medication, inconsistent dosing is one of the most common reasons A1C climbs between appointments. Medication adherence is a major driver of long-term glycemic control, one that is consistently underemphasized in clinical conversations. Pairing medication consistency with home glucose tracking or CGM data gives the most complete picture of what is actually driving your numbers.
Per ADA guidance, an A1C above 8% or a sharp rise since your last test despite genuine lifestyle effort is a clear signal to contact your clinician promptly rather than wait for a scheduled visit. Do not self-adjust medication doses without guidance, and do not assume a single bad result defines your trajectory. Early intervention on a rising A1C is far more effective than trying to reverse entrenched hyperglycemia months later.
Putting it all together
HbA1c explained in brief: it is a two-to-three-month average of blood glucose concentration, formed through glycation and reported in either percent or mmol/mol. The diagnostic cutoffs are clear, below 5.7% is normal, 5.7% to 6.4% is prediabetes per ADA criteria, and 6.5% or above meets the threshold for a diabetes diagnosis. The test is commonly preferred over fasting glucose for routine monitoring in most patients, though its accuracy depends on healthy, normal red blood cell turnover. Any condition that speeds up or slows down that turnover, from anemia to kidney disease to hemoglobin variants, can push the result in either direction. When those conditions are present, a confirmatory fasting glucose or OGTT is not optional; it is essential.
If your result lands in the prediabetes range, that is the best time to act. Dietary changes, structured aerobic exercise, and even modest weight loss have strong evidence from randomized trials behind them and can lower A1C by 0.5 to 1.5 percentage points within three to six months, depending on program intensity. BioScience publishes expert-reviewed guides on blood biomarkers, clinical lab values, and medical research across health and biology, all written to the same evidence-first standard used here, a reliable resource whether you are a nursing student working through lab interpretation or a health-conscious adult who wants more than a number with no context.
The information on this page is peer reviewed by a qualified editorial review board member. Learn more about us and our editorial process.
Last reviewed on .
Article history
- Latest version
Reference(s)
- Mayo Clinic. “Hemoglobin A1c.” Mayo Clinic <https://www.mayocliniclabs.com/test-catalog/Overview/610441>.
- NGSP. “HbA1c and Estimated Average Glucose (eAG).” National Glycohemoglobin Standardization Program <https://ngsp.org/A1ceAG.asp>.
- ADA. “What Is the A1C Test?.” American Diabetes Association <https://diabetes.org/about-diabetes/a1c>.
- Eyth, Emily., et al. “Hemoglobin A1C.” <https://www.ncbi.nlm.nih.gov/books/NBK549816/>.
Cite this page:
- Posted by Dayyal Dungrela