Hidden Soil Deficiencies Threaten Crop Yields Across Nepal Hilly Terrain
Geospatial mapping reveals severe potassium shortages and widespread acidity across agricultural lands in the Kaski district.
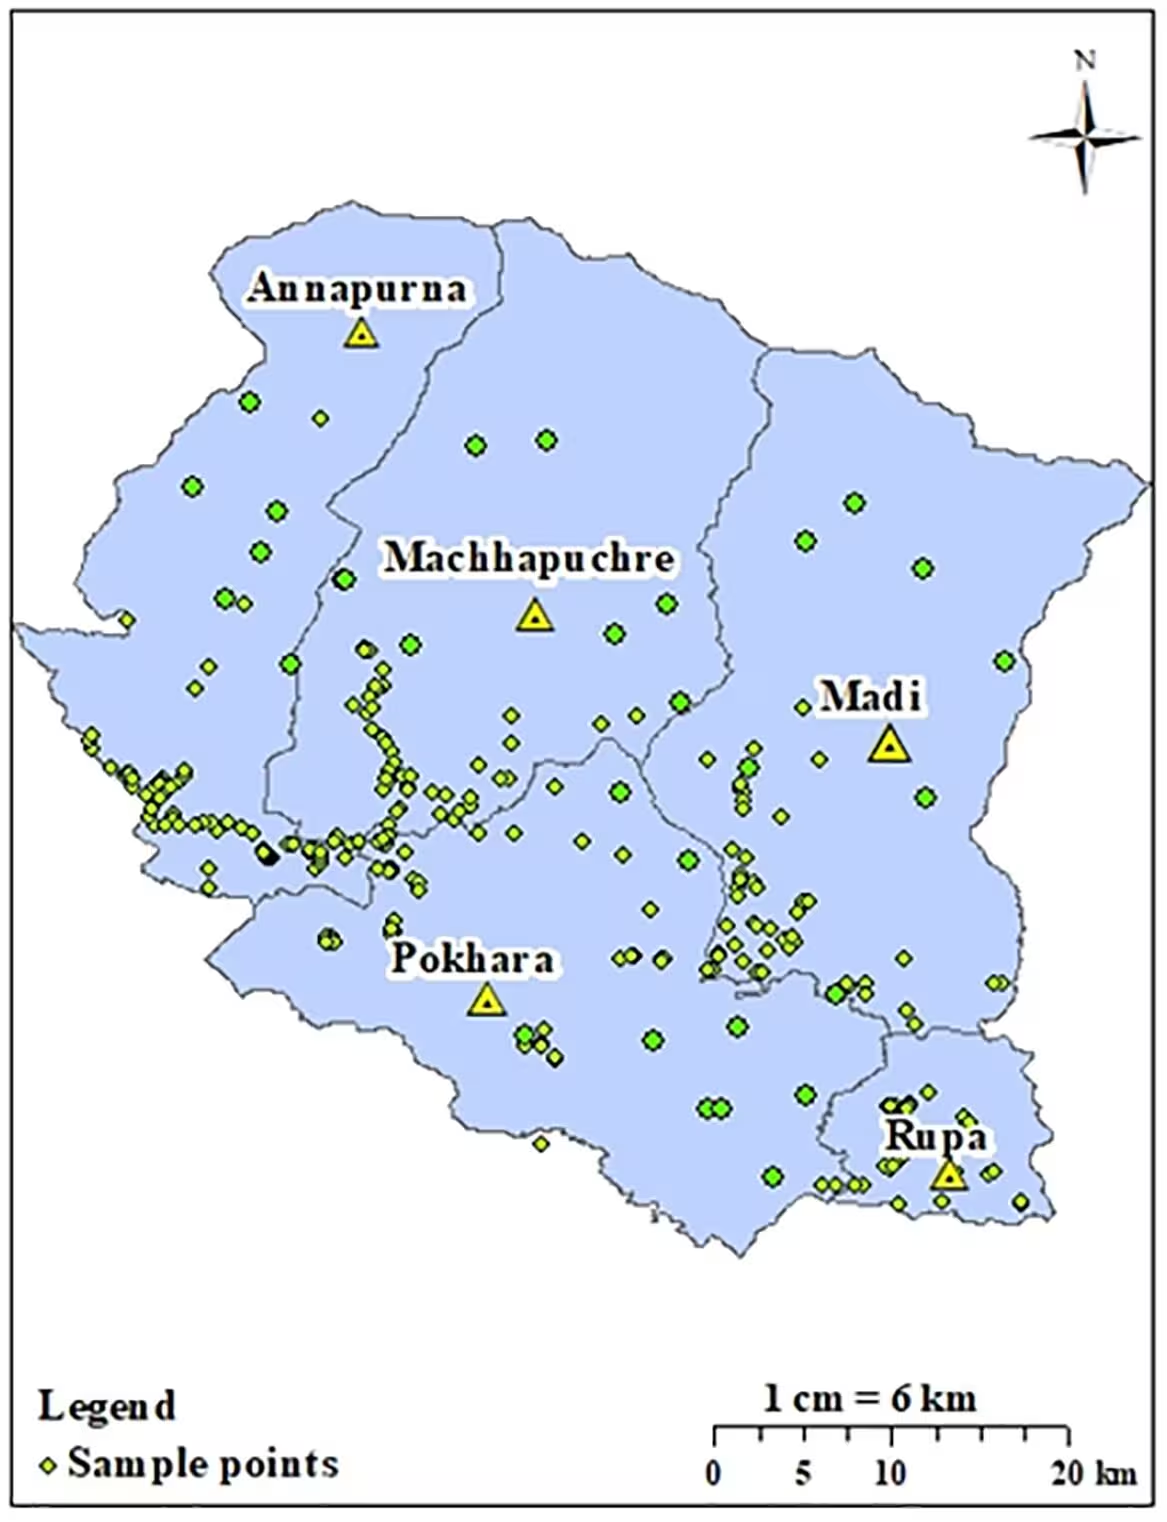
A detailed soil survey across the rugged terrain of the Kaski district in Nepal reveals severe potassium deficiency and widespread soil acidity that could threaten local crop yields. Researchers mapped 263 geo-referenced soil samples collected from the top 20 centimeters of agricultural and forest lands, uncovering sharp chemical variations over short distances. The findings highlight major hurdles for farmers trying to optimize fertilizer use in complex mountain environments.
How Soil Testing Reveals Hidden Deficiencies in Kaski Landscapes
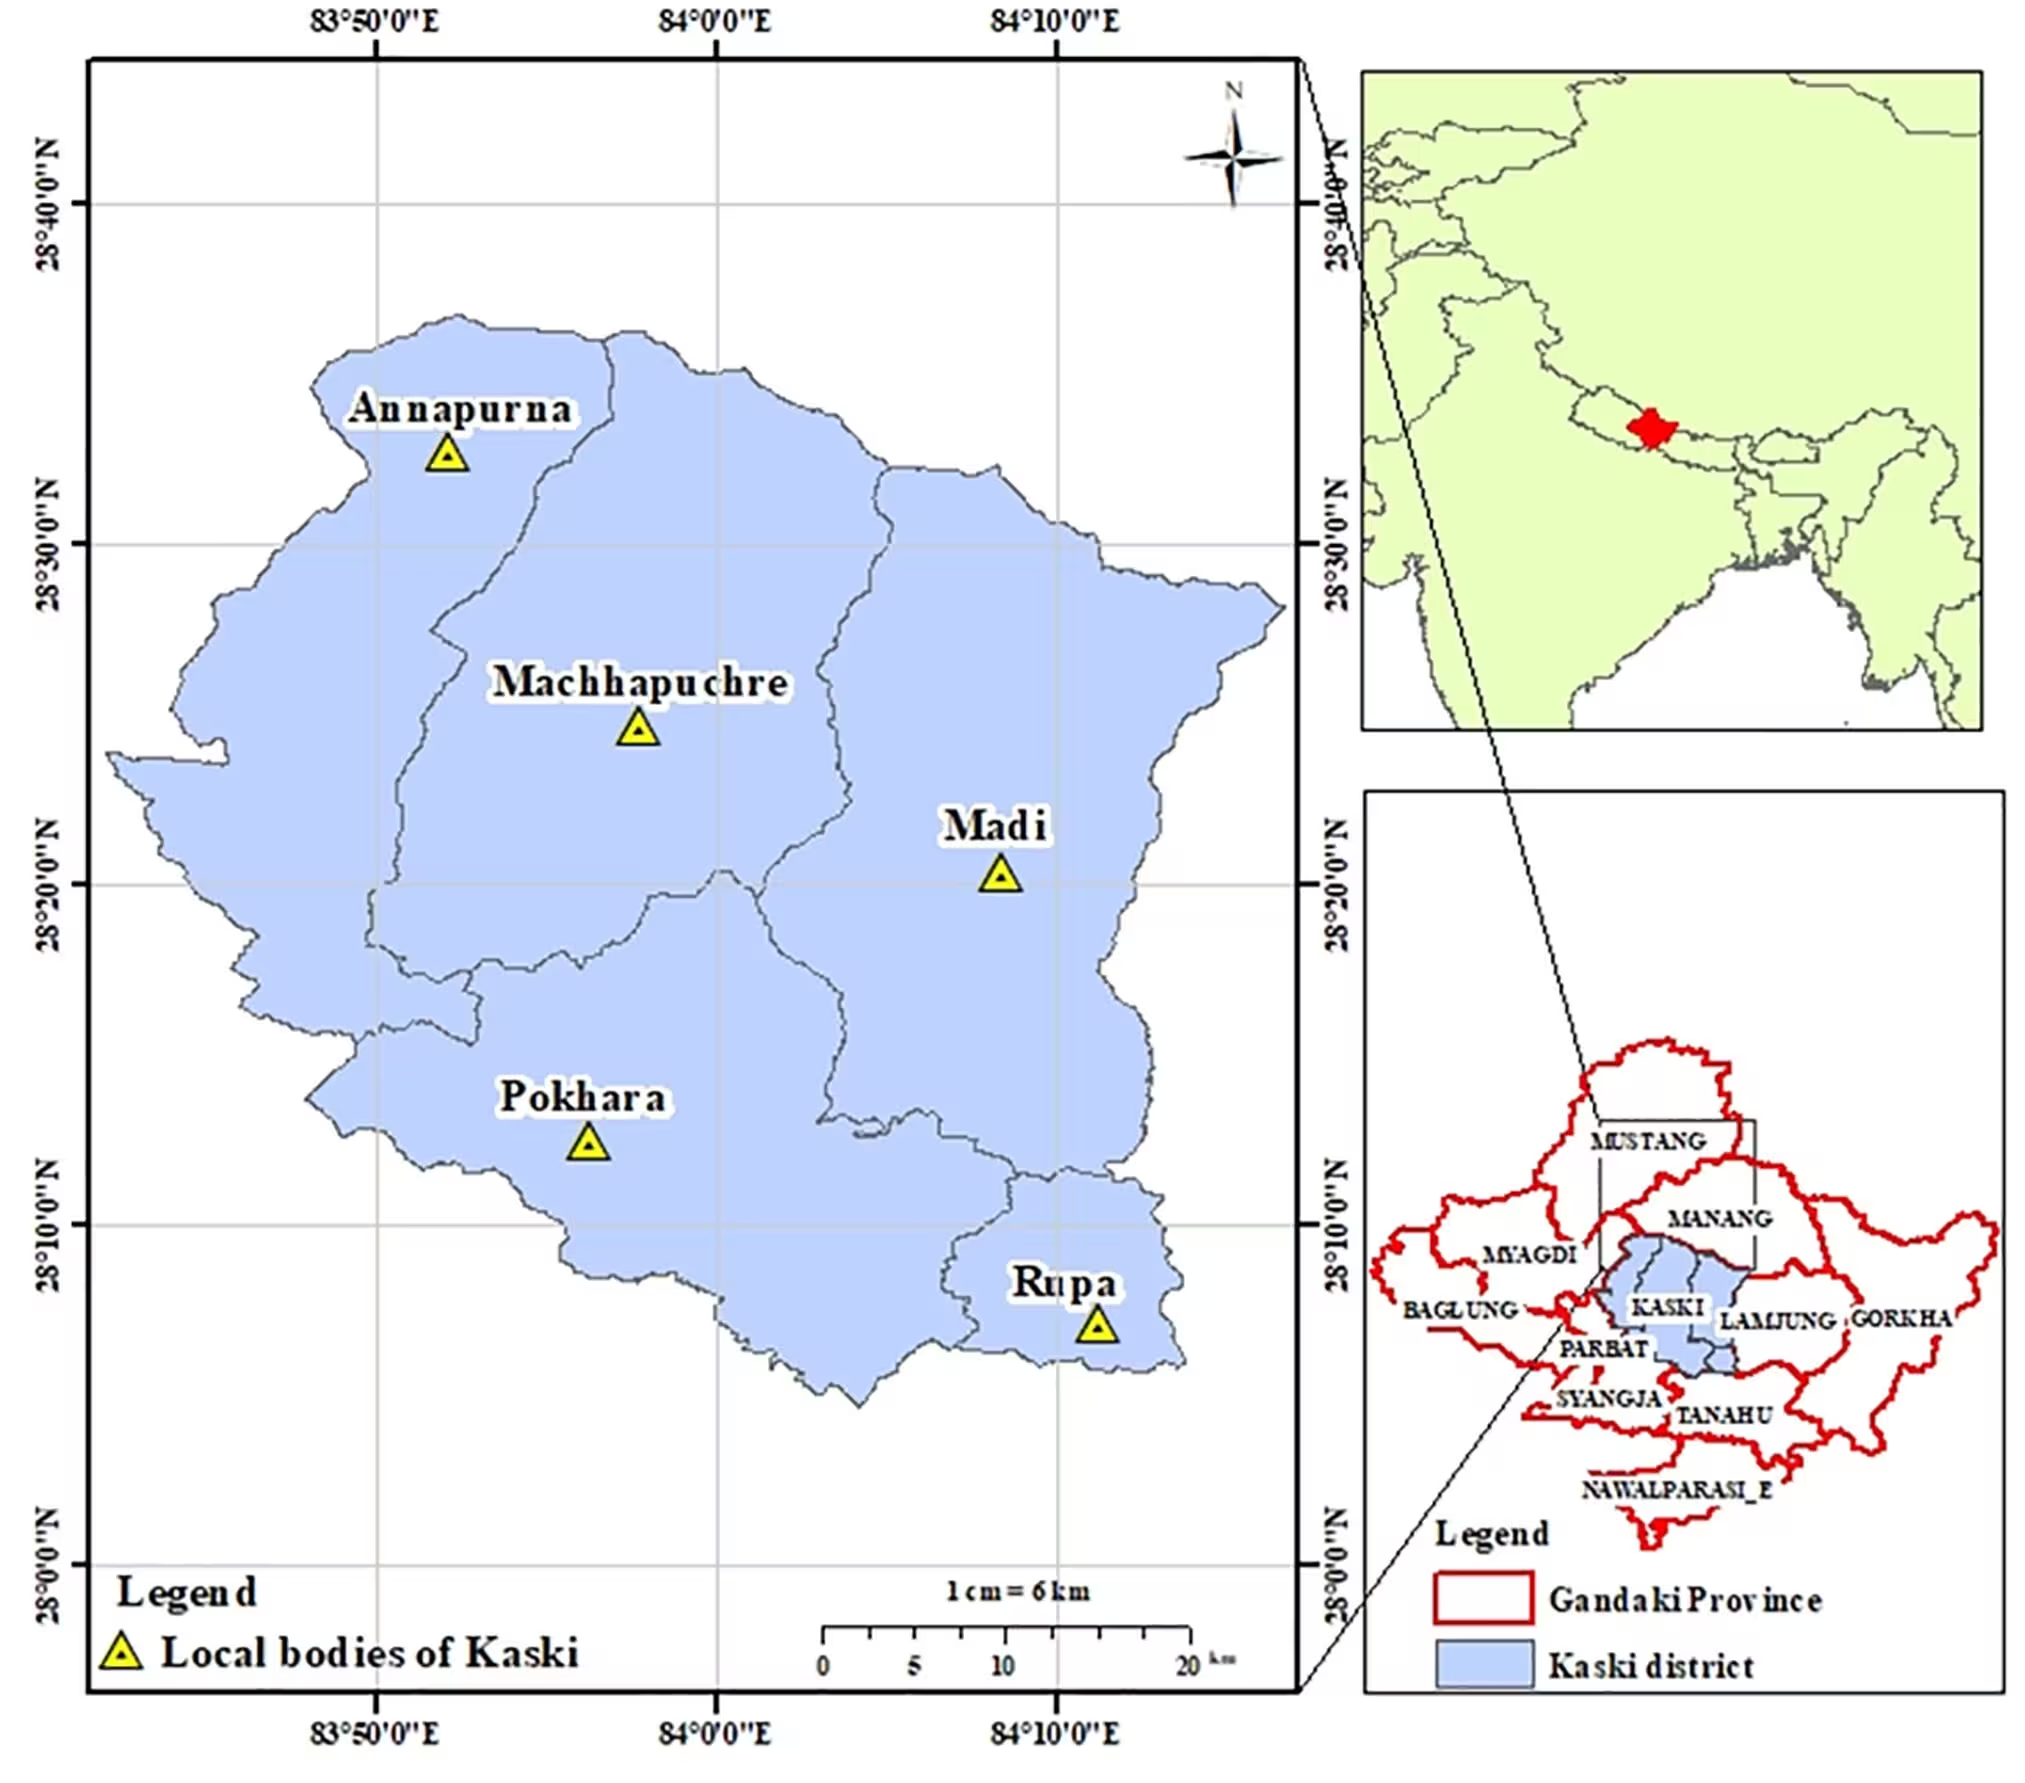
To understand the health of agricultural lands, a team led by Karishma Bhusal from the Province Agriculture Laboratory in Pokhara analyzed soil samples for essential chemical properties. The study, published in PLOS One, utilized geographic information systems to map soil pH, organic matter, total nitrogen, available phosphorus, and available potassium across the 2,017 square kilometer district. Because mountainous regions feature steep slopes and rapidly changing elevations, traditional uniform fertilizer strategies often fail to address local needs.
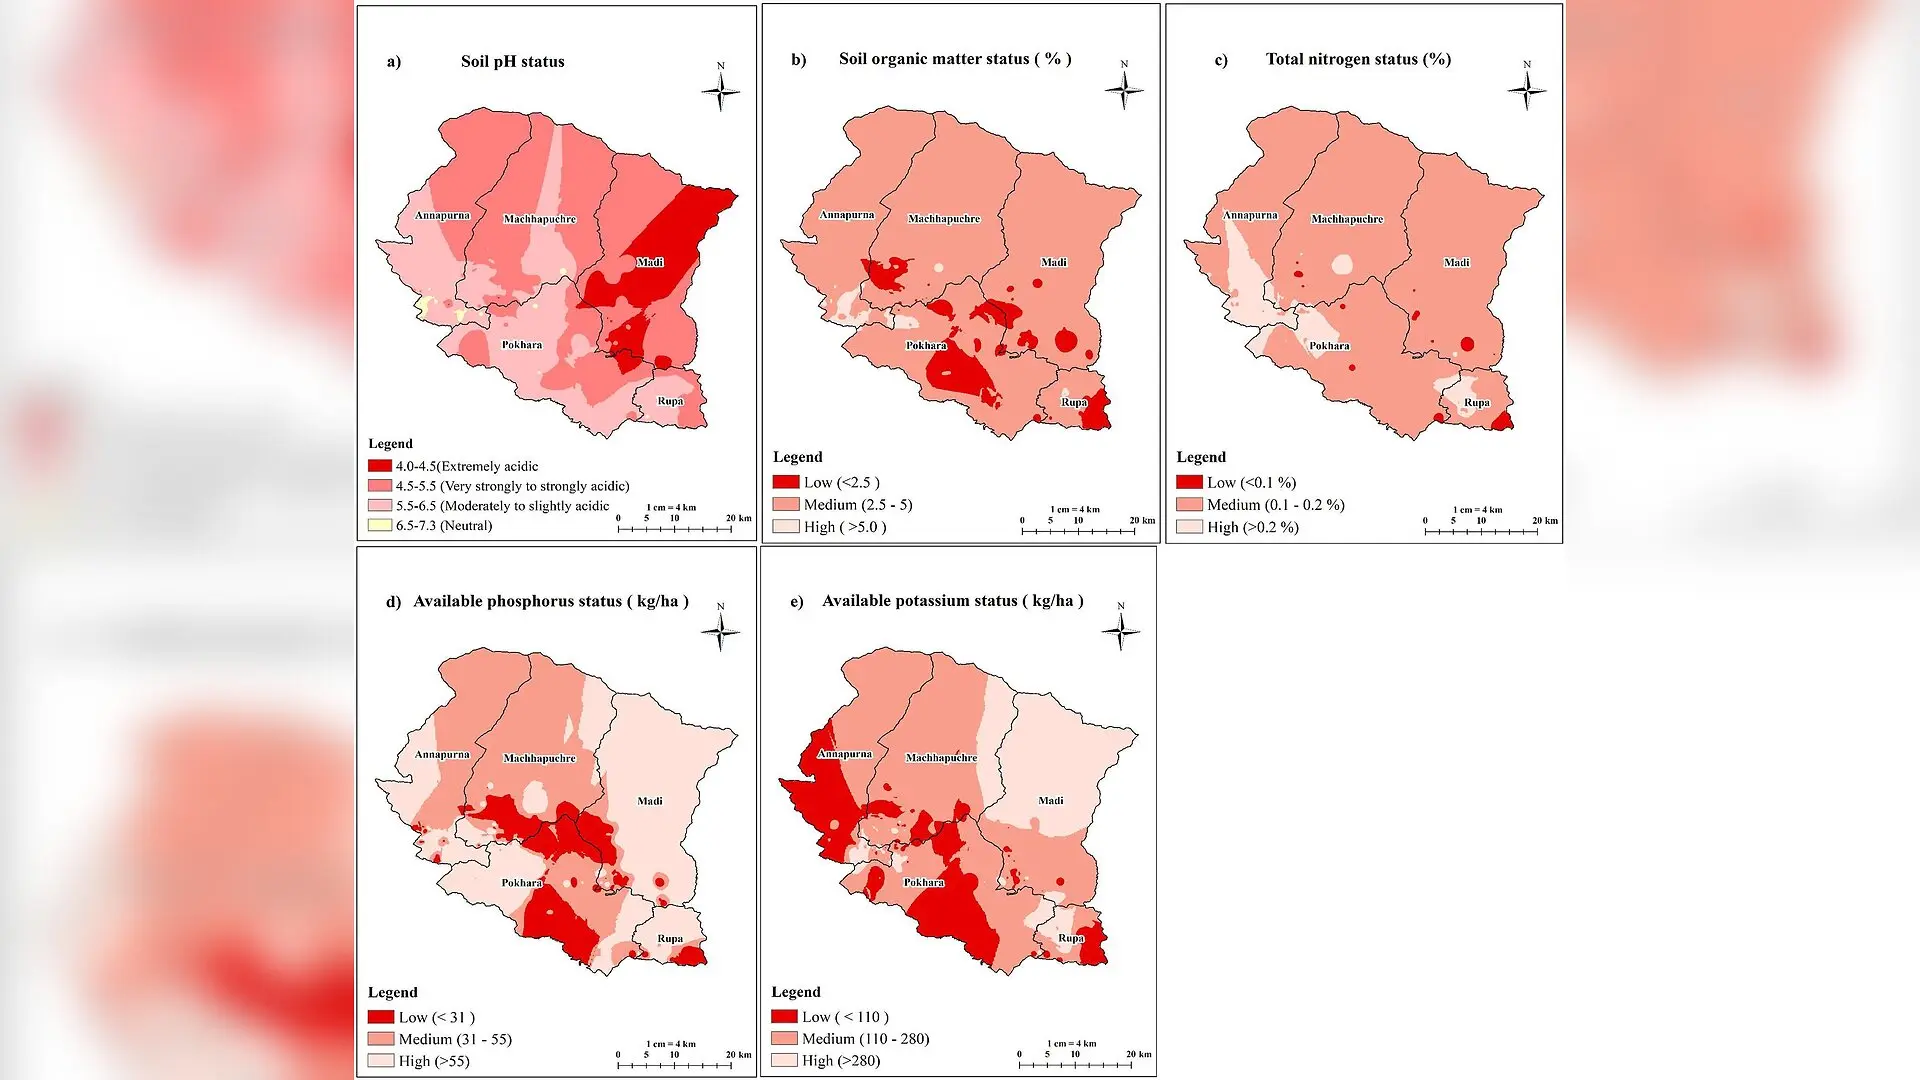
The analysis showed that soil acidity is a dominant issue across the district. Most tested soils fell into the moderately to strongly acidic category, with an overall mean pH of 5.48. Soil acidity restricts nutrient availability by locking up essential minerals, making it difficult for plants to absorb what they need for healthy growth. For instance, phosphorus availability drops significantly when soils become too acidic or too alkaline, as the chemical binds tightly with aluminum, iron, and calcium.
What Nutrient Indices and Spatial Mapping Reveal About Crop Health
To evaluate overall fertility, the researchers calculated soil nutrient index values for each chemical parameter. While soil organic matter, total nitrogen, and available phosphorus registered at medium fertility levels, available potassium scored a low index value of 1.61. This points to a widespread potassium deficiency throughout large portions of the district, particularly affecting high-coverage areas in the Pokhara Metropolitan City and the Annapurna Rural Municipality.
Potassium plays a critical role in plant growth, enzyme activation, and stress tolerance. When levels drop too low, crops struggle to manage water efficiently and resist diseases. Meanwhile, the study found that available phosphorus exhibited extreme spatial variation, with a coefficient of variation reaching 137.93 percent. Some locations recorded very low phosphorus numbers, while others showed high concentrations due to past management practices.
Why Topography Drives Distinct Fertility Patterns Across Valleys and Slopes
Spatial autocorrelation and trend analyses demonstrated that elevation and topography heavily influence how nutrients distribute across the landscape. Organic matter and total nitrogen tended to increase at higher altitudes, where cooler temperatures slow down the microbial decomposition of organic materials. Denser vegetation and accumulation of plant debris in these cooler zones help preserve organic carbon.
However, lower cultivable areas frequently suffered from nitrogen deficiencies due to runoff, leaching, and volatilization. Trend charts also revealed saddle-shaped distribution curves for pH, organic matter, and nitrogen, proving that local land-use patterns and slope gradients create patchworks of fertility rather than uniform regional zones. The authors note that these high-resolution fertility maps provide vital baseline data for municipal agriculture offices planning targeted fertilizer subsidies.
What Are the Limitations of the Soil Mapping Approach?
The authors acknowledge several constraints in their methodology. The dataset relied on a limited number of composite samples collected during a single season from the surface layer alone, which means seasonal fluctuations and deeper soil profiles were not captured. Additionally, the inverse distance weighting interpolation method used to generate continuous maps can introduce minor estimation errors in areas with sparse sampling. Future research incorporating higher sampling densities and micronutrient tracking will help refine agricultural recommendations for local growers.
The research was published in PLOS One on November 5, 2026.
This article has been fact checked for accuracy, with information verified against reputable sources. Learn more about us and our editorial process.
Last reviewed on .
Article history
- Latest version
Reference(s)
- Bhusal, Karishma., et al. “Spatial variability of soil fertility parameters in Kaski District, Nepal: A geostatistical approach.” PLOS One, vol. 21, no. 11, November 5, 2026, pp. e0360670 Public Library of Science (PLoS), doi: 10.1371/journal.pone.0360670. <https://doi.org/10.1371/journal.pone.0360670>.
Cite this page:
- Posted by Mary Ellison