Why Measuring Internal AI Mechanisms Fails Standard Tests
Technology

Why Measuring Internal AI Mechanisms Fails Standard Tests

New research shows that identical outward behavior can mask vast internal differences, while mathematical cliffs render standard point estimates fragile.
By James Whitmore
Published:
Email this Article
Why Measuring Internal AI Mechanisms Fails Standard Tests
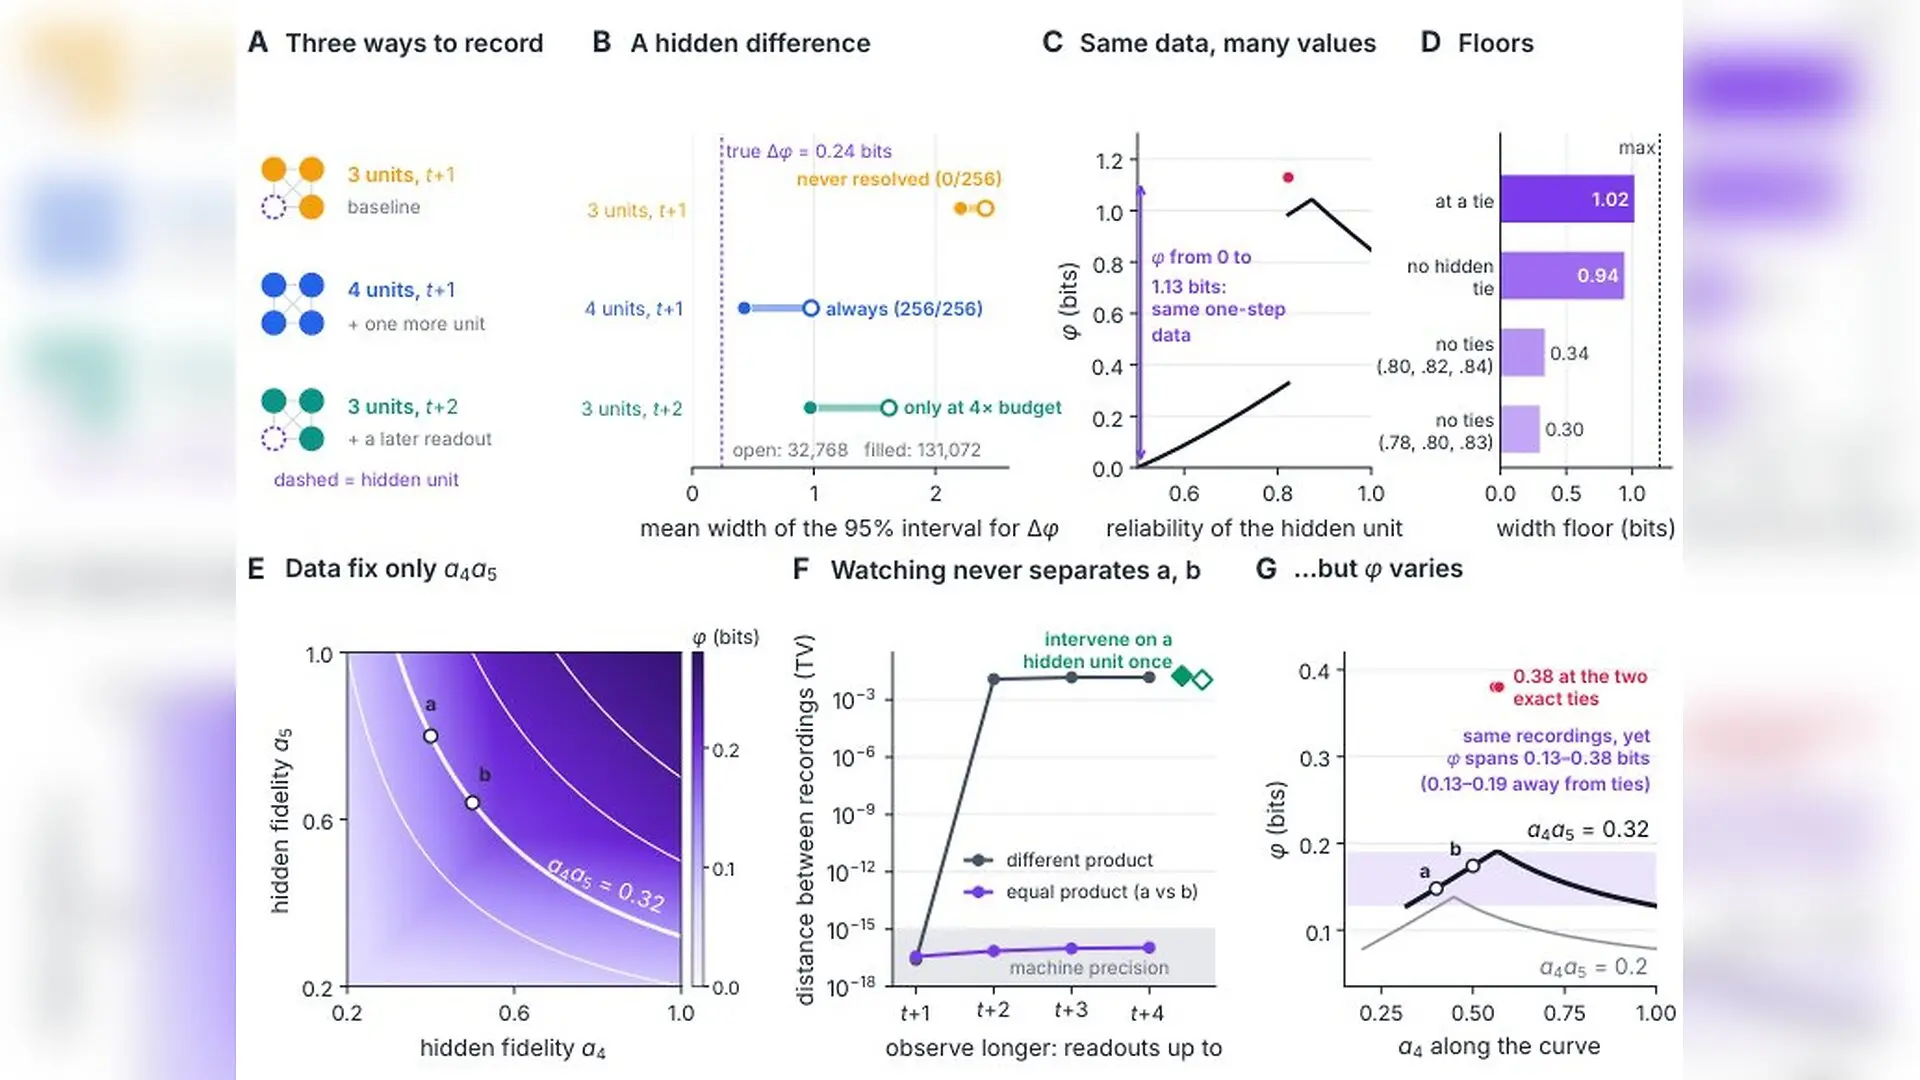
Hidden units: floors and symmetries. (A) Three designs record the four-unit parity network after the same intervention; the dashed unit is never recorded. (B) Mean width of 95%95\% intervals for Δ​φ\Delta\varphi between two conditions that differ only in the hidden unit (256 paired datasets per design and budget), and how often the sign of Δ​φ\Delta\varphi was resolved. Open and filled markers: budgets of 32,768 and 131,072 per condition; dashed line: the true Δ​φ=0.24\Delta\varphi=0.24 bits, for scale. (C) With recorded reliabilities fixed at 421/512421/512, every hidden reliability on the horizontal axis gives the same one-step recording of units 1–3, so every value of φ\varphi on the curve and at the red dot (the exact four-way tie), from 00 to 1.131.13 bits, is compatible with the data. A valid 95%95\% interval must contain each of these values with probability at least 0.950.95, which gives the floor in D. (D) Lower bounds on the expected width of any 95%95\% interval (Proposition Linqian Wu et al. / arXiv

When two complex systems compute the exact same function, telling them apart requires looking far beneath their outward behavior. Researchers investigating how internal architecture dictates system properties such as integrated information have revealed that standard behavioral tests can be entirely blind to crucial internal differences.

The new study, available on the arXiv preprint server, demonstrates that measuring deep causal properties is fraught with hidden mathematical traps. Led by researchers Linqian Wu and Diaoxuan He, the work examines why finite experiments often fail to capture internal metrics accurately, establishing a rigorous framework to determine what observations and interventions can actually prove.

The Silent Disconnect Between Behavior and Internal Causal Organization

To understand why external actions can mislead observers, the authors analyzed pairs of small stochastic networks. In one key demonstration, a recurrent network and a feed-forward chain were shown to produce identical input-output laws across all 16 initial states. Despite this identical outward behavior, their integrated information levels stood at 0.28 bits and 0 bits, respectively.
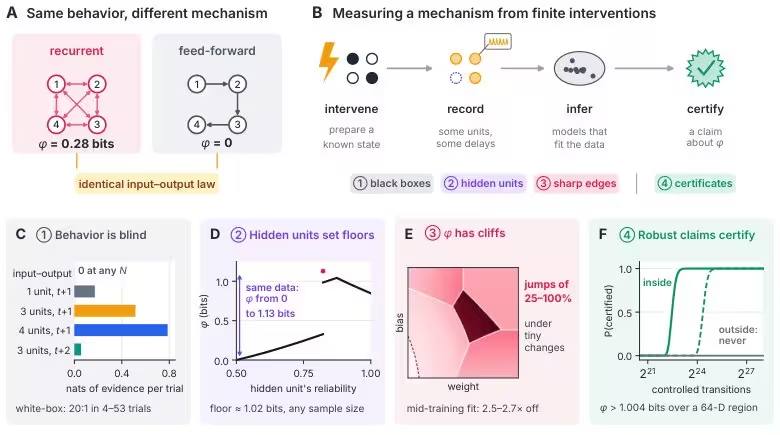
Figure 1: Three barriers and one way through. (A) A recurrent network and a feed-forward chain with identical input–output laws at their response delay differ in integrated information φ\varphi. (B) An experiment prepares known states, records some units after some delay, infers the mechanisms compatible with the data and reports a claim about φ\varphi. Three barriers limit what any such experiment can establish; robust claims can still be certified. (C) Input–output data carry no evidence about the difference in A at any number of trials, whereas recording internal units yields evidence at every trial (expected evidence between the two fully specified systems; Section 3). (D) When one unit is hidden from a one-step recording, every point on the curve and the red dot (the exact four-way tie; φ\varphi from 00 to 1.131.13 bits) is compatible with the same recordings, so a valid 95%95\% interval must contain each of these values with probability at least 0.950.95 and has expected width of at least
Three barriers and one way through. (A) A recurrent network and a feed-forward chain with identical input–output laws at their response delay differ in integrated information φ\varphi. (B) An experiment prepares known states, records some units after some delay, infers the mechanisms compatible with the data and reports a claim about φ\varphi. Three barriers limit what any such experiment can establish; robust claims can still be certified. (C) Input–output data carry no evidence about the difference in A at any number of trials, whereas recording internal units yields evidence at every trial (expected evidence between the two fully specified systems; Section 3). (D) When one unit is hidden from a one-step recording, every point on the curve and the red dot (the exact four-way tie; φ\varphi from 00 to 1.131.13 bits) is compatible with the same recordings, so a valid 95%95\% interval must contain each of these values with probability at least 0.950.95 and has expected width of at least Credit: Linqian Wu et al. / arXiv

Behavioral data yielded zero evidence of this difference regardless of how many trials were run. Only by recording internal units did the expected log-likelihood ratio shift in favor of the true system, reaching meaningful statistical confidence after about 17 trials. The authors point out that this mimicry requires no intentional deception, as complex systems can be entirely silent about their internal wiring while matching external performance.

Hidden Units and the Limits of Partial Observations

Complete internal access is rarely achievable in biological brains or large artificial intelligence audits. When researchers leave certain units unrecorded, partial observation creates severe identification floors that no increase in sample size can lower.

In parity network experiments, leaving a single unit unrecorded meant that multiple distinct mechanisms produced identical data. This left confidence intervals spanning up to 1.02 bits, representing 84 percent of the largest value a four-unit system can take. Furthermore, in networks with several hidden units, observations of recorded trajectories depended only on the product of the hidden units’ fidelities. This product symmetry ensured that prolonged observation of the same units could never separate configurations with equal products, though a single targeted intervention successfully broke the symmetry.
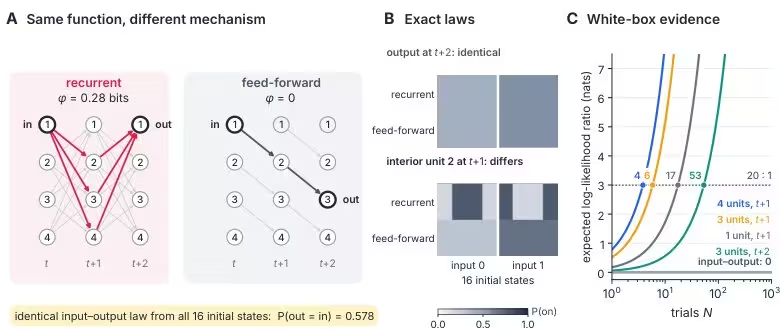
Figure 2: Same function, different mechanism. (A) The recurrent parity network (φ=0.28\varphi=0.28 bits) and the feed-forward chain (φ=0\varphi=0) unrolled over two updates. Highlighted arrows (red in the recurrent network, dark in the chain) trace how the input (unit 1 at tt) reaches the output: through every other unit in the recurrent network, along a single path in the chain. (B) Exact probability that a unit is on, from each of the 16 initial states, grouped by the input bit. Top: the output (unit 1 of the recurrent network, unit 3 of the chain) at t+2t{+}2 coincides in the two systems. Bottom: interior unit 2 at t+1t{+}1 differs. (C) Expected log-likelihood ratio (nats) in favor of the recurrent network, when it is the true system, as trials accumulate, for four internal recordings (sensor error 0.100.10; both systems known; balanced interventions). Markers show where the expected log-likelihood ratio reaches ln⁡20\ln 20 (odds of 20:1), labeled with the number of trials. Input–output data
Same function, different mechanism. (A) The recurrent parity network (φ=0.28\varphi=0.28 bits) and the feed-forward chain (φ=0\varphi=0) unrolled over two updates. Highlighted arrows (red in the recurrent network, dark in the chain) trace how the input (unit 1 at tt) reaches the output: through every other unit in the recurrent network, along a single path in the chain. (B) Exact probability that a unit is on, from each of the 16 initial states, grouped by the input bit. Top: the output (unit 1 of the recurrent network, unit 3 of the chain) at t+2t{+}2 coincides in the two systems. Bottom: interior unit 2 at t+1t{+}1 differs. (C) Expected log-likelihood ratio (nats) in favor of the recurrent network, when it is the true system, as trials accumulate, for four internal recordings (sensor error 0.100.10; both systems known; balanced interventions). Markers show where the expected log-likelihood ratio reaches ln⁡20\ln 20 (odds of 20:1), labeled with the number of trials. Input–output data Credit: Linqian Wu et al. / arXiv

Mathematical Cliffs and the Fragility of Metric Estimates

Even with complete white-box access, a third barrier emerges from the mathematics of the measure itself. When a metric selects an object by one criterion and reports another, infinitesimal changes in parameters can trigger massive discontinuous jumps in the final score.

Scanning random parameter spaces across hundreds of networks, the authors found that 99 percent of these selection edges changed the measured integrated information by 25 to 100 percent of its value. Near these sharp edges, standard point estimators became unreliable. Surrogate models trained via machine learning to fit interventional data almost perfectly still misreported the target value by more than 20 percent in a significant fraction of trials, remaining trapped near edge-induced errors even as their predictive divergence dropped.
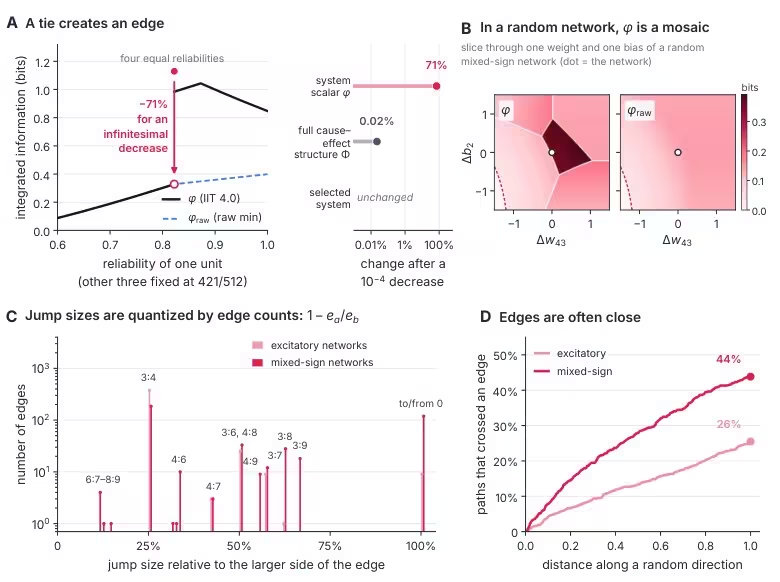
Figure 4: Sharp edges are common. (A) φ\varphi (solid) and φraw\varphi_{\mathrm{raw}} (dashed) of the parity network as one unit’s reliability varies with the other three at 421/512421/512; left of the tie the two coincide. At the four-way tie φ=1.13\varphi=1.13 bits (filled dot); an arbitrarily small decrease gives 0.330.33 bits (open dot, the one-sided limit), and larger decreases give less. Right: over the same 10−410^{-4} perturbation the full cause–effect structure (Φ\Phi, summed over all its distinctions and relations) changes by 0.02%0.02\% and the selected system not at all. (B) φ\varphi and φraw\varphi_{\mathrm{raw}} over a two-dimensional slice through one weight and one bias of a random mixed-sign network (dot: the network). White lines mark discontinuities from partition selection, where the selected cut changes its number of severed connections; the dashed line marks a switch of the specified states, across which φ\varphi and φraw\varphi_{\mathrm{raw}} both jump to zero. (C) Sizes o
Sharp edges are common. (A) φ\varphi (solid) and φraw\varphi_{\mathrm{raw}} (dashed) of the parity network as one unit’s reliability varies with the other three at 421/512421/512; left of the tie the two coincide. At the four-way tie φ=1.13\varphi=1.13 bits (filled dot); an arbitrarily small decrease gives 0.330.33 bits (open dot, the one-sided limit), and larger decreases give less. Right: over the same 10−410^{-4} perturbation the full cause–effect structure (Φ\Phi, summed over all its distinctions and relations) changes by 0.02%0.02\% and the selected system not at all. (B) φ\varphi and φraw\varphi_{\mathrm{raw}} over a two-dimensional slice through one weight and one bias of a random mixed-sign network (dot: the network). White lines mark discontinuities from partition selection, where the selected cut changes its number of severed connections; the dashed line marks a switch of the specified states, across which φ\varphi and φraw\varphi_{\mathrm{raw}} both jump to zero. (C) Sizes o Credit: Linqian Wu et al. / arXiv

Certifying Robust Claims Through Bounded Regions

Because point estimates fail near edges, the researchers propose shifting the objective from point estimation to certifying one-sided bounds. By proving mathematical guarantees over entire multidimensional regions of parameters, investigators can establish lower bounds that remain valid even when individual parameters sit close to an edge.

Through exact statistical enclosures, the team demonstrated that membership in a robust high-integration region could be certified using millions of controlled transitions while keeping false-certificate probabilities below desired significance thresholds. This approach mirrors certified robustness techniques used in neural network verification, substituting point guesswork with verifiable domain constraints.

The study was posted to the arXiv preprint server on November 5, 2026.

Fact Checked

This article has been fact checked for accuracy, with information verified against reputable sources. Learn more about us and our editorial process.

Last reviewed on .

Article history

  • Latest version

Reference(s)

  1. Wu, Linqian. “Same Behavior, Different Mechanism: What Finite Experiments Can Certify About Integrated Information.” arXiv.org <http://arxiv.org/abs/2611.08469v1>.

Cite this page:

Whitmore, James. “Why Measuring Internal AI Mechanisms Fails Standard Tests.” BioScience. BioScience ISSN 2521-5760, 08 November 2026. <https://www.bioscience.com.pk/en/subject/technology/same-behavior-different-mechanism-what-finite-experiments-can-certify-about-integrated-information>. Whitmore, J. (2026, November 08). “Why Measuring Internal AI Mechanisms Fails Standard Tests.” BioScience. ISSN 2521-5760. Retrieved November 08, 2026 from https://www.bioscience.com.pk/en/subject/technology/same-behavior-different-mechanism-what-finite-experiments-can-certify-about-integrated-information Whitmore, James. “Why Measuring Internal AI Mechanisms Fails Standard Tests.” BioScience. ISSN 2521-5760. https://www.bioscience.com.pk/en/subject/technology/same-behavior-different-mechanism-what-finite-experiments-can-certify-about-integrated-information (accessed November 08, 2026).
End of the article