Viral Infection Triggers RNA Tagging to Hijack Host Energy Metabolism
Chemistry

Viral Infection Triggers RNA Tagging to Hijack Host Energy Metabolism

A newly mapped molecular feedback loop shows how crustacean pathogens exploit chemical tags on messenger RNA to drive glycolysis and replication.
By Bilal Abbasi
Published:
Email this Article
Viral Infection Triggers RNA Tagging to Hijack Host Energy Metabolism
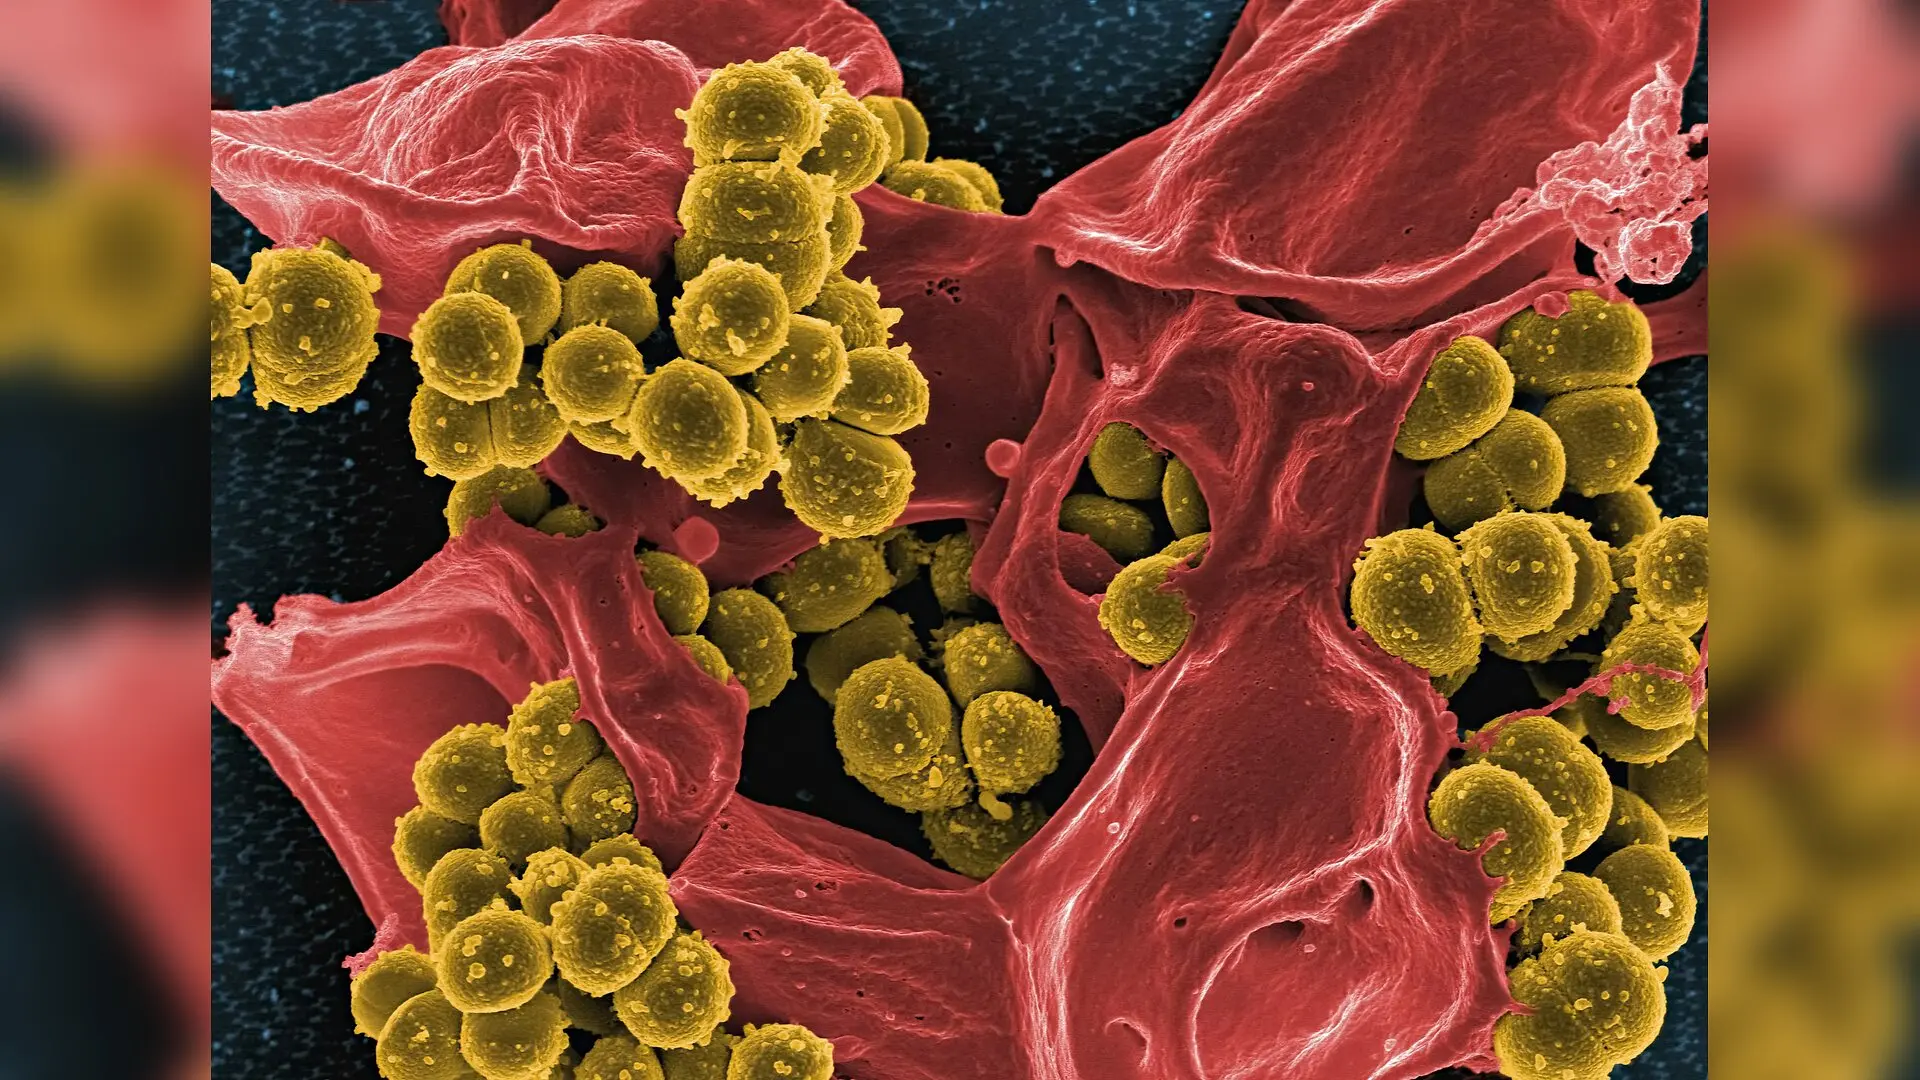
Photo by National Institute of Allergy and Infectious Diseases on Unsplash

When shrimp are infected by a deadly pathogen, their cells undergo a dramatic metabolic shift that turns normal cellular machinery into a virus-manufacturing engine. Researchers have now uncovered how a chemical tag on genetic material drives this process, revealing a clever feedback loop that helps the virus multiply.

The study, published in PLOS Pathogens, focuses on white spot syndrome virus, a major threat to global aquaculture that causes high mortality rates in crustaceans. As an obligate intracellular pathogen, the virus relies entirely on the host organism to supply energy and building blocks for its own replication. Scientists have long known that viral infections boost aerobic glycolysis, a metabolic process that breaks down glucose rapidly to generate cellular energy and chemical precursors.

How Viral Invasion Triggers Chemical Tags on RNA

To understand what happens inside infected cells, the research team tracked key metabolites in the hemocytes, which are circulating immune cells and the primary targets of the virus. Following infection with white spot syndrome virus, glucose levels remained relatively stable, but lactate levels surged significantly. Measurements also showed elevated activities of crucial enzymes that drive the glycolytic pathway, indicating that enhanced energy production is vital for viral proliferation.

To test whether this metabolic boost depends on glycolysis, the team injected shrimp with 2-deoxyglucose, a well-known glycolysis inhibitor. This intervention significantly reduced lactate production, impaired viral replication, and lowered mortality rates among the infected animals. The findings point to host glycolysis as an essential requirement for successful infection.
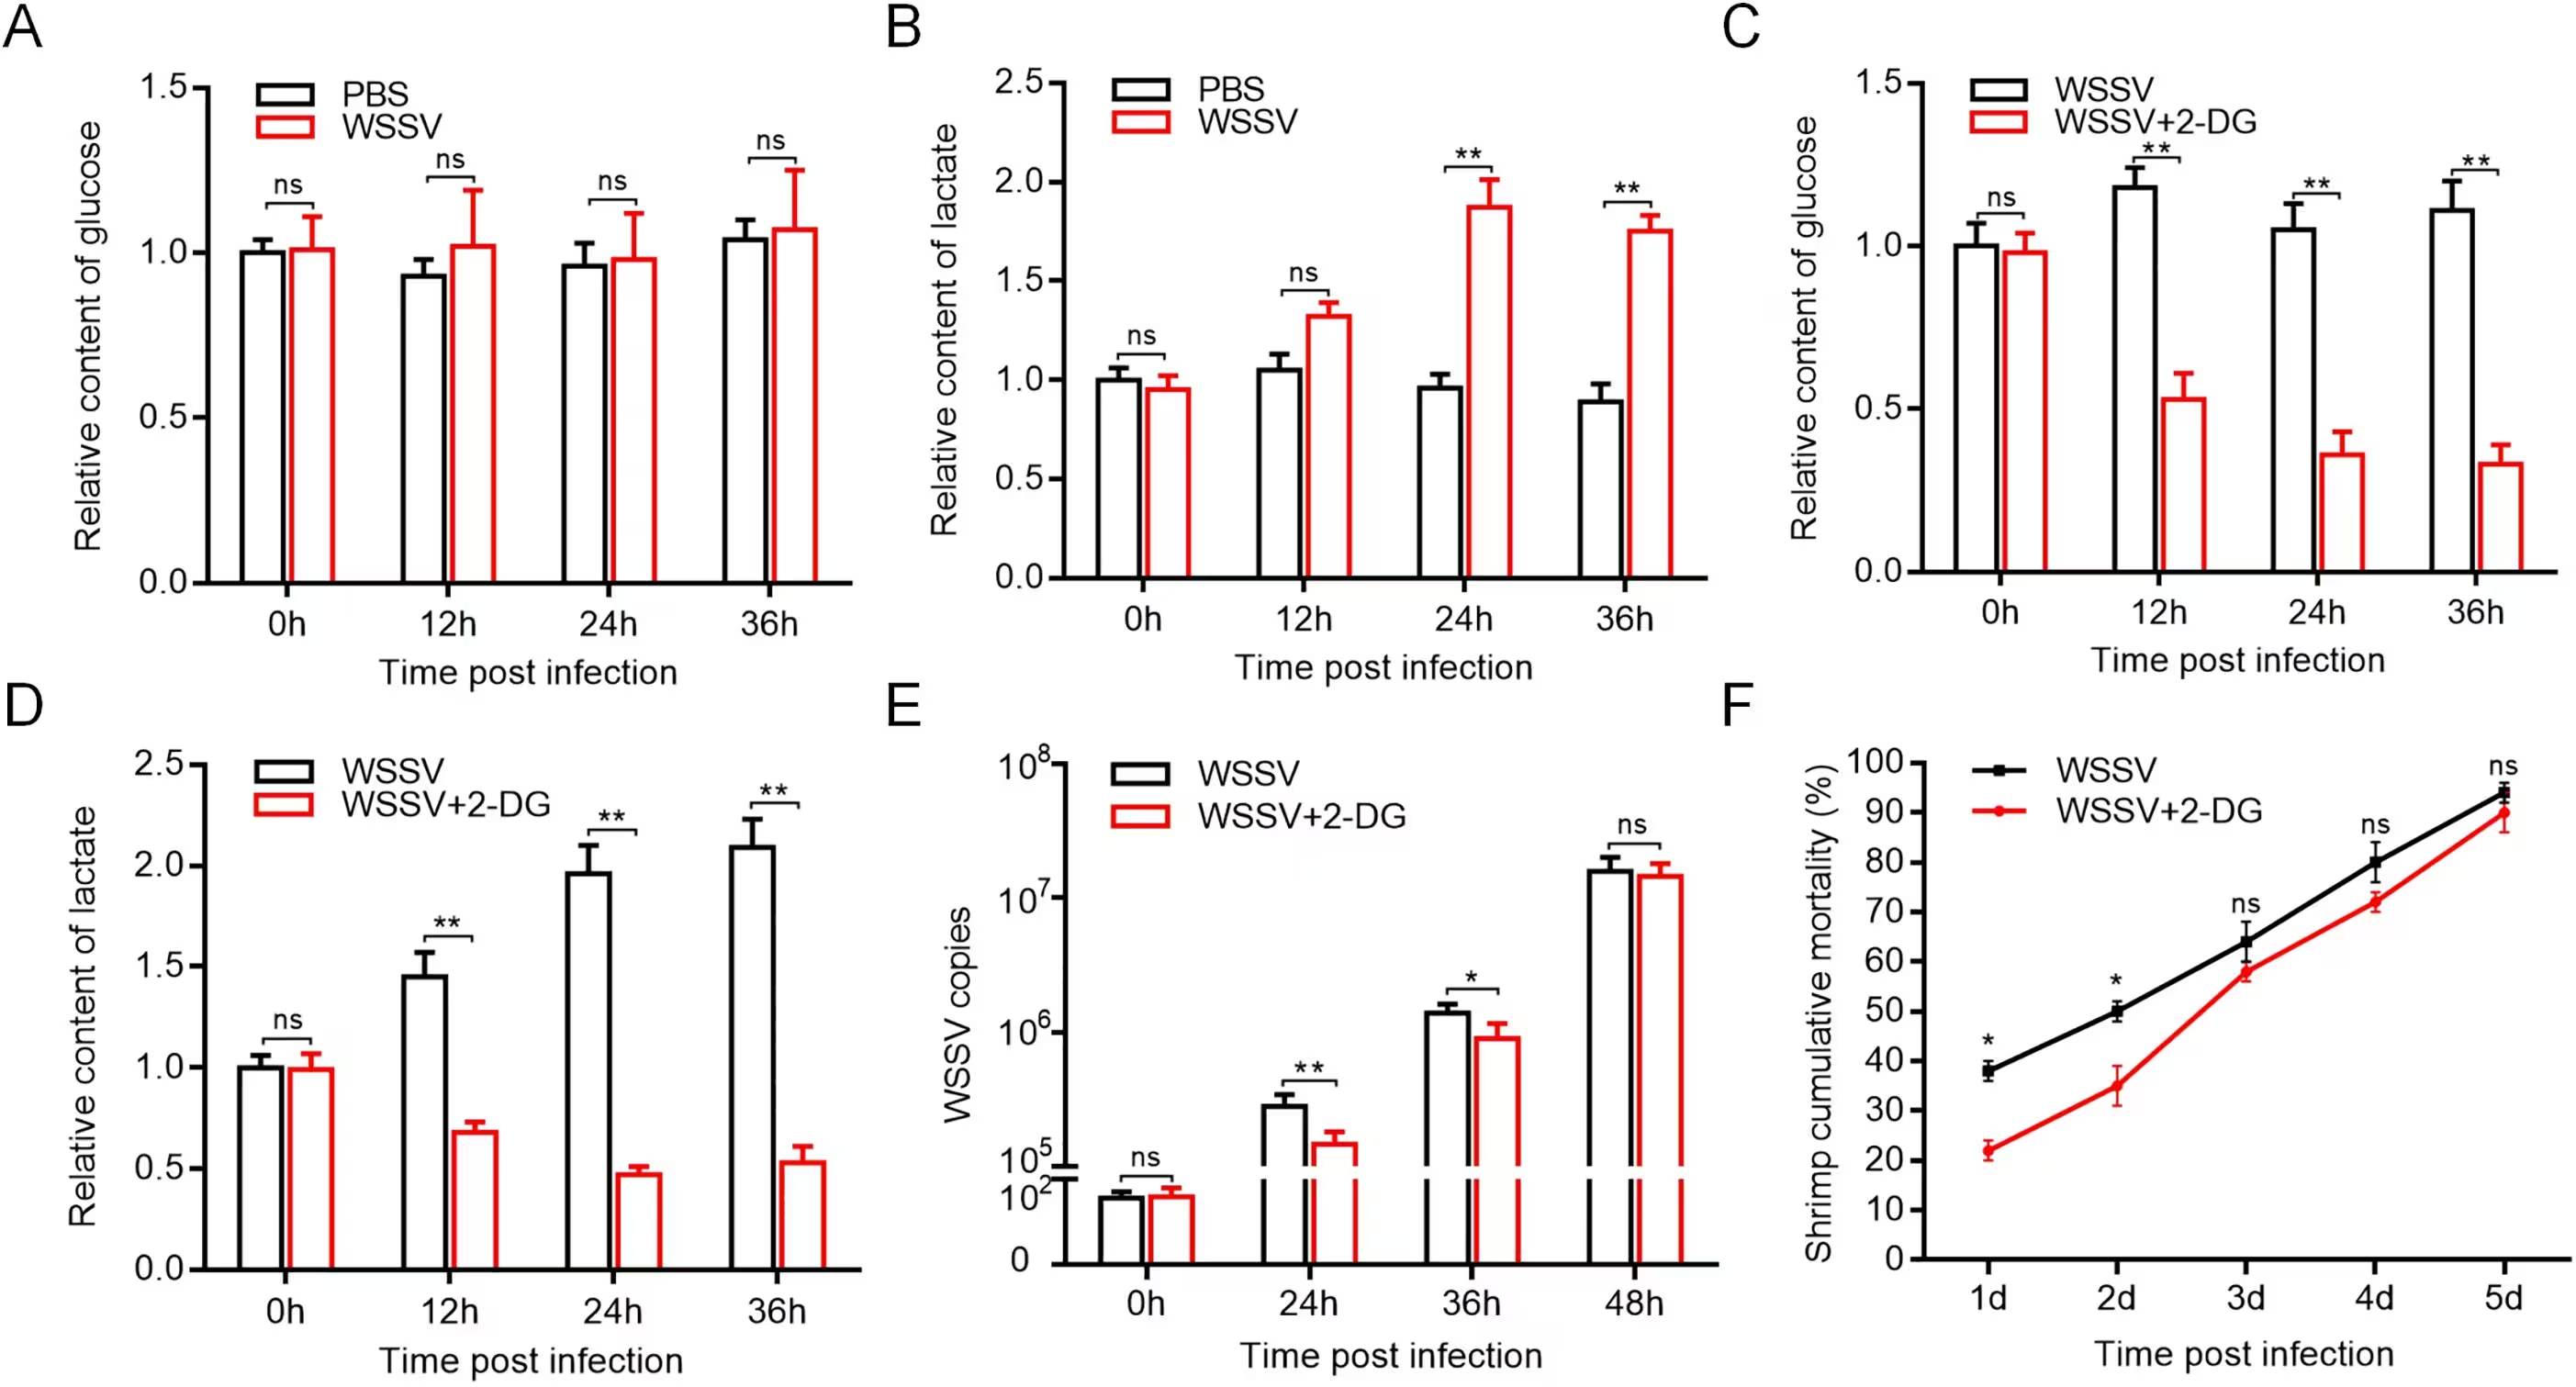
Fig 1: Glycolysis is required for WSSV infection in shrimp. (A) The impact of WSSV infection on the content of glucose in shrimp. Shrimp were injected with WSSV or PBS. At different times after injection, the content of glucose in the hemocytes of shrimp was examined. The error bars denote the means ± standard deviation of three independent experiments. (B) The influence of WSSV infection on the content of lactate in shrimp (**, p < 0.01). (C) The content of glucose in the hemocytes of WSSV infected shrimp after injection of the glycolysis inhibitor 2-deoxyglucose (2-DG). PBS was included in the injection as a control (**, p < 0.01). (D) The content of lactate in shrimp after using the 2-DG (**, p < 0.01). (E) Influence of glycolysis inhibition on WSSV infection in shrimp. The WSSV copies were quantified using quantitative real-time PCR at different times post-infection (*, p < 0.05; **, p < 0.01). (F) Effects of glycolysis inhibition on the mortality of WSSV infected shrimp. The numbers on t
Glycolysis is required for WSSV infection in shrimp. (A) The impact of WSSV infection on the content of glucose in shrimp. Shrimp were injected with WSSV or PBS. At different times after injection, the content of glucose in the hemocytes of shrimp was examined. The error bars denote the means ± standard deviation of three independent experiments. (B) The influence of WSSV infection on the content of lactate in shrimp (**, p < 0.01). (C) The content of glucose in the hemocytes of WSSV infected shrimp after injection of the glycolysis inhibitor 2-deoxyglucose (2-DG). PBS was included in the injection as a control (**, p < 0.01). (D) The content of lactate in shrimp after using the 2-DG (**, p < 0.01). (E) Influence of glycolysis inhibition on WSSV infection in shrimp. The WSSV copies were quantified using quantitative real-time PCR at different times post-infection (*, p < 0.05; **, p < 0.01). (F) Effects of glycolysis inhibition on the mortality of WSSV infected shrimp. The numbers on t Credit: Xumei Sun et al. / PLOS Pathogens

The Role of Methyltransferase METTL3 in Gene Stability

Seeking the molecular driver behind this metabolic reprogramming, the investigators examined N6-methyladenosine, the most common chemical modification found on messenger RNA in eukaryotes. Following viral exposure, overall RNA methylation levels increased markedly, accompanied by a sharp upregulation of a key enzyme called methyltransferase-like 3, or METTL3. While METTL3 normally resides primarily in the cytoplasm, microscopic imaging and subcellular fractionation revealed that viral infection causes it to translocate into the nucleus.

When the researchers knocked down METTL3 expression using sequence-specific small interfering RNA, the total methylation levels dropped, lactate accumulation fell, and viral replication slowed down considerably. High-throughput sequencing identified lactate dehydrogenase, the enzyme responsible for converting pyruvate into lactate, as a direct downstream target of METTL3-mediated methylation.
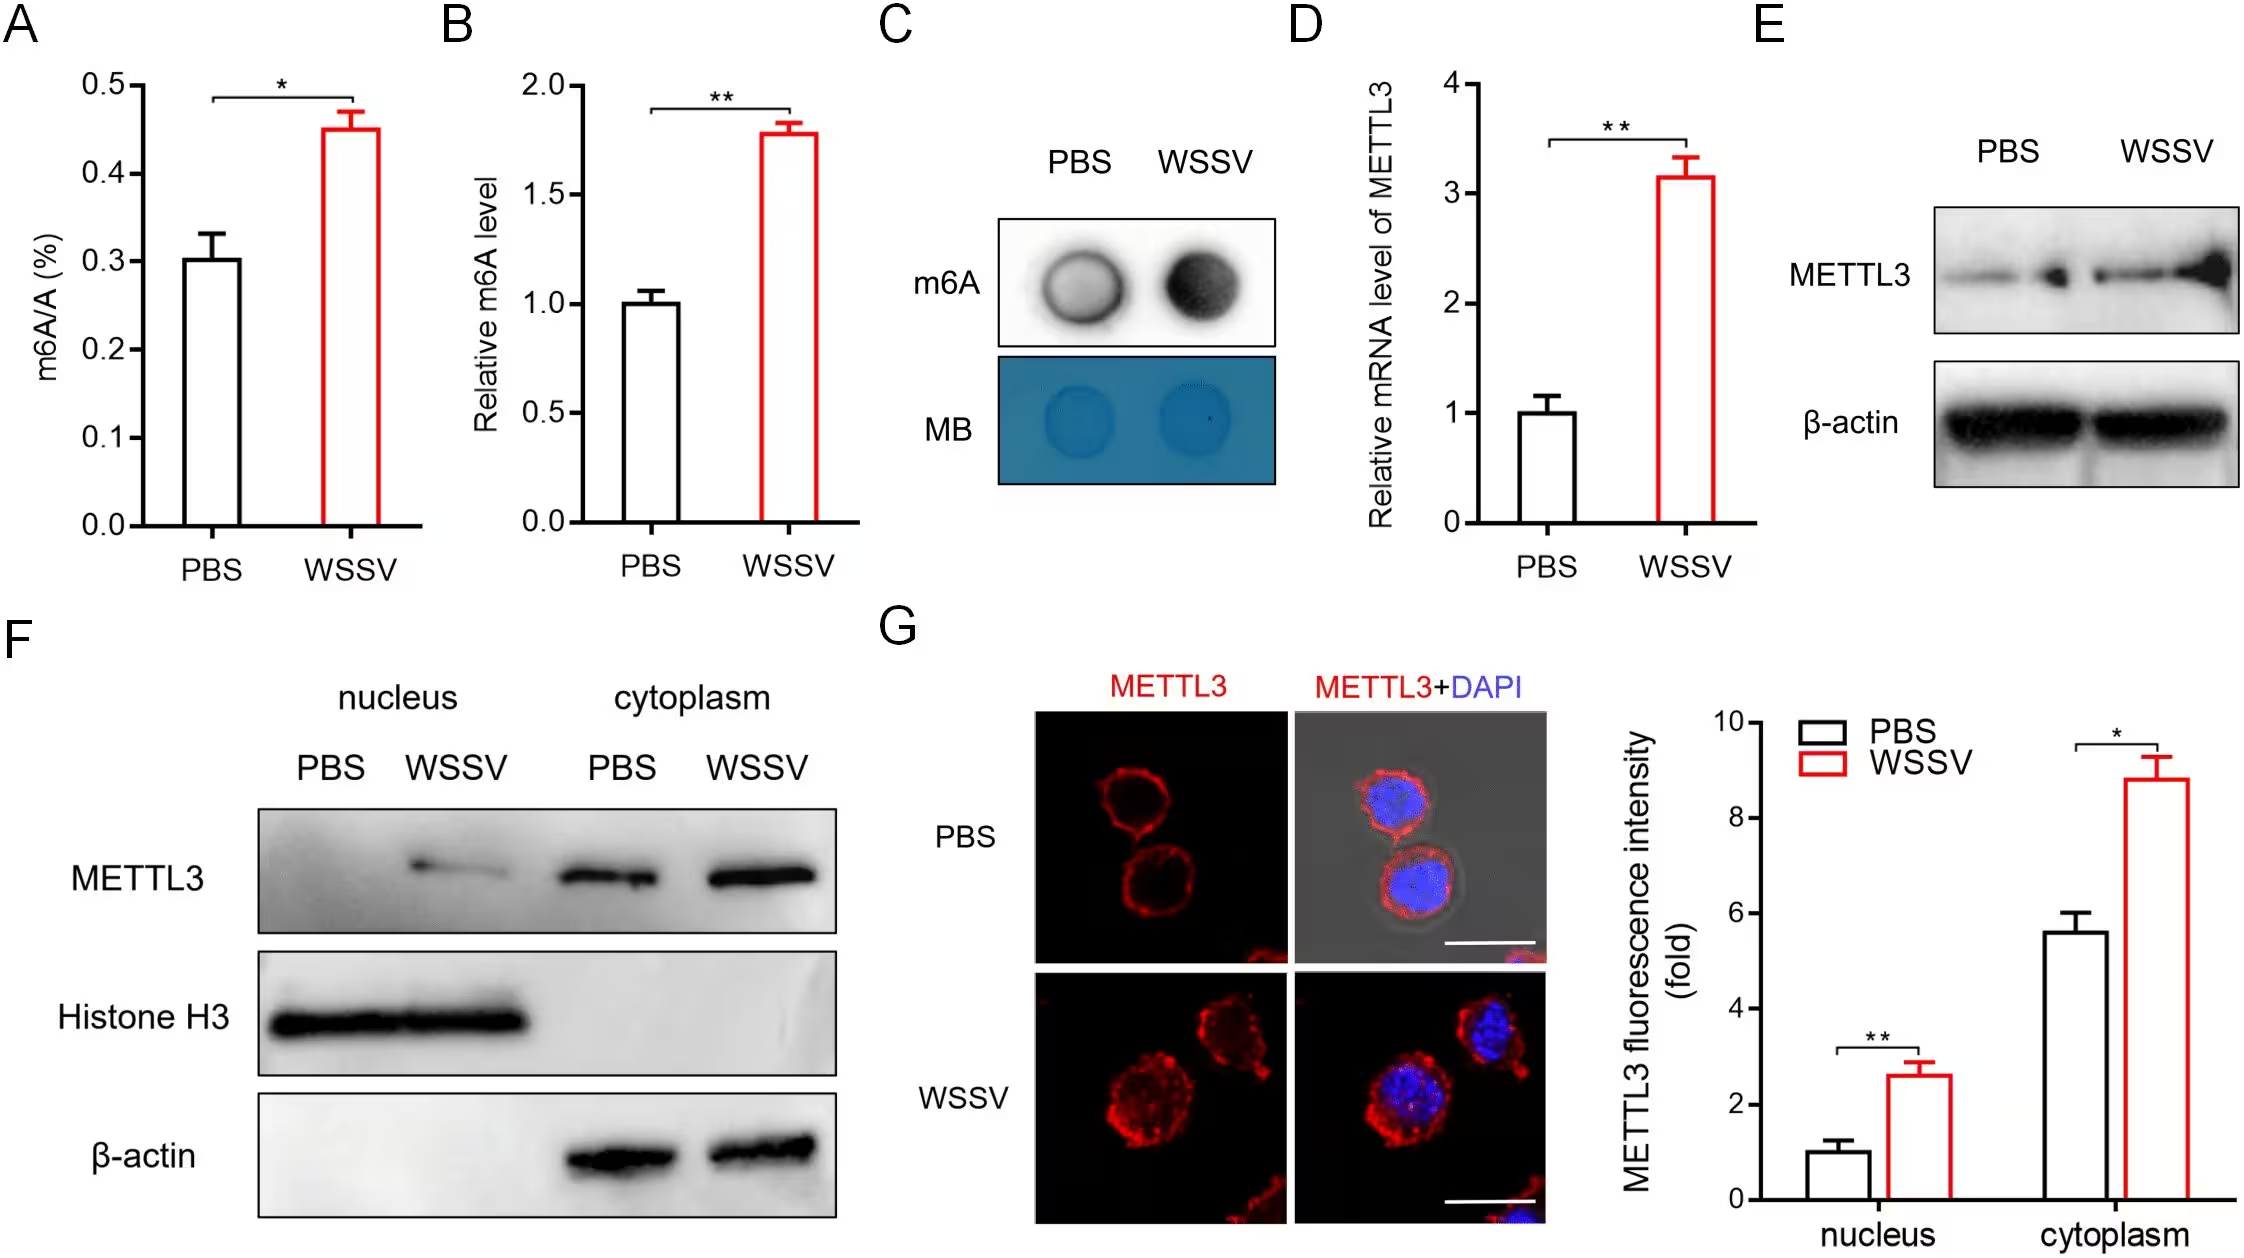
Fig 2: Shrimp METTL3 expression and cellular localization are changed in response to WSSV infection. (A) LC-MS/MS quantification of the m6A/A ratio in shrimp hemocytes at 24 h after WSSV infection (*, p < 0.05). (B) The global m6A levels in shrimp hemocytes at 24 h after WSSV infection were measured by the m6A RNA Methylation Quantification Kit (**, p < 0.01). (C) m6A dot blot in total RNA from shrimp hemocytes at 24 h after WSSV infection. Methylene blue (MB) indicated the loading control. (D) Relative mRNA levels of METTL3 in virus-free and WSSV-infected shrimp. At 24 h after WSSV infection, the expression level of shrimp METTL3 was detected using quantitative real-time PCR (**, p < 0.01). (E) Western blot analysis of METTL3 in virus-free and WSSV-infected shrimp, β-actin was used as a control. (F) Expression of METTL3 in nuclear and cytoplasm of shrimp hemocytes. The purity of nuclear and cytoplasm was determined by Western blot using Histone H3 and β-actin antibody, respectively. (G) Repr
Shrimp METTL3 expression and cellular localization are changed in response to WSSV infection. (A) LC-MS/MS quantification of the m6A/A ratio in shrimp hemocytes at 24 h after WSSV infection (*, p < 0.05). (B) The global m6A levels in shrimp hemocytes at 24 h after WSSV infection were measured by the m6A RNA Methylation Quantification Kit (**, p < 0.01). (C) m6A dot blot in total RNA from shrimp hemocytes at 24 h after WSSV infection. Methylene blue (MB) indicated the loading control. (D) Relative mRNA levels of METTL3 in virus-free and WSSV-infected shrimp. At 24 h after WSSV infection, the expression level of shrimp METTL3 was detected using quantitative real-time PCR (**, p < 0.01). (E) Western blot analysis of METTL3 in virus-free and WSSV-infected shrimp, β-actin was used as a control. (F) Expression of METTL3 in nuclear and cytoplasm of shrimp hemocytes. The purity of nuclear and cytoplasm was determined by Western blot using Histone H3 and β-actin antibody, respectively. (G) Repr Credit: Xumei Sun et al. / PLOS Pathogens

Protein Readers and Translation Enhancement

Further experiments showed that chemical tagging by METTL3 protects lactate dehydrogenase messenger RNA from degradation, effectively extending its half-life and boosting protein output. The team identified YTH domain family protein 3, an RNA-binding reader protein, as the specific molecule that recognizes this methylation site. This reader protein recruits eukaryotic translation initiation factor 4 subunit A to the transcript, enhancing both stability and translation efficiency.

The resulting accumulation of lactate triggers downstream epigenetic changes known as histone lactylation, specifically modifying histone residues H3K18la and H4K12la. These modifications enhance chromatin transcription at the mettl3 gene promoter, creating a positive feedback loop that further increases METTL3 expression and sustains high lactate production.

By mapping this intricate network linking RNA epigenetics, energy metabolism, and histone modifications, the study highlights potential therapeutic targets for controlling viral outbreaks in aquaculture settings.

The research was published in PLOS Pathogens on November 19, 2026.

Fact Checked

This article has been fact checked for accuracy, with information verified against reputable sources. Learn more about us and our editorial process.

Last reviewed on .

Article history

  • Latest version

Reference(s)

  1. Sun, Xumei., et al. “N6-methyladenosine dependent glycolysis enhances viral infection by histone lactylation in an arthropod.” PLOS Pathogens, vol. 22, no. 11, November 19, 2026, pp. e1014789 Public Library of Science (PLoS), doi: 10.1371/journal.ppat.1014789. <https://doi.org/10.1371/journal.ppat.1014789>.

Cite this page:

Abbasi, Bilal. “Viral Infection Triggers RNA Tagging to Hijack Host Energy Metabolism.” BioScience. BioScience ISSN 2521-5760, 20 November 2026. <https://www.bioscience.com.pk/en/subject/chemistry/n6-methyladenosine-dependent-glycolysis-enhances-viral-infection-by-histone-lactylation-in-an-arthropod>. Abbasi, B. (2026, November 20). “Viral Infection Triggers RNA Tagging to Hijack Host Energy Metabolism.” BioScience. ISSN 2521-5760. Retrieved November 20, 2026 from https://www.bioscience.com.pk/en/subject/chemistry/n6-methyladenosine-dependent-glycolysis-enhances-viral-infection-by-histone-lactylation-in-an-arthropod Abbasi, Bilal. “Viral Infection Triggers RNA Tagging to Hijack Host Energy Metabolism.” BioScience. ISSN 2521-5760. https://www.bioscience.com.pk/en/subject/chemistry/n6-methyladenosine-dependent-glycolysis-enhances-viral-infection-by-histone-lactylation-in-an-arthropod (accessed November 20, 2026).
End of the article