New AI Benchmark Transforms Complex Heart Simulations Into Graph Data
Researchers introduce GraphEP to help machine learning models track electrical waves across healthy and scarred heart geometries.
Heart muscle cells fire in complex three-dimensional waves across the organ, but capturing these sweeping electrical signals in artificial intelligence models has long challenged computer scientists. A team of researchers has introduced a calibrated data system and benchmark called GraphEP to translate complex anatomical simulations into graph-native trajectories that machine learning models can finally digest.
The study, published in arXiv, tackles a fundamental hurdle in scientific computing. While high-fidelity biophysical simulations generate detailed data about how electrical voltage moves through heart tissue, those simulator outputs are rarely structured in a way that modern neural networks can utilize without heavy preprocessing.
From 3D Heart Meshes to Graph-Native Data
Cardiac electrophysiology couples fast cellular dynamics with directional propagation across the heart wall, known as the myocardium. Because every human heart anatomy has a different shape, simulations rely on unstructured volumetric meshes rather than standard rectangular grids or fixed time series.
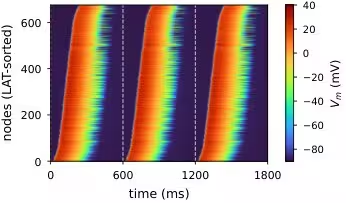
To bridge this gap, the authors built a four-stage pipeline that transforms raw anatomical geometries into standardized graph representations. The new dataset packages 732 left-ventricular simulations derived from 20 distinct heart anatomies. These samples span healthy tissue, varying severities of random scar patterns, and multiple pacing configurations.
Each graph node tracks vital features such as local fiber directions, tissue classes, universal ventricular coordinates, and distance from pacing sites. By storing 361 voltage frames sampled at 5-millisecond intervals over three paced beats, the system records how electrical waves move, stall around scars, and interact with the surrounding tissue.
Testing AI Architectures on Cardiac Dynamics
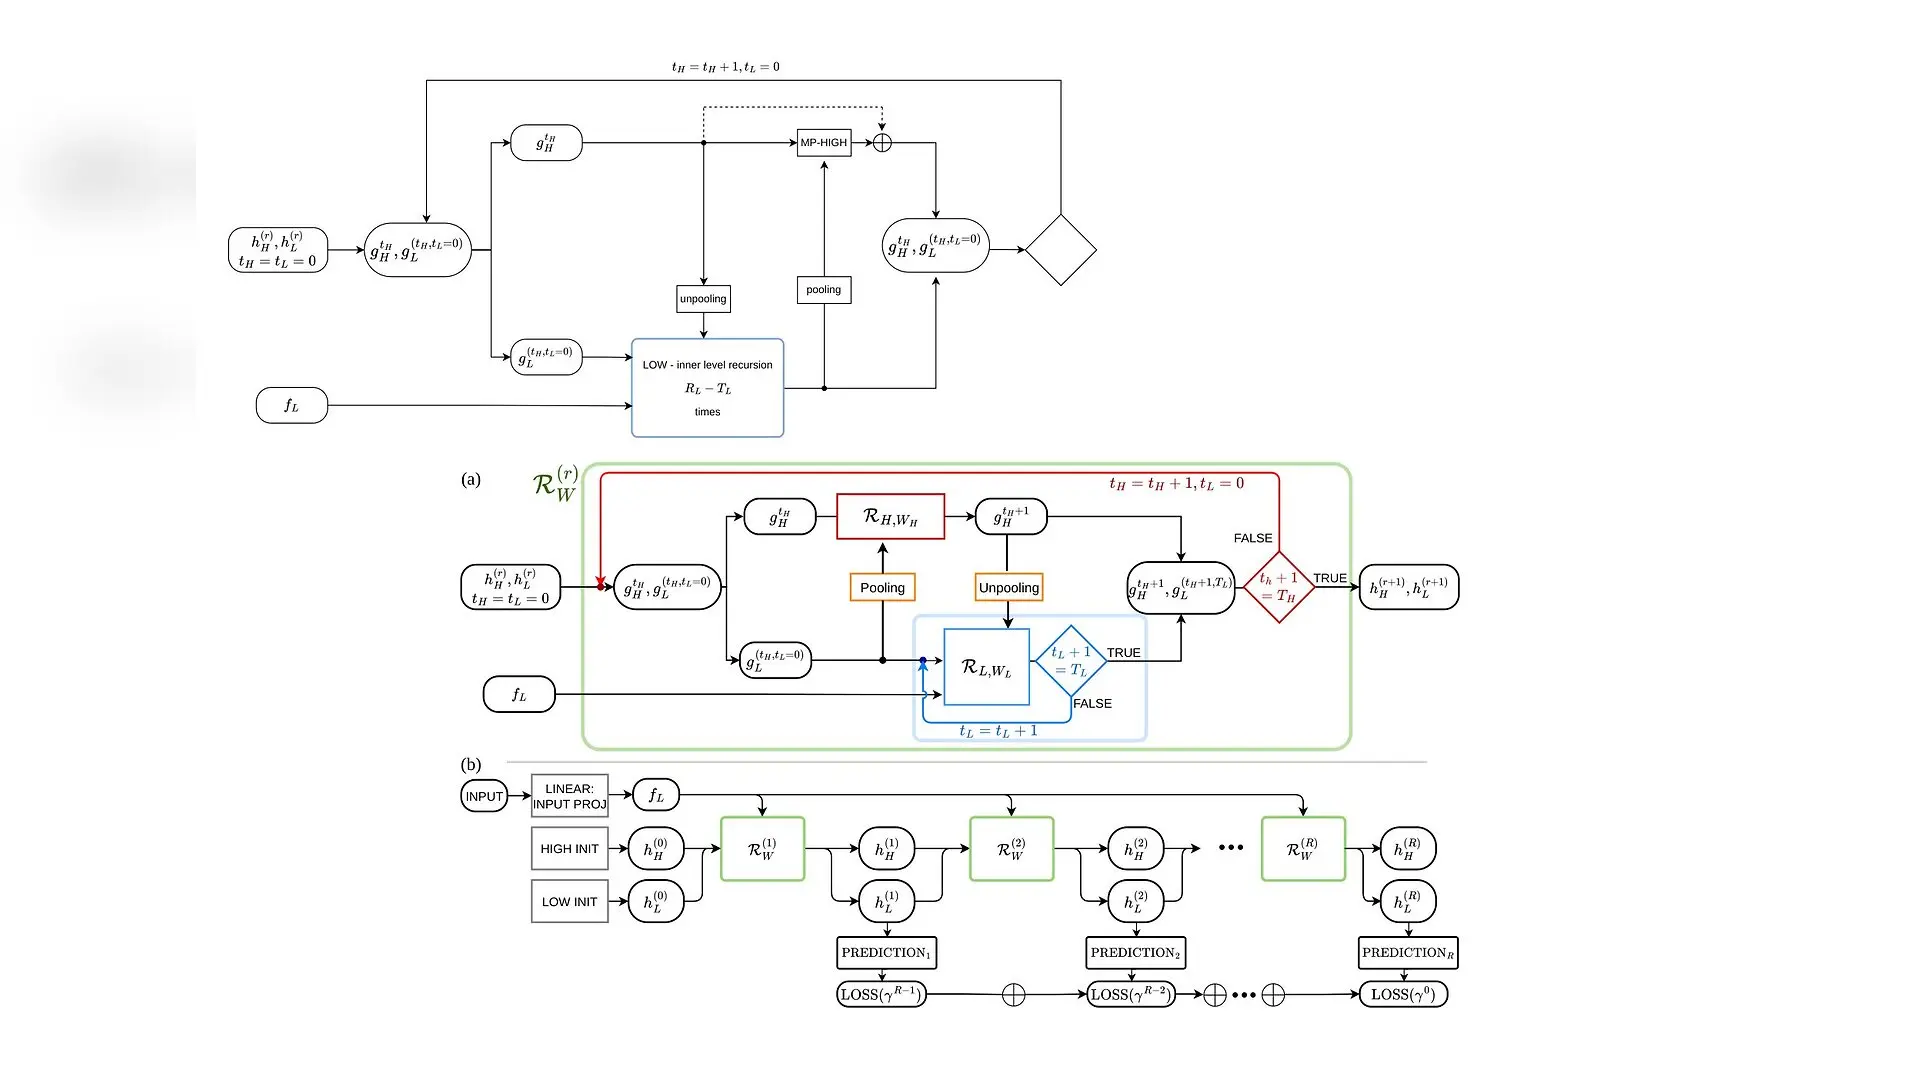
With the new data system in place, the researchers evaluated seven different machine learning architectures to see how well they predict full-field transmembrane potential over time. The tested models ranged from simple local message-passing graph neural networks to global neural operators and multi-scale hierarchical graph transformers.
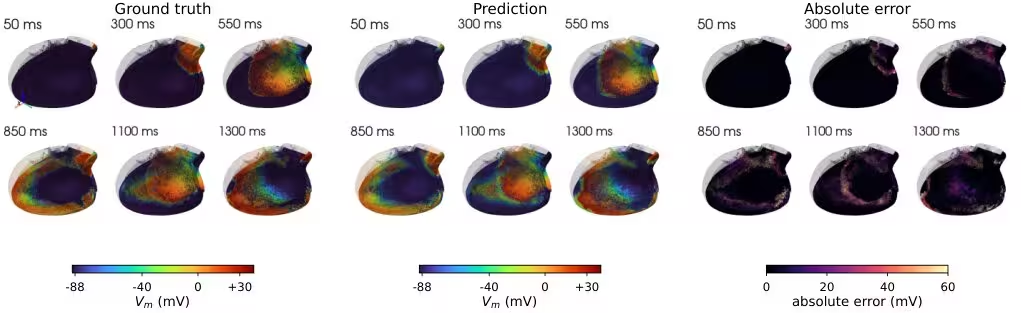
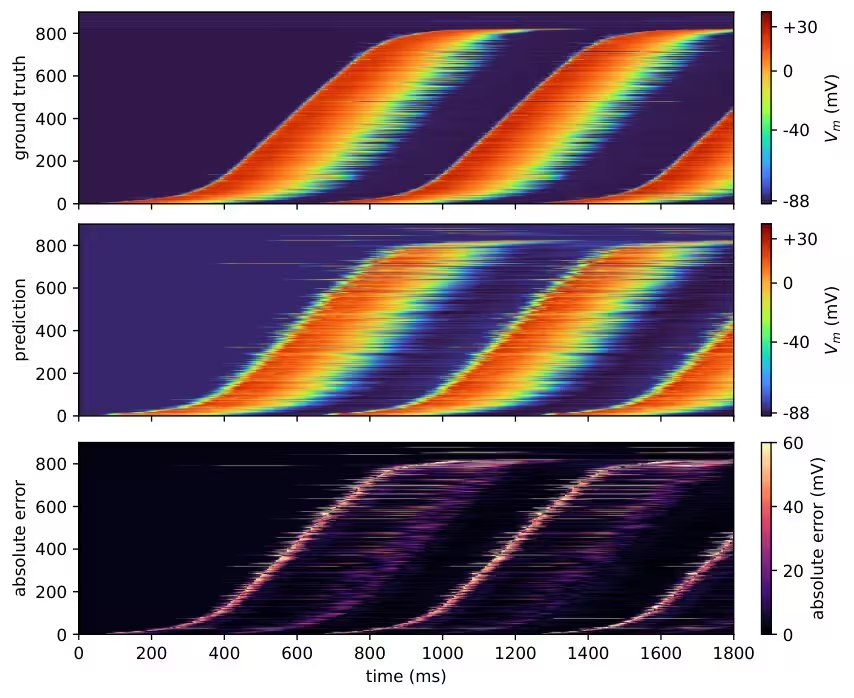
The results reveal a clear performance divide based on how much physiological structure a model incorporates. A stateful graph neural ordinary differential equation model, designated as GAP2ODE, achieved the lowest overall voltage error and the most accurate depolarization and local activation times. By evolving the recovery state dynamically using a sample-specific diffusion operator, the model successfully tracked the moving electrical wavefront without losing signal amplitude.
However, the study also highlights that different models excel at different biological milestones. While the graph ODE dominated overall trajectory and activation timing, a physiology-informed transformer variant called HGT-Lag proved more accurate at predicting long-term recovery endpoints, such as action potential duration and repolarization time, by explicitly separating wave arrival timing from local waveform shapes.
Limitations and Next Steps
Despite providing a robust testing ground for artificial intelligence, the authors caution that the current benchmark remains a controlled simulation testbed rather than a direct substitute for clinical patient data. The dataset’s train-test split evaluates new pacing conditions across 20 known anatomies rather than entirely unseen heart shapes, and the scar patterns are generated procedurally rather than matched against clinical histopathology.
Future work aims to expand the pipeline toward broader physiological conditions, measured cardiac signals, and fully anatomy-disjoint evaluations. By embedding provenance directly into the data representation, the new framework establishes a reproducible standard for connecting mechanistic heart simulations with advanced geometric deep learning.
The study was posted to the arXiv preprint server on November 19, 2026.
This article has been fact checked for accuracy, with information verified against reputable sources. Learn more about us and our editorial process.
Last reviewed on .
Article history
- Latest version
Reference(s)
- Baldan, Matteo. “GraphEP: A Calibrated Data System and Benchmark for Learning Cardiac Electrophysiology.” arXiv.org <http://arxiv.org/abs/2611.26551v1>.
Cite this page:
- Posted by Priya Sharma