Astronomers Just Captured A Faint Cosmic Glow To Map The Universe In 3D
MeerKAT has detected faint hydrogen clusters from 4.5 billion years ago, revealing a groundbreaking new method for mapping the history of our Universe.
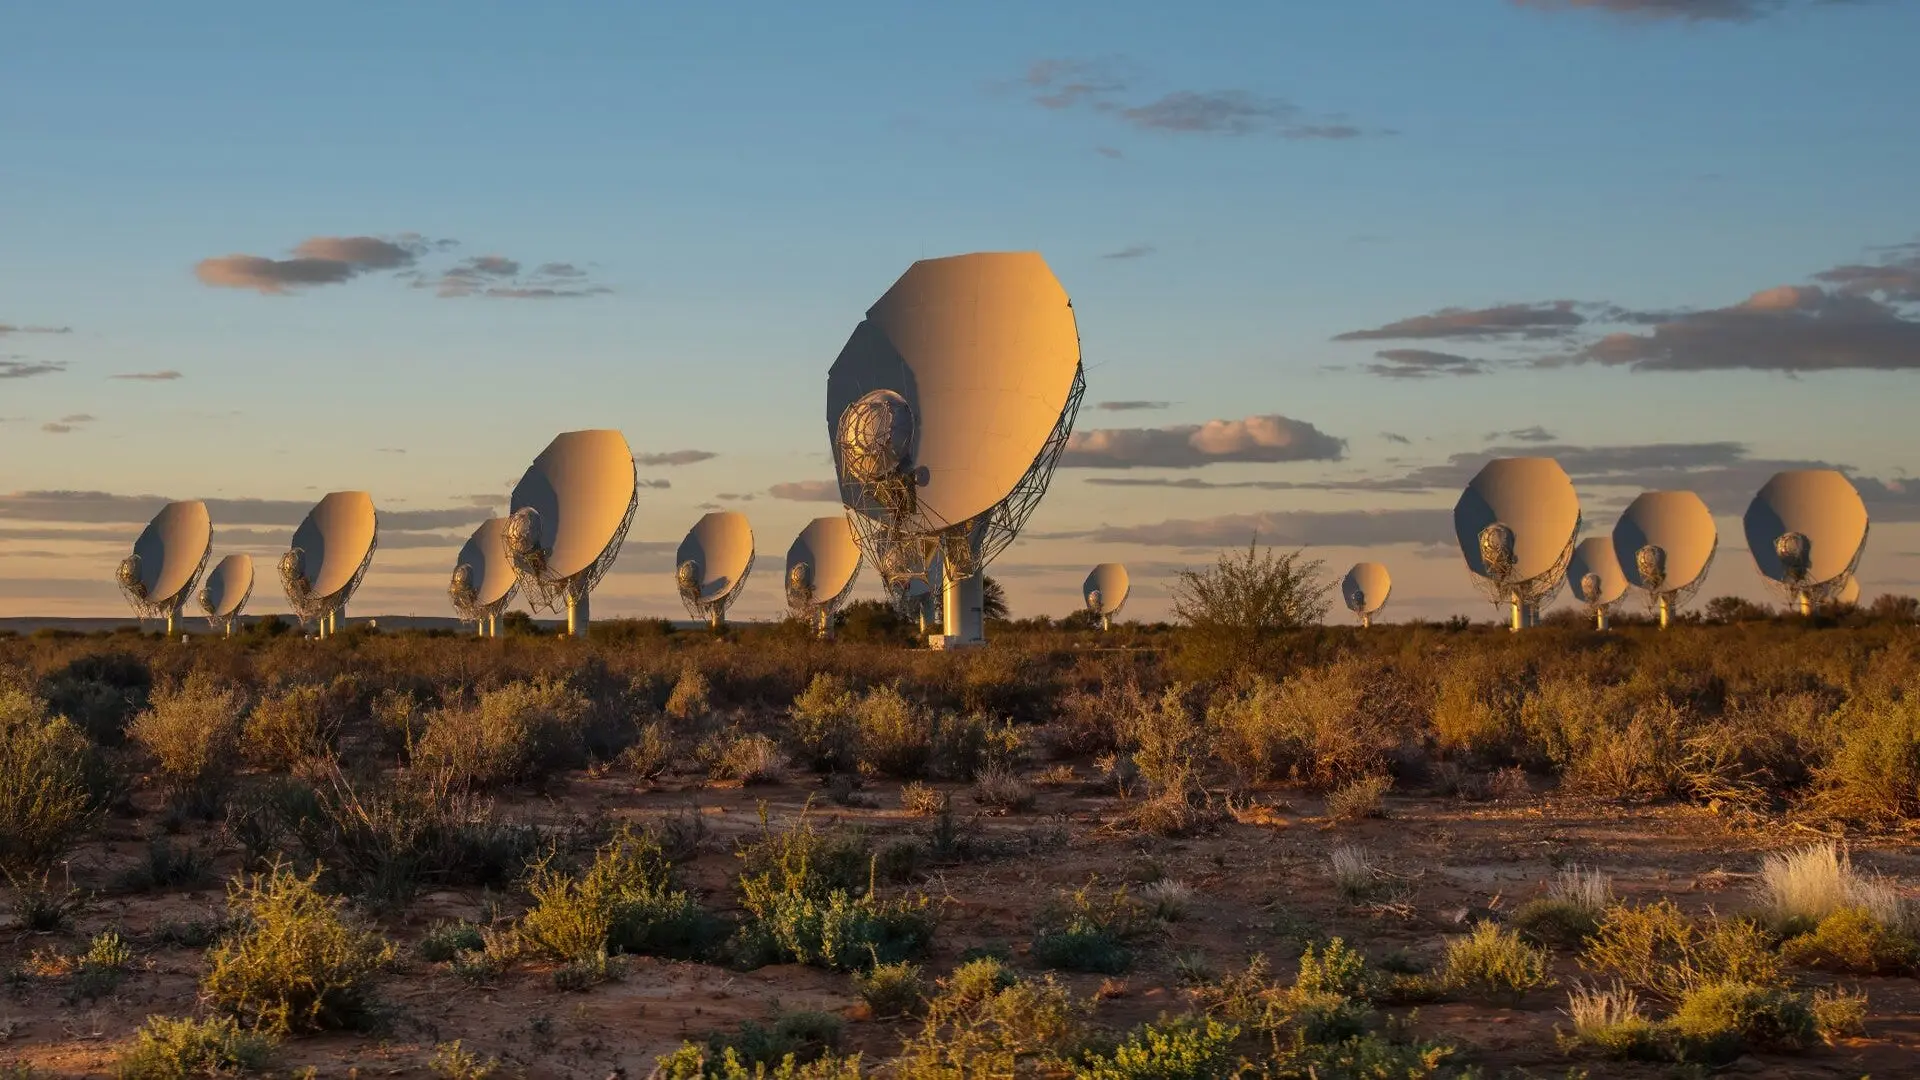
Astronomers have achieved a significant breakthrough in mapping the invisible architecture of the cosmos by capturing the faint, collective radio glow of neutral hydrogen from billions of years ago. Using South Africa’s MeerKAT telescope, an international research team has successfully measured how this gas clustered across the cosmic web, providing a new, high-precision window into the evolution of the Universe.
The findings, published in the Monthly Notices of the Royal Astronomical Society, represent the culmination of a decade of development by the MeerKLASS collaboration. By employing a specialized technique known as 21-centimeter intensity mapping, the researchers were able to detect signals emitted approximately 4.5 billion years ago, when the Universe was roughly nine billion years old.
Charting the Cosmic Deep
Neutral hydrogen naturally emits radio waves at a precise wavelength of 21 centimeters. As these signals travel across the expanding Universe, they undergo a phenomenon called redshift, stretching into longer wavelengths and lower frequencies by the time they reach Earth. By measuring these specific frequency shifts, scientists can determine the distance of the gas, effectively creating a three-dimensional map of where matter gathered throughout cosmic history.
Unlike traditional surveys that attempt to resolve and catalog individual galaxies, intensity mapping aggregates the total emission from vast patches of the sky. This approach allows astronomers to study the broader structure of the Universe without the need to identify every individual source. In this study, the team analyzed frequencies between 971 and 1,024 megahertz, providing a statistical snapshot of matter distribution on a massive scale.
Repurposing a Radio Giant
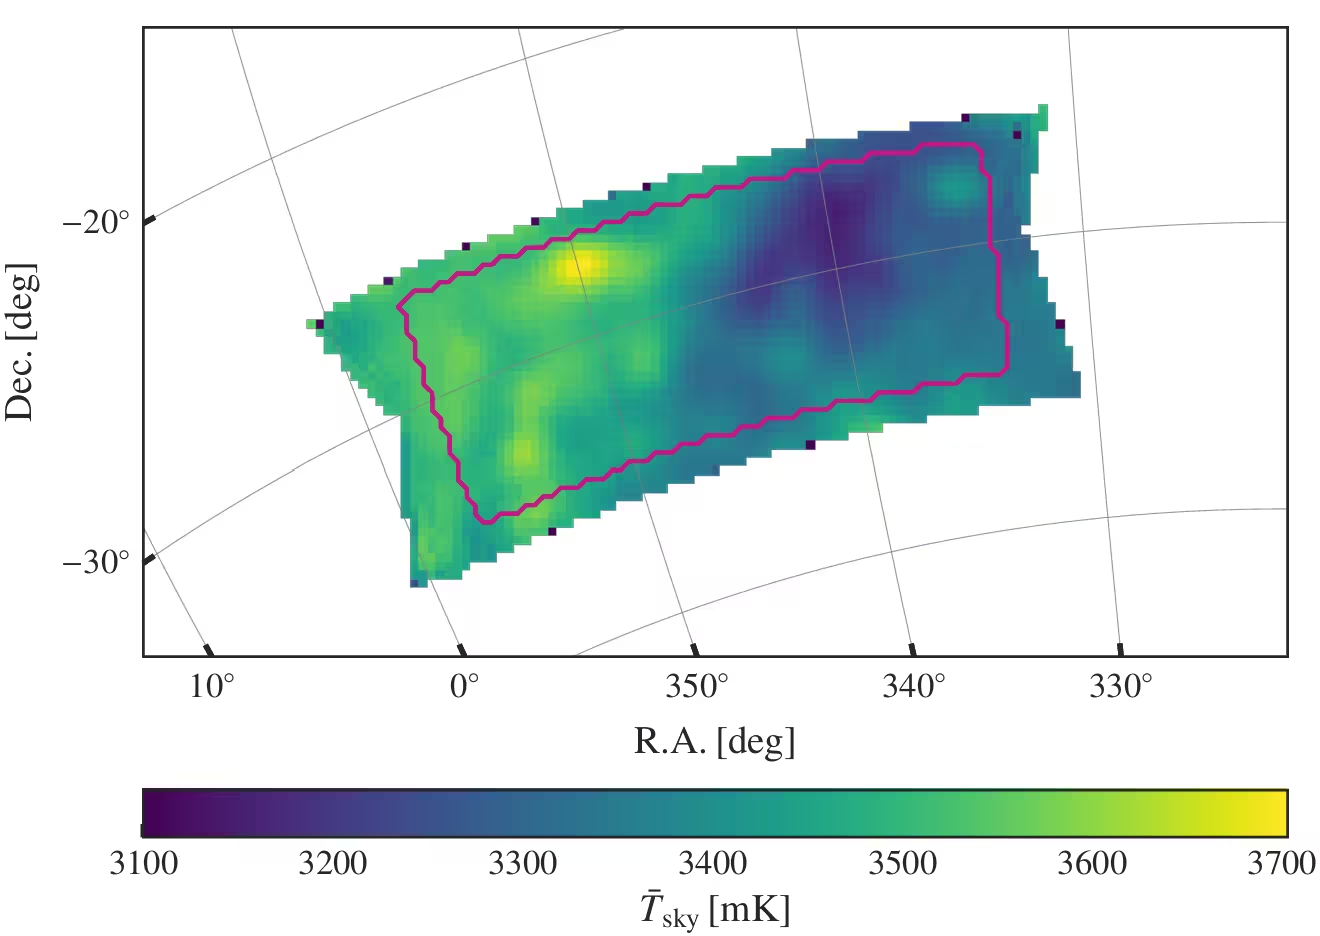
The MeerKAT array, which consists of 64 antennas, is typically operated as an interferometer to produce high-resolution images. However, for this project, the team repurposed the instrument to operate in single-dish mode. This configuration prioritized survey speed and broad-area sensitivity over fine angular detail, enabling the researchers to scan an expansive 236-square-degree patch of the sky.
Extracting the hydrogen signal proved to be a formidable challenge, as the target emission is often dwarfed by foreground radio interference that can be 10,000 times brighter. “It is a little like trying to make out a whispered conversation from the front row of a roaring rock concert,” explained Laura Wolz, the project’s deputy principal investigator and a researcher at The University of Manchester’s Jodrell Bank Centre for Astrophysics.
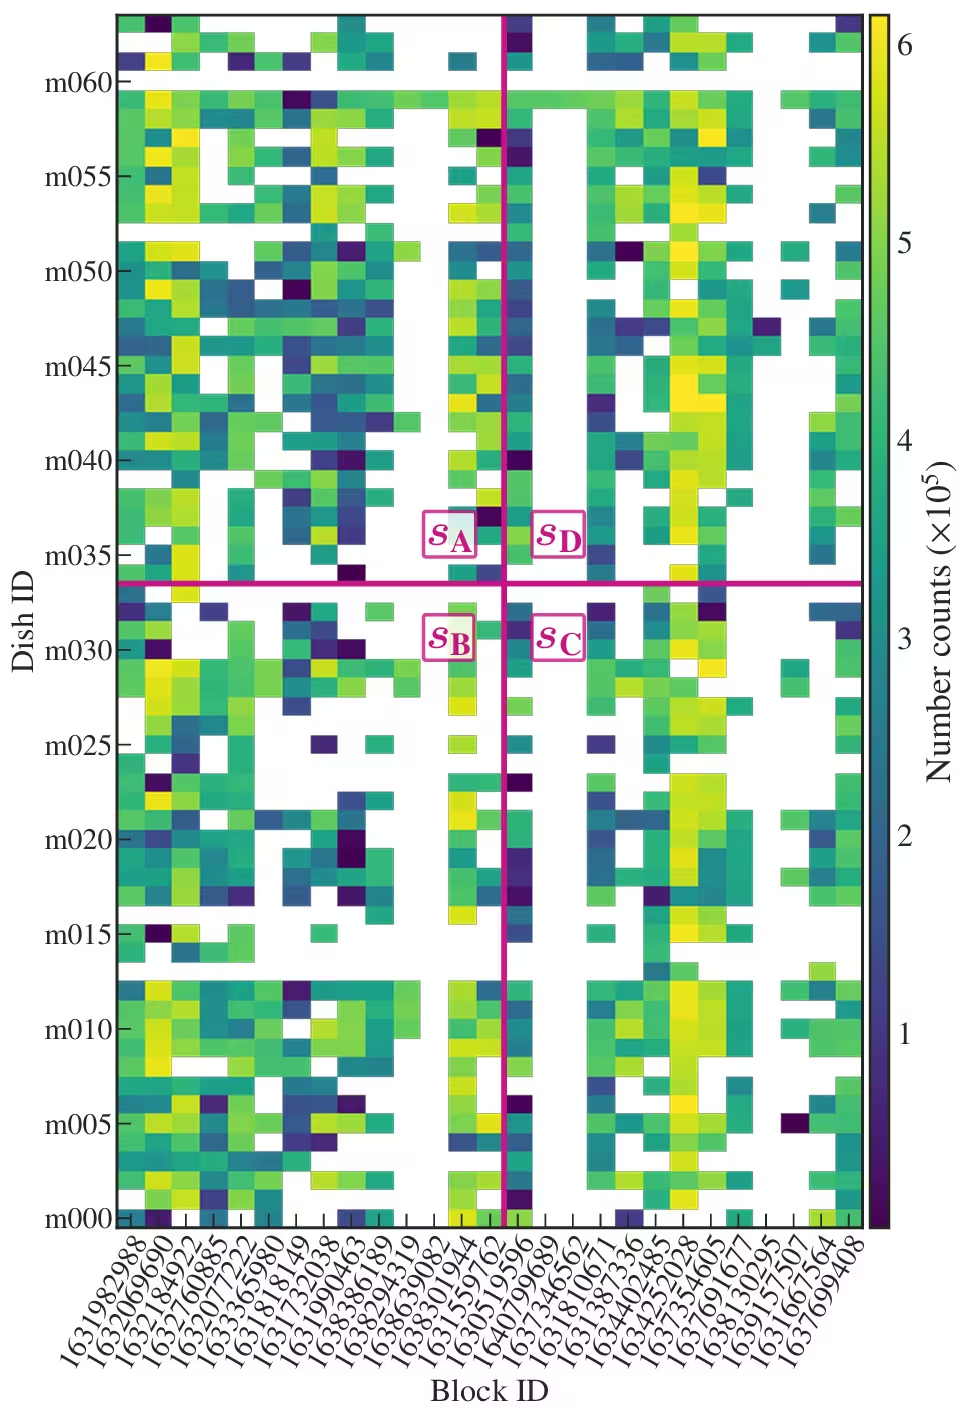
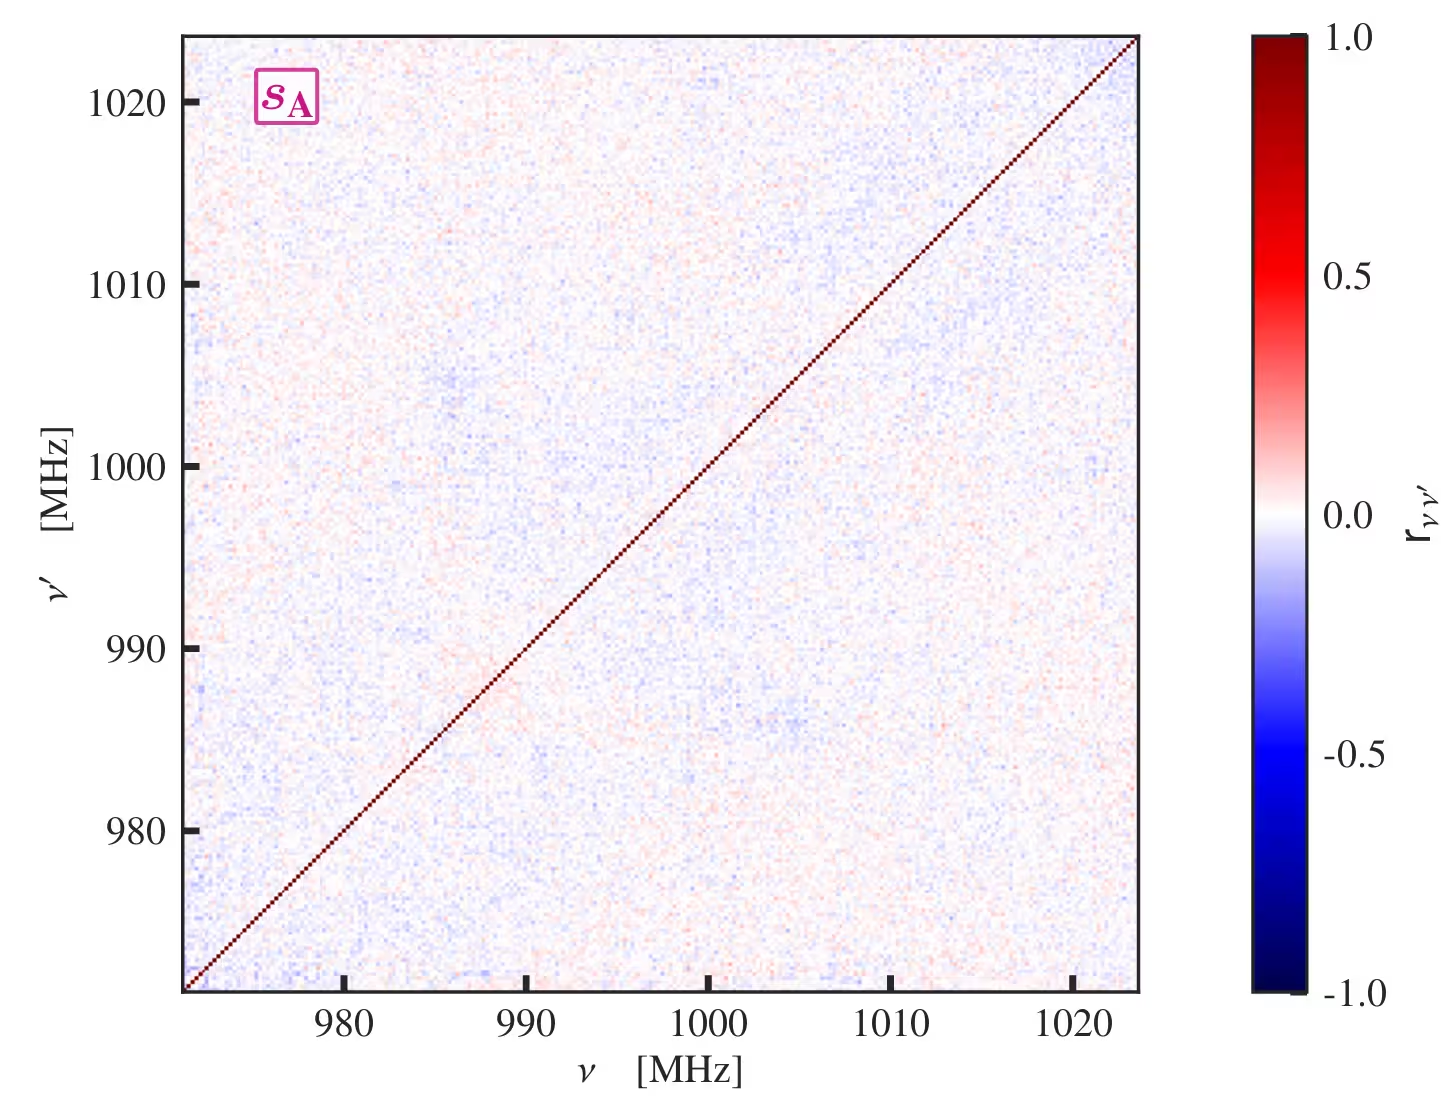
To overcome this, the team developed a sophisticated cleaning pipeline. By dividing their 40 hours of usable data into independent subsets and cross-comparing them, they were able to filter out random instrumental noise and systematic errors while retaining the consistent cosmic signals present in every observation.
Laying the Groundwork for Future Discovery
The resulting power spectrum confirms that hydrogen clustering can be measured directly from radio data, without relying on external optical galaxy catalogs. This success establishes a vital proof-of-concept for larger-scale surveys, according to Mário Santos of the University of the Western Cape, who leads the MeerKLASS collaboration.
The collaboration is already looking ahead to much more ambitious goals. Current efforts involve analyzing lower-frequency observations that probe even earlier epochs of the Universe. The team expects that future iterations of the survey will cover a volume more than 1,000 times larger than the current dataset. These expansive maps will be critical for investigating the nature of dark energy and testing the fundamental laws of gravity.
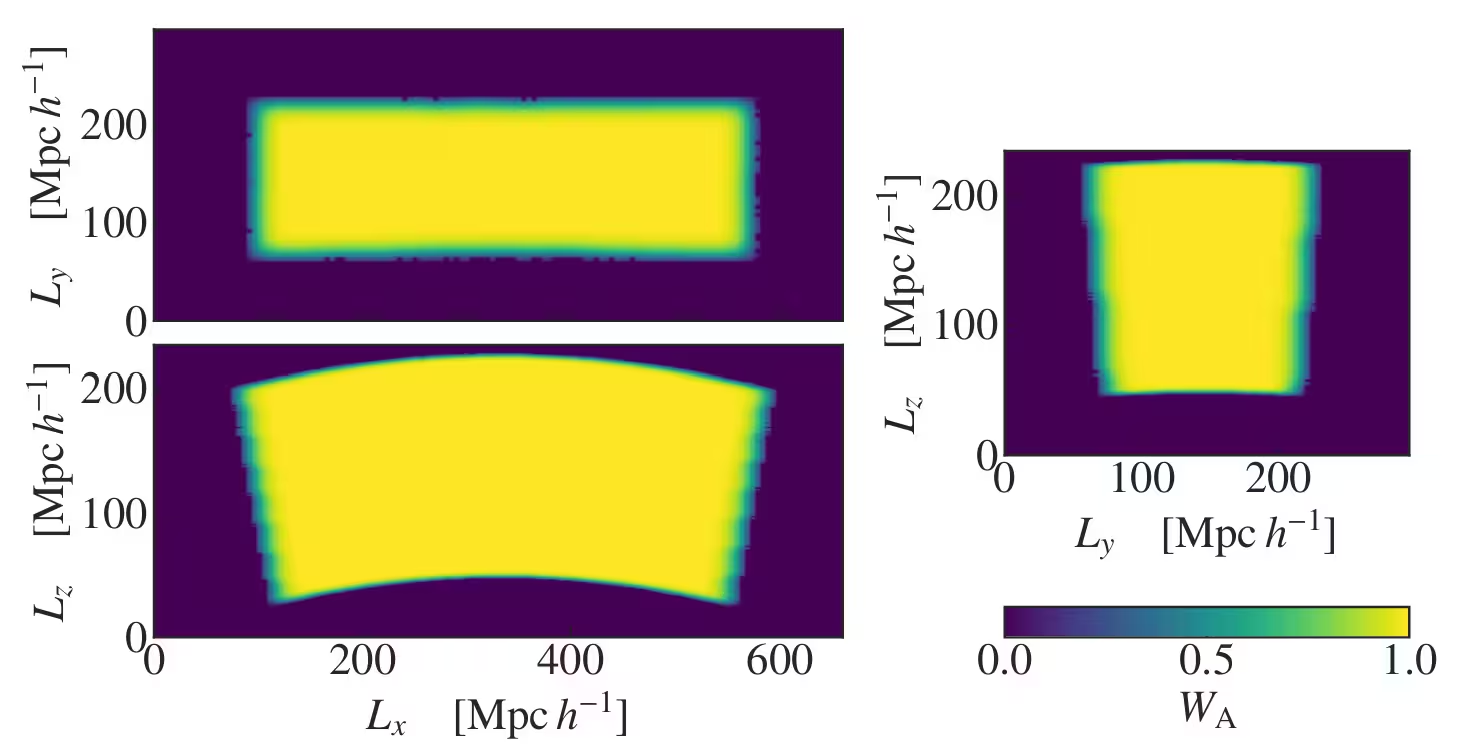
By refining these techniques, MeerKAT is not only delivering new cosmological insights but also serving as a critical precursor to the upcoming SKA Observatory, ensuring that astronomers are prepared to map the Universe with unprecedented depth and accuracy.
Recommended Technical References
- Detection of the Cosmological 21 cm Signal in Autocorrelation at z ∼ 1 with the Canadian Hydrogen Intensity Mapping Experiment(The Astrophysical Journal, 2026)
- MeerKLASS L-band deep-field intensity maps: entering the H i dominated regime(Monthly Notices of the Royal Astronomical Society, 2025)
- H i intensity mapping with MeerKAT: power spectrum detection in cross-correlation with WiggleZ galaxies(Monthly Notices of the Royal Astronomical Society, 2023)
- H i intensity mapping with MeerKAT: calibration pipeline for multidish autocorrelation observations(Monthly Notices of the Royal Astronomical Society, 2021)
- An intensity map of hydrogen 21-cm emission at redshift z ≈ 0.8(Nature, 2010)
This article has been fact checked for accuracy, with information verified against reputable sources. Learn more about us and our editorial process.
Last reviewed on .
Article history
- Latest version
Reference(s)
- , et al. “Detection of the Cosmological 21 cm Signal in Autocorrelation at z ∼ 1 with the Canadian Hydrogen Intensity Mapping Experiment.” The Astrophysical Journal, vol. 1009, no. 2, September 28, 2026, pp. 159 American Astronomical Society, doi: 10.3847/1538-4357/ae9835. <https://doi.org/10.3847/1538-4357/ae9835>.
- , et al. “MeerKLASS L-band deep-field intensity maps: entering the H
i dominated regime.” Monthly Notices of the Royal Astronomical Society, vol. 537, no. 4, February 3, 2025, pp. 3632-3661. Oxford University Press (OUP), doi: 10.1093/mnras/staf195. <https://doi.org/10.1093/mnras/staf195>. - Cunnington, Steven., et al. “H
i intensity mapping with MeerKAT: power spectrum detection in cross-correlation with WiggleZ galaxies.” Monthly Notices of the Royal Astronomical Society, vol. 518, no. 4, October 31, 2022, pp. 6262-6272. Oxford University Press (OUP), doi: 10.1093/mnras/stac3060. <https://doi.org/10.1093/mnras/stac3060>. - Wang, Jingying., et al. “H
i intensity mapping with MeerKAT: calibration pipeline for multidish autocorrelation observations.” Monthly Notices of the Royal Astronomical Society, vol. 505, no. 3, May 17, 2021, pp. 3698-3721. Oxford University Press (OUP), doi: 10.1093/mnras/stab1365. <https://doi.org/10.1093/mnras/stab1365>. - Chang, Tzu-Ching., et al. “An intensity map of hydrogen 21-cm emission at redshift z ≈ 0.8.” Nature, vol. 466, no. 7305, July 1, 2010, pp. 463-465. Springer Science and Business Media LLC, doi: 10.1038/nature09187. <https://doi.org/10.1038/nature09187>.
Cite this page:
- Posted by Aisha Ahmed