Stellar Tilts Reveal Ancient Chaos in Sun-Like Star Systems
A massive survey of 114 stars shows that planetary misalignment is baked in at birth, challenging decades of tidal evolution theories.
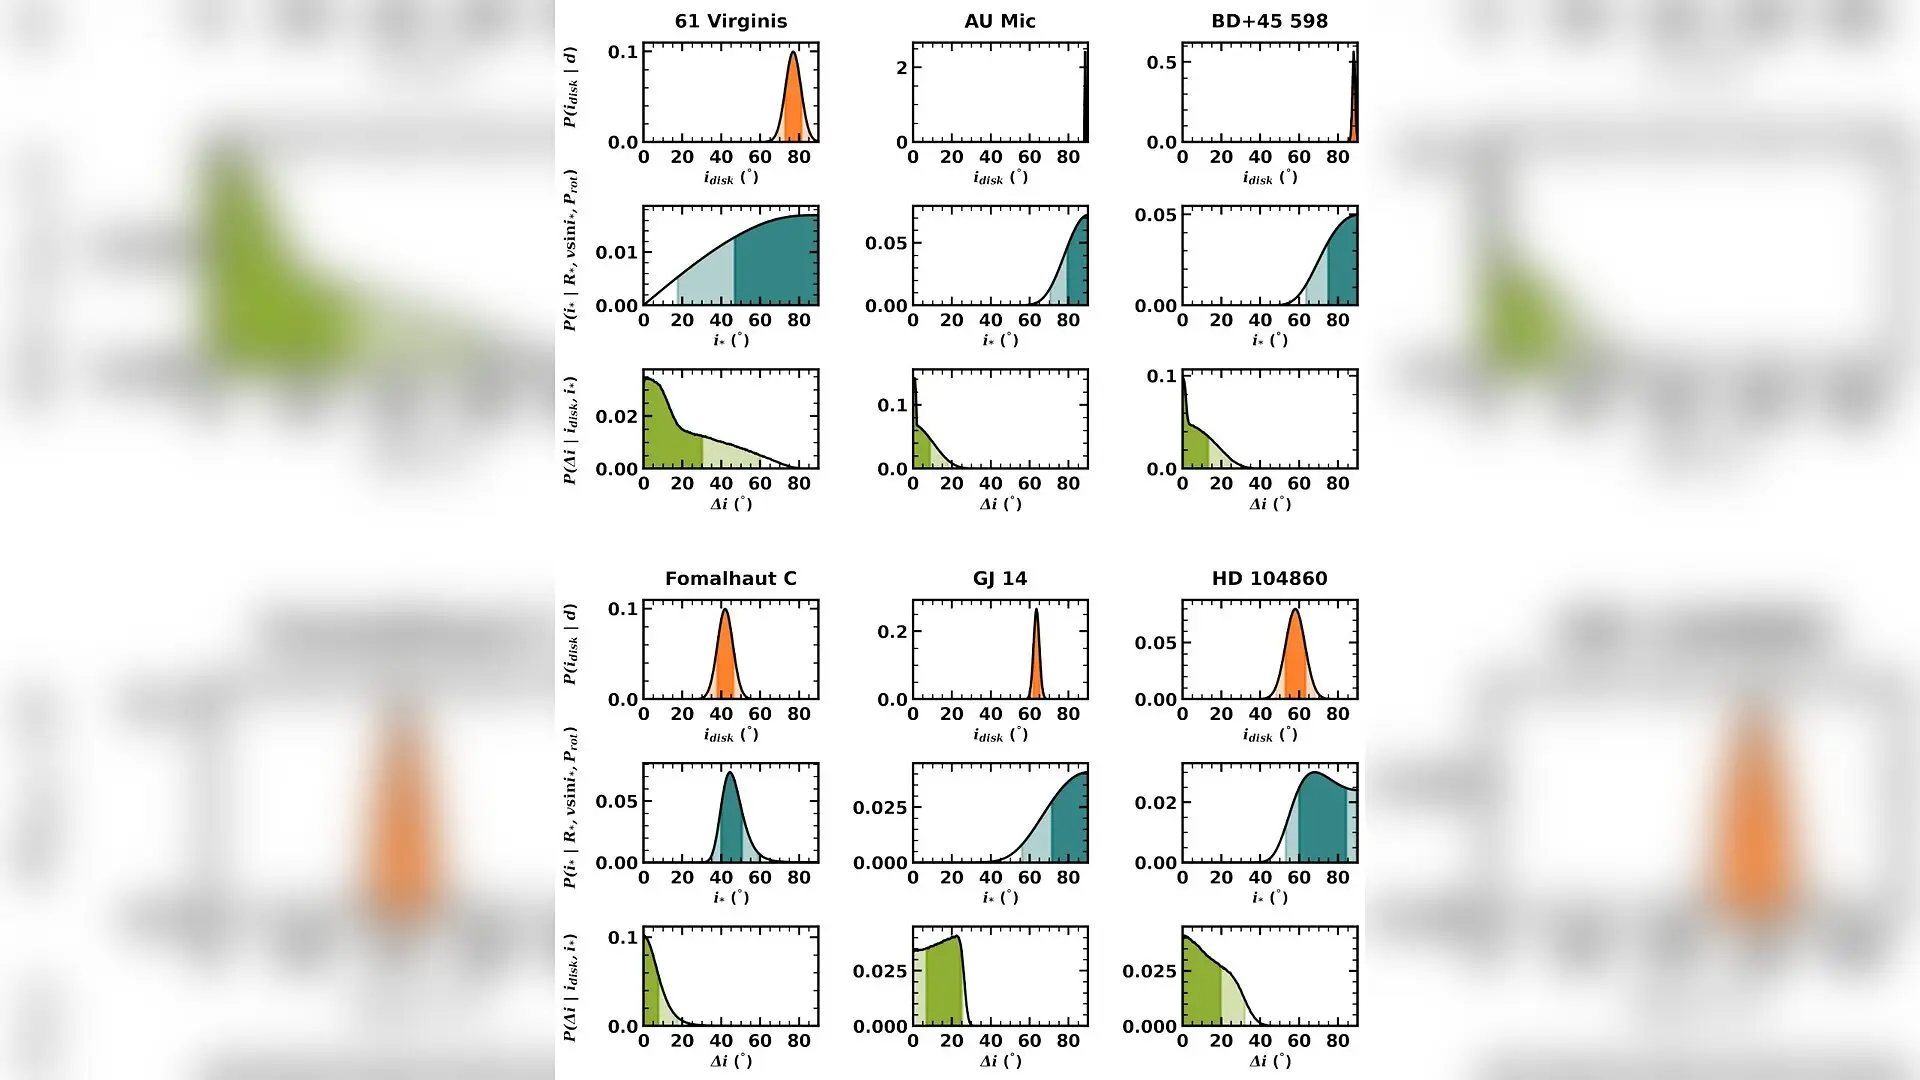
A staggering 33 percent of Sun-like stars start their lives with planetary orbits severely misaligned from their host star’s equator, according to a recent astronomical analysis. This unexpected chaos is established right at birth, challenging long-held assumptions about how solar systems settle into orderly configurations.
Astronomers have long puzzled over why some mature planetary systems end up drastically tilted while others remain neat and flat. To track how these stellar tilts, known scientifically as stellar obliquity, evolve over time, researchers analyzed 114 single Sun-like stars spanning four distinct evolutionary stages. The comprehensive study is available on the arXiv preprint server and compares young protoplanetary disks, older debris disks, and mature star systems hosting giant planets.
How Obliquity Survives Billions of Years
The angle between a star’s rotational axis and the orbital plane of its planets acts as a fossil record of its violent formation history. Researchers examined 49 protoplanetary disk systems averaging 2 to 5 million years old, 24 debris disk systems spanning up to billions of years, 21 warm Jupiter systems, and 20 hot Jupiter systems. By comparing these populations across different ages and orbital separations, the authors evaluated whether gravitational interactions alter system geometry over long timescales.
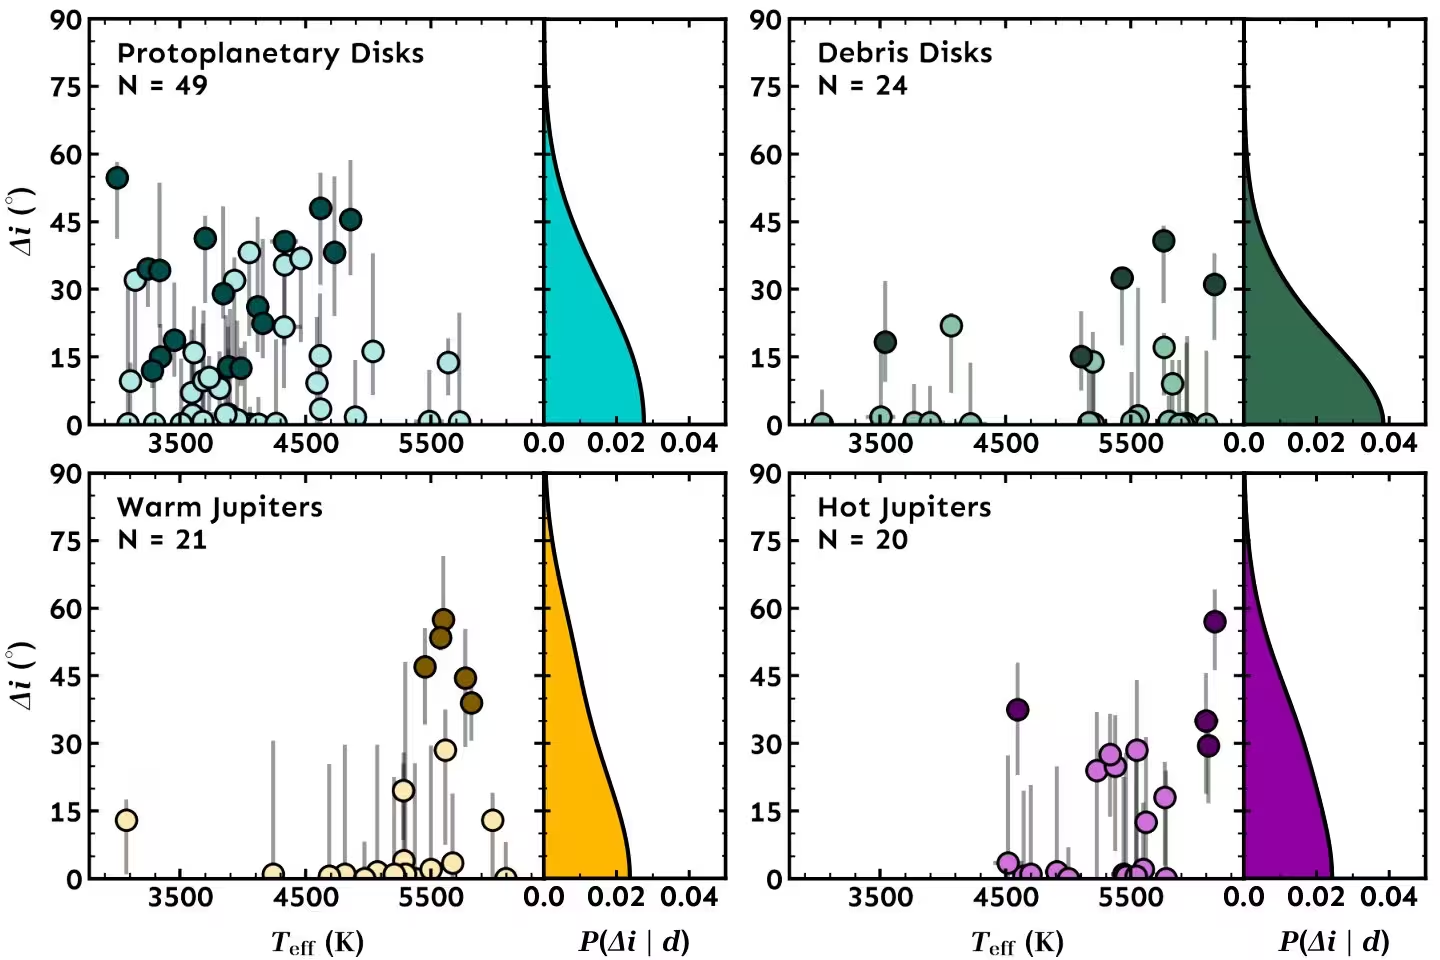
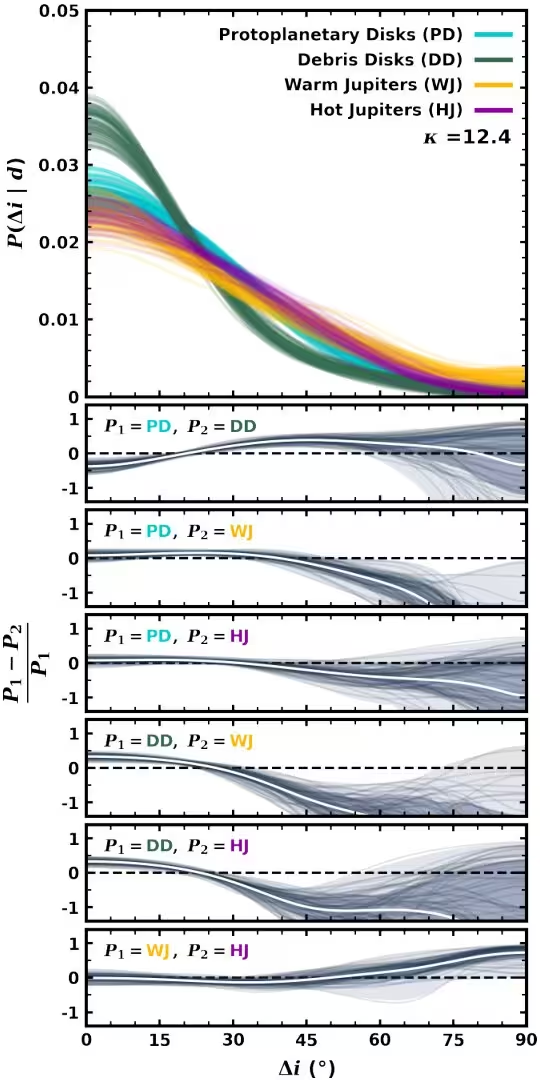
The data revealed minimum misalignment rates of 33 percent for protoplanetary disk systems, 21 percent for debris disk systems, 23 percent for warm Jupiter systems, and 20 percent for hot Jupiter systems. Statistical tests showed that these rates remain consistent within a 1-sigma uncertainty margin across all four samples. The lack of significant variation across four orders of magnitude in age and separation indicates that stellar obliquity is largely fixed at birth.
The Catch With Tidal Realignment Theories
These findings shake up traditional theories regarding how cool stars align with their orbiting planets. Previously, astronomers assumed that cool stars with thick convective outer layers gradually realigned themselves over billions of years via tidal forces. However, tidal realignment is notoriously slow, often requiring timescales exceeding hundreds of billions of years to reorient a massive star without losing substantial orbital momentum.
Because the observed misalignment rates do not decrease as stars age from a few million to over 5 billion years, tides do not appear to actively straighten out misaligned configurations. Instead, mature systems simply inherit the chaotic geometries sculpted during their earliest formative years.
What This Means for the Search for Alien Worlds
While the study suggests that large-scale inclination changes are rare after planet formation, some puzzles remain. For instance, debris disk systems appeared slightly more aligned in the statistical comparison, though the authors caution this may simply reflect higher measurement precision for those specific targets. Furthermore, the survey primarily targeted close-in giant planets, leaving open the question of whether hidden outer planets harbor unseen inclinations.
Future space missions and high-precision astrometry will soon peer deeper into the outer reaches of these star systems, mapping intermediate separations to confirm whether distant worlds follow the same orderly or chaotic rules.
The study was posted to the arXiv preprint server on October 29, 2026.
This article has been fact checked for accuracy, with information verified against reputable sources. Learn more about us and our editorial process.
Last reviewed on .
Article history
- Latest version
Reference(s)
- Biddle, Lauren. “Mapping Stellar Obliquity Across Space and Time.” arXiv.org <http://arxiv.org/abs/2610.40527v1>.
Cite this page:
- Posted by Aisha Ahmed