Astronomers Map Structural Parameters for Nearly Ten Million Galaxies
Using advanced Bayesian deep learning and transfer learning, researchers have built the largest multi-band catalog of galaxy structures to date.
The architecture of a galaxy holds vital clues about its formation history, star-formation activity, environmental influences, and the growth of its central supermassive black hole. Traditionally, astronomers have relied on fitting mathematical light profiles to images to determine structural parameters such as galaxy size, concentration, and the relative prominence of central bulges versus outer disks. While powerful, these conventional techniques demand immense computational power, making them increasingly impractical as modern astronomical surveys generate hundreds of millions of images.
To overcome this computational bottleneck, a team of astronomers has introduced a massive new catalog providing detailed multi-band structural parameters for nearly 10 million galaxies. The research, available on the arXiv preprint server, builds on advanced machine-learning methodologies to map the physical characteristics of galaxies across approximately 1,400 square degrees of the Hyper Suprime-Cam Subaru Strategic Program Wide survey.
Overcoming Data Limitations with Transfer Learning
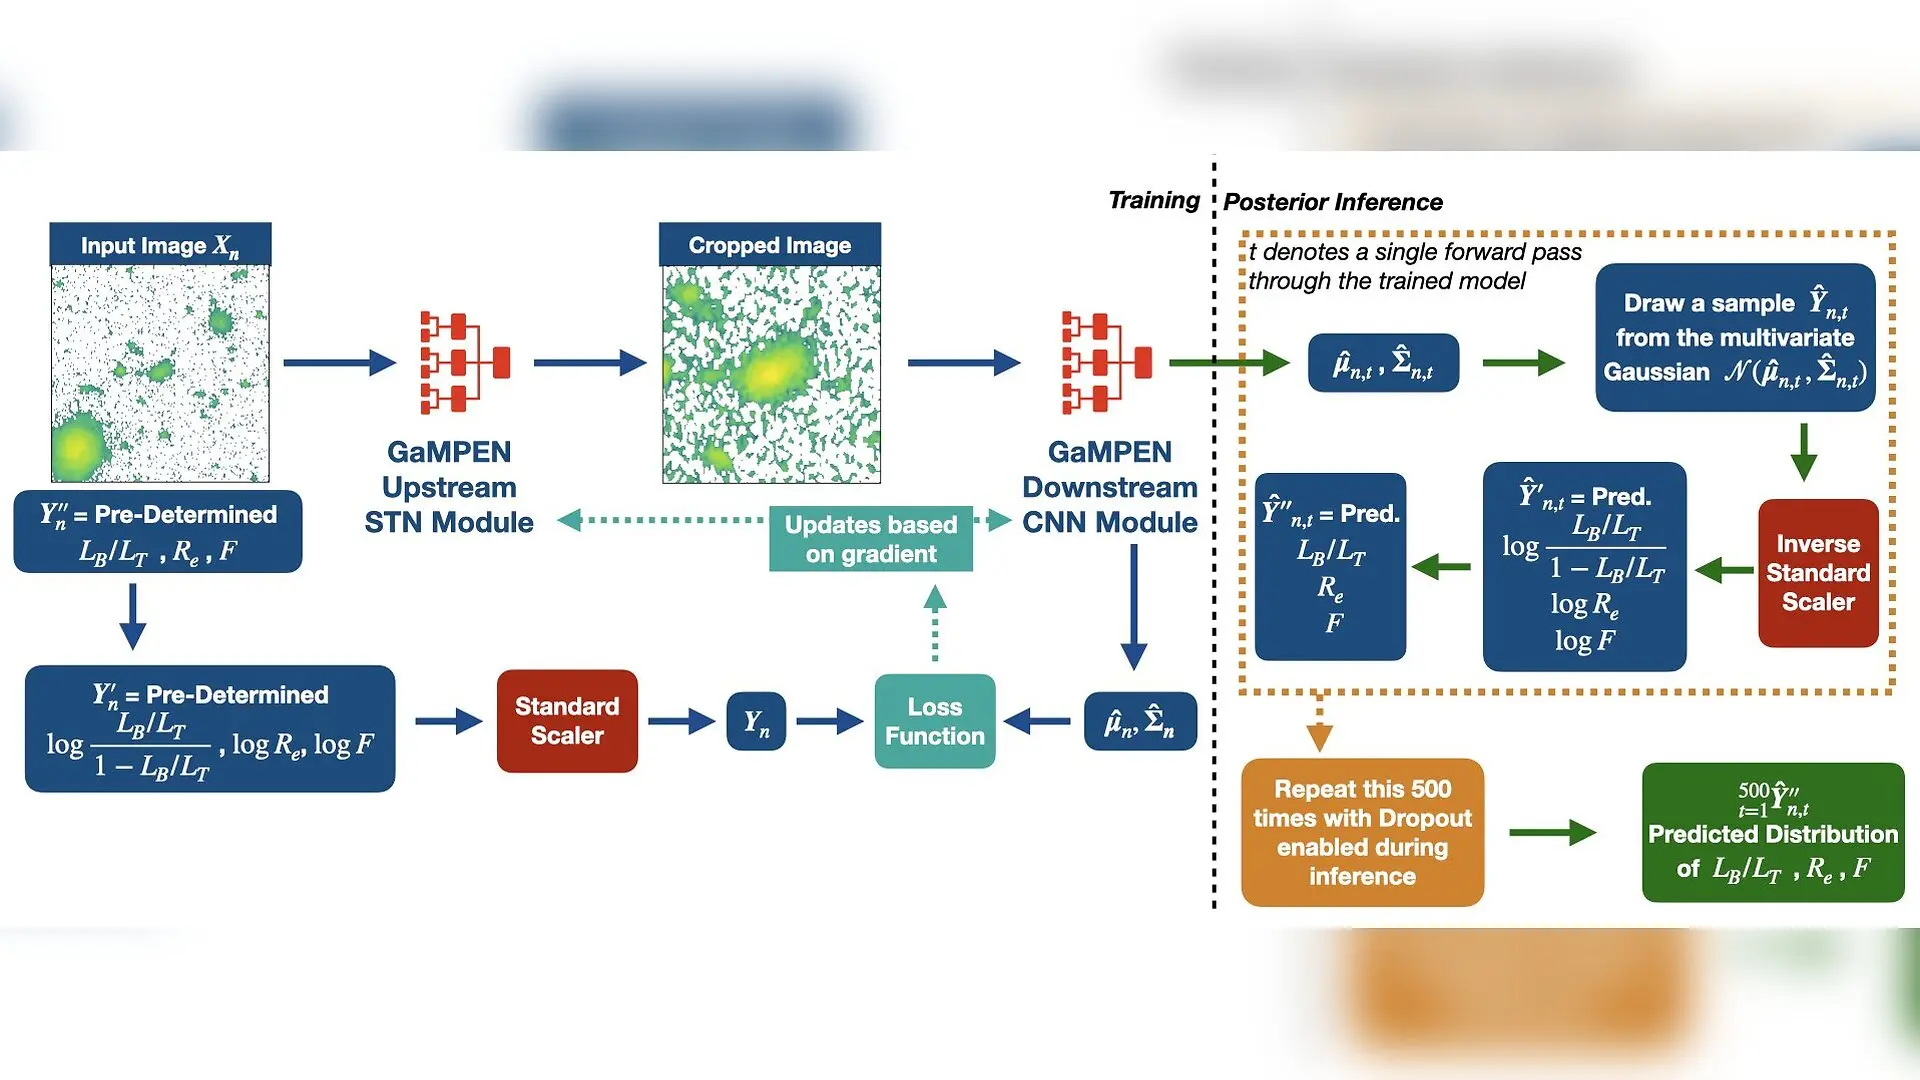
A primary obstacle in training deep-learning models for astronomical morphology is the scarcity of large, pre-existing training sets with accurate structural measurements across multiple optical filters. To bypass this barrier, the authors utilized a transfer-learning approach. Rather than training models from scratch on simulated data for every new filter, they started with previously trained single-band models and fine-tuned them using a tiny fraction of real galaxies whose structural parameters were measured via traditional light-profile fitting.
The team demonstrated that fine-tuning on roughly 0.5 percent of the dataset was sufficient to adapt the deep-learning framework to new photometric bands. This approach successfully reproduced light-profile fitting measurements while requiring intensive human or algorithmic fitting for only a minuscule fraction of the total sample. The underlying architecture used for this task is the Galaxy Morphology Posterior Estimation Network, a Bayesian framework designed to predict full posterior distributions rather than single point estimates.
Bayesian Framework and Uncertainty Calibration
One of the notable aspects of the new catalog is its treatment of measurement uncertainties. Traditional machine-learning pipelines often output deterministic point estimates without robust error bars, complicating downstream statistical analyses. The Bayesian approach adopted in this study captures both aleatoric uncertainties, which stem from image noise and point spread function effects, and epistemic uncertainties, which arise from model limitations.
By incorporating the full parameter covariance matrix into its loss function and utilizing Monte Carlo dropout during inference, the framework produces well-calibrated posterior distributions. Rigorous coverage tests confirmed that the predicted uncertainties match expected confidence levels closely. When the model encounters fainter objects or smaller apparent sizes where structural measurements are inherently difficult, it automatically yields broader posterior distributions, reflecting lower certainty rather than producing misleading overconfidence.
Catalog Contents and Exclusions
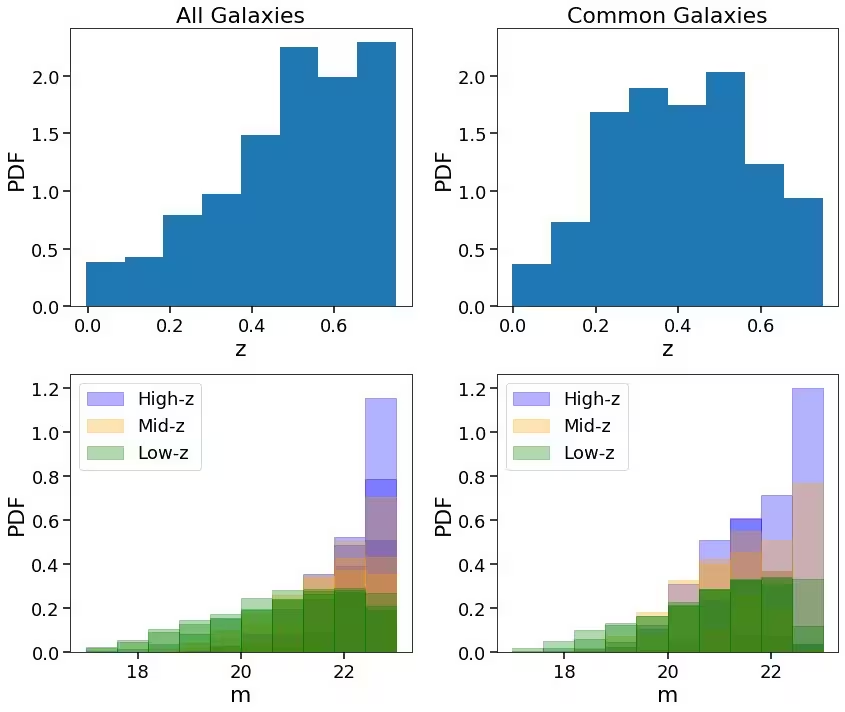
The resulting public catalog covers galaxies out to a redshift of $z \le 0.75$ and magnitudes brighter than $m < 23$. Within this vast sample, approximately 3.9 million galaxies feature complete multi-band coverage across the available filters. The dataset provides per-galaxy posterior distributions for the bulge-to-total light ratio, effective radius, and flux.
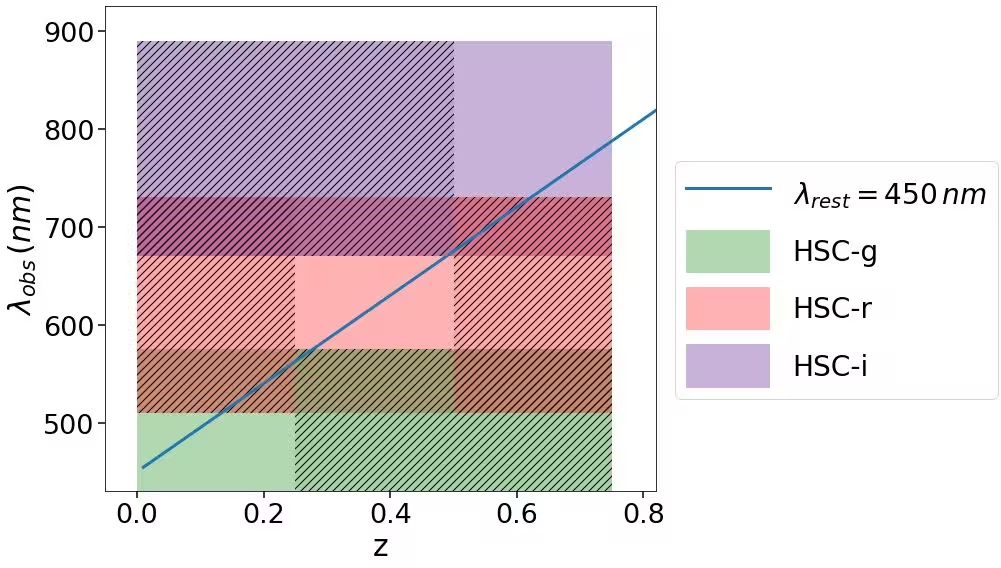
However, the analysis also revealed important physical limitations at shorter rest-frame wavelengths. For high-redshift systems observed in the $g$-band, the filters increasingly probe rest-frame ultraviolet emission. At these wavelengths, galaxy light is dominated by young, clumpy star-forming regions rather than the smooth older stellar populations that trace the underlying bulge and disk backbone. Coupled with surface-brightness dimming, this transition introduces significant scatter and weaker agreement with traditional fitting methods. Consequently, the authors chose to exclude high-redshift $g$-band measurements from the public release to ensure data integrity.
Implications for Future All-Sky Surveys
As astronomy enters an era of unprecedented data collection with upcoming facilities such as the Vera C. Rubin Observatory’s Legacy Survey of Space and Time, the Euclid mission, and the Nancy Grace Roman Space Telescope, scalable analysis frameworks will be essential. The success of this multi-band HSC catalog demonstrates that deep-learning techniques can efficiently process massive astronomical archives while maintaining rigorous statistical rigor.
The publicly available models, source code, and comprehensive structural catalogs offer a foundational resource for the astronomical community. By providing homogeneous multi-wavelength measurements and robust uncertainties for millions of systems, the work opens new avenues for exploring morphological color gradients, environmental scaling relations, and the intricate physical mechanisms driving galaxy evolution across cosmic time.
The study was posted to the arXiv preprint server on October 23, 2026.
This article has been fact checked for accuracy, with information verified against reputable sources. Learn more about us and our editorial process.
Last reviewed on .
Article history
- Latest version
Reference(s)
- Sarkar, Milind. “Complete Multi-Band Structural Characterization for 10 Million Galaxies in the Hyper Suprime-Cam Wide Survey using Deep Learning.” arXiv.org <http://arxiv.org/abs/2610.32913v1>.
Cite this page:
- Posted by John Williams