Hidden Drivers of Yellow Fever Re-Emergence Revealed by New Math Model
Advanced computational tools show how animal birth rates and landscape connectivity fuel the spread of yellow fever virus across South American ecosystems.
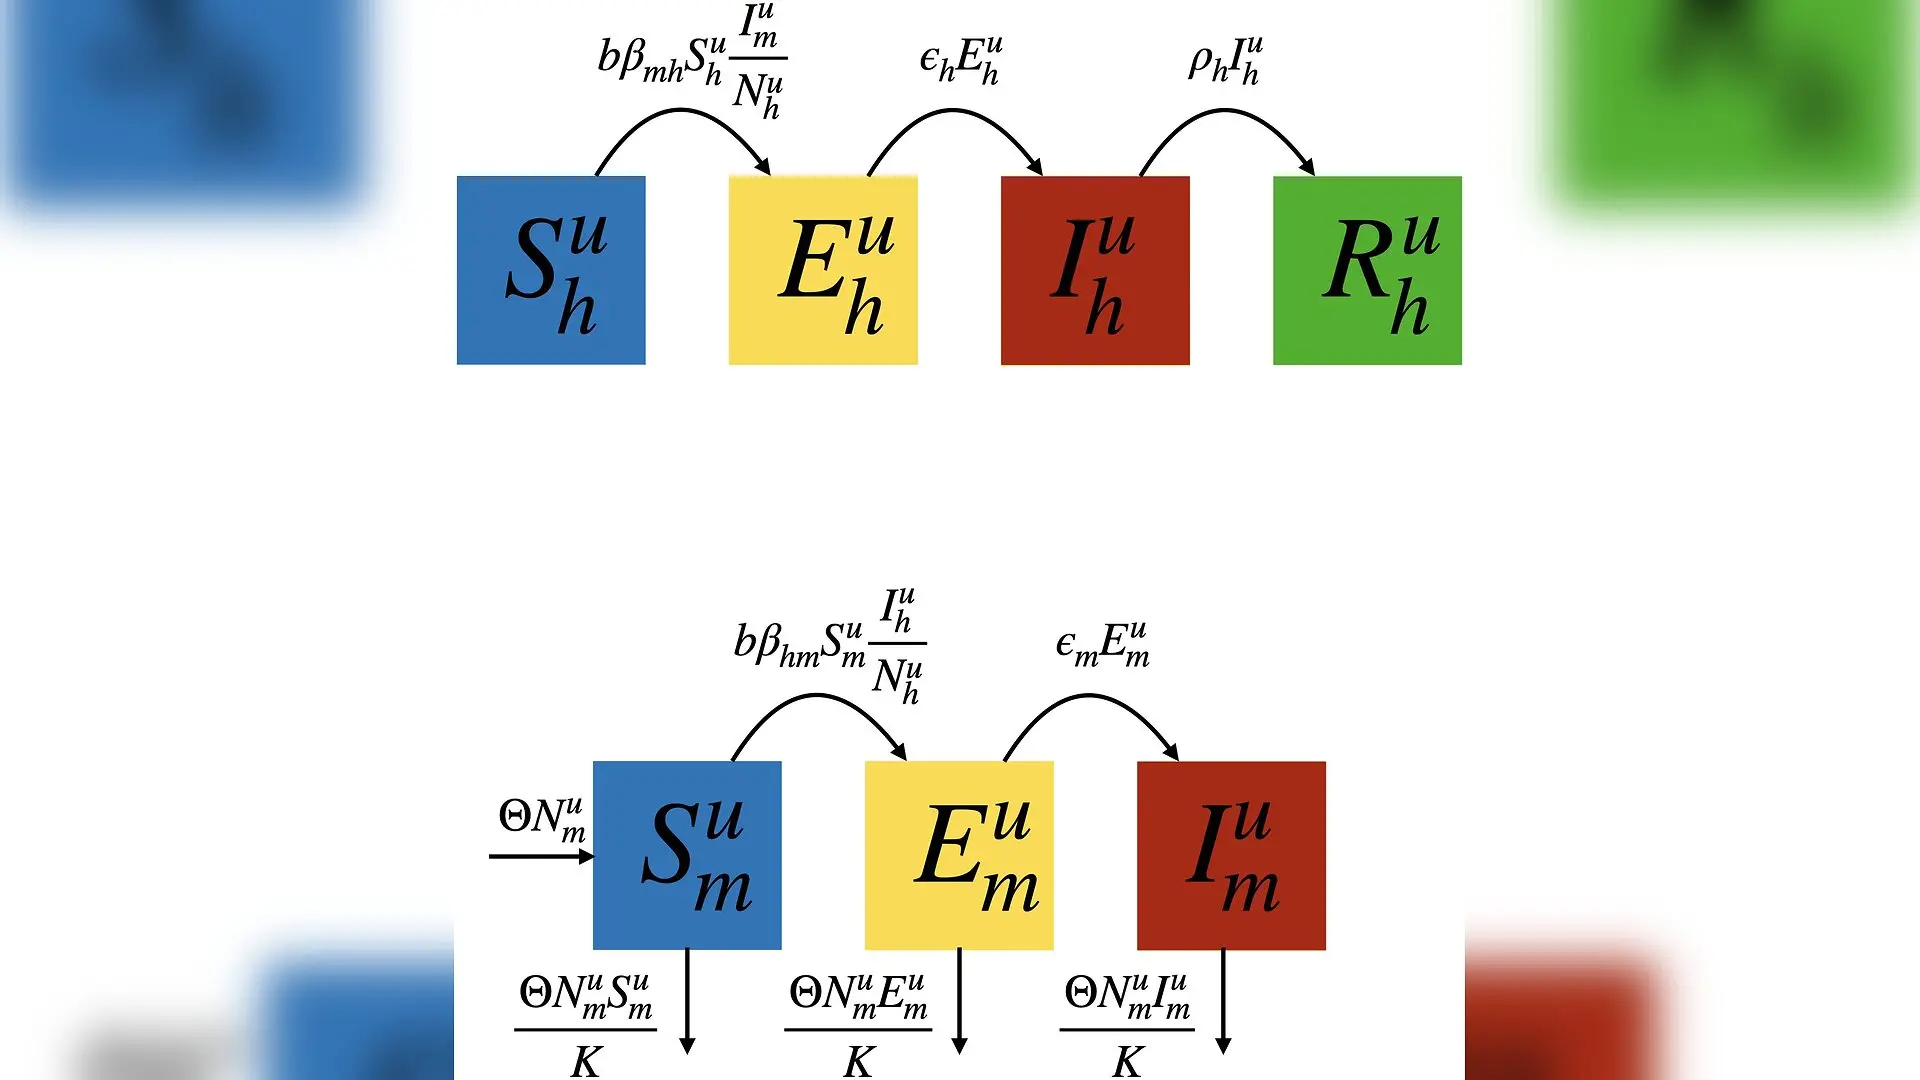
When yellow fever virus spills out of forest ecosystems and edges toward densely populated South American cities, the unpredictable timing and scale of outbreaks can catch public health officials off guard. Urban areas face a constant threat of re-emergence because the virus jumps between forested wildlife cycles and human-dominated spaces through complex networks of hosts and mosquitoes. Understanding which ecological factors actually drive these transmission waves has long challenged epidemiologists, largely because early-stage outbreaks involve tiny numbers of infected individuals that introduce massive statistical randomness into computer forecasts.
To untangle these hidden drivers, researchers recently developed advanced computational techniques to analyze complex disease models without getting overwhelmed by mathematical noise. The findings were published in PLOS Computational Biology by Nate Kornetzke and Helen J. Wearing from the University of New Mexico. Their work demonstrates how a statistical method known as global sensitivity analysis can isolate the true biological sources of variation from the random noise generated by computer simulation solvers.
How Randomness Masked the True Drivers of Disease Spread
When tracking emerging pathogens, scientists typically rely on stochastic models, which incorporate mathematical randomness to capture the unpredictable nature of initial infections. Running these simulations thousands of times introduces an extra layer of statistical uncertainty known as solver variance. This noise blurs the results, making it difficult to determine whether swings in disease outcomes stem from real biological changes or merely from simulation quirks. Until recently, filtering out this noise required computational power that made comprehensive sensitivity testing nearly impossible for intricate, multi-patch disease systems.
To overcome this barrier, Kornetzke and Wearing implemented a variance deconvolution estimator, a tool originally designed for physical transport physics. This mathematical filter cleanly separates true model variation from simulation noise. It allowed the team to compute precise global sensitivity metrics, specifically first-order and total-order Sobol indices, for a sprawling yellow fever model featuring 28 distinct parameters across three connected transmission environments.
The Surprising Impact of Primate Reproduction and Movement Rates
The analysis revealed that out of dozens of variables, only a handful of parameter uncertainties actually drive significant shifts in cumulative disease incidence across urban, peri-urban, and sylvatic forest patches. In the forest cycle, where the virus circulates among non-human primates and wild mosquitoes, reproduction rates among animals dictate nearly all the variation in disease burden. Specifically, the birth rate of non-human primates accounts for roughly 99 percent of the output variance in that cycle, confirming that newborn susceptible hosts are essential for keeping the sylvatic cycle alive.
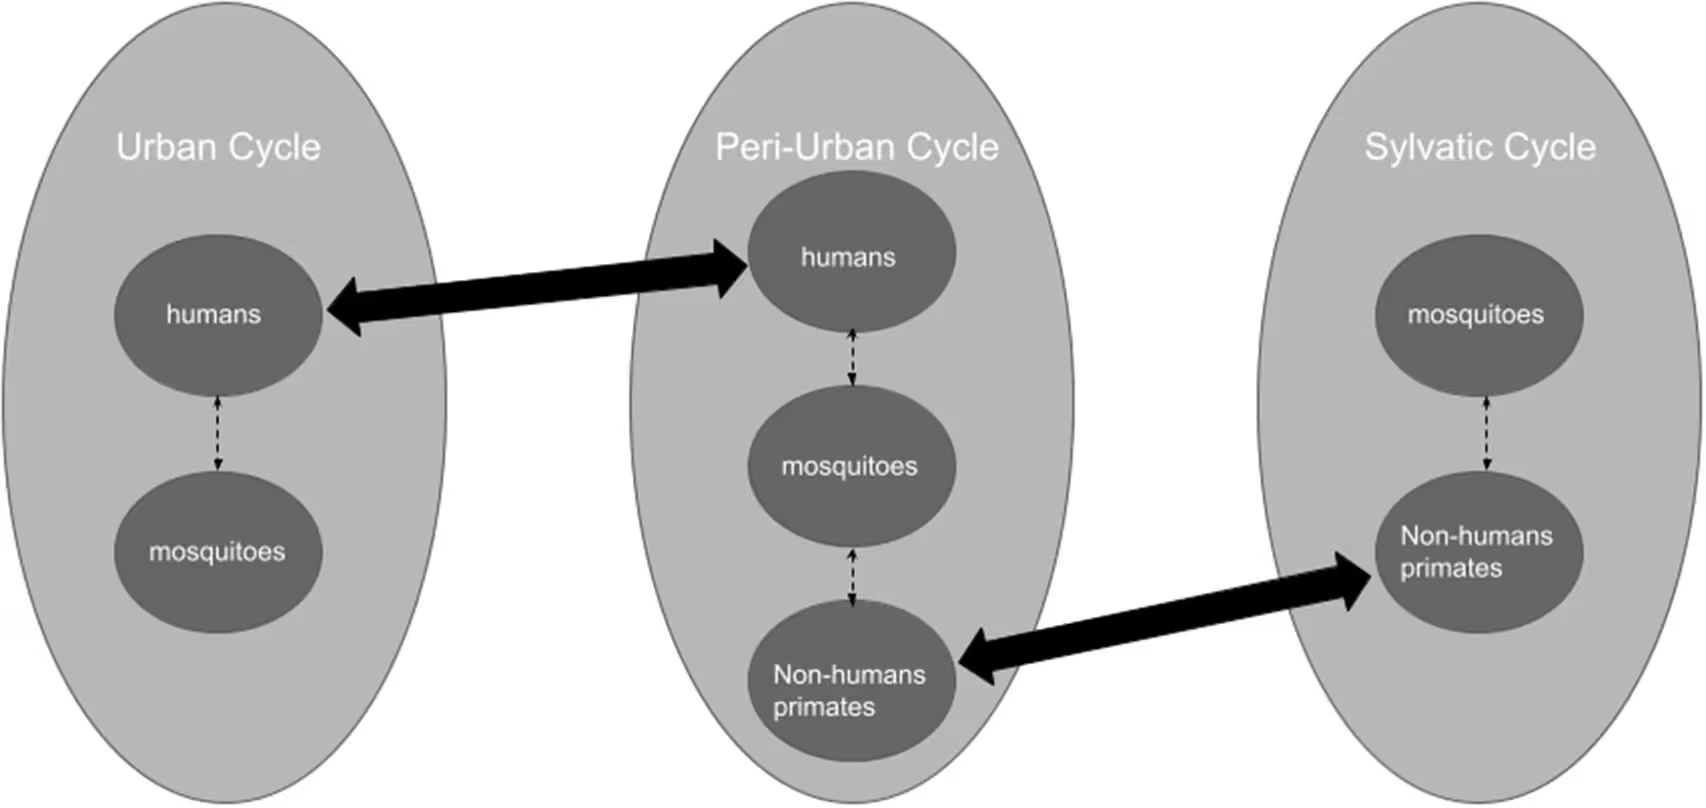
In contrast, disease incidence in urban and peri-urban areas is heavily shaped by higher-order interactions, meaning that individual parameters only cause major changes when they vary alongside other factors. Chief among these are travel rates between ecosystems. Because urban outbreaks cannot start spontaneously without pathogen introduction from the outside, human movement between cities and surrounding rural edges, combined with animal movement across forest boundaries, acts as the primary catalyst for city-level epidemics.
What These Computational Insights Mean for Urban Public Health
The mathematical modeling demonstrates that the peri-urban landscape functions as a critical epidemiological highway connecting remote forest reservoirs with densely populated urban centers. Interestingly, the team discovered that moderate or low connectivity often generates higher urban disease incidence than constant, high-volume commuting. When human movement between urban and peri-urban zones becomes too high, the populations become so tightly coupled that infection dynamics shift, paradoxically reducing the frequency of sustained urban outbreaks in the model framework.
While the study relies on a simplified multi-patch representation rather than real-time tracking of every individual host, it offers a vital roadmap for field researchers. By proving that many entomological variables have a negligible effect on overall epidemic variance, the work suggests that future empirical studies should focus heavily on narrowing uncertainties around landscape connectivity and primate demography rather than spending scarce resources on exhaustively measuring every single mosquito life-history trait.
The research was published in PLOS Computational Biology on November 3, 2026.
This article has been fact checked for accuracy, with information verified against reputable sources. Learn more about us and our editorial process.
Last reviewed on .
Article history
- Latest version
Reference(s)
- Kornetzke, Nate., et al. “Global sensitivity analysis for stochastic models of infectious diseases: Re-emergence of yellow fever virus in the Americas as a case study.” PLOS Computational Biology, vol. 22, no. 11, November 3, 2026, pp. e1013952 Public Library of Science (PLoS), doi: 10.1371/journal.pcbi.1013952. <https://doi.org/10.1371/journal.pcbi.1013952>.
Cite this page:
- Posted by Ali Farooqui