New Open-Source Wizard Pools 117 Personalized Clinical Trials
An interactive web platform combines single-patient trial data to uncover hidden population health trends and treatment responses.
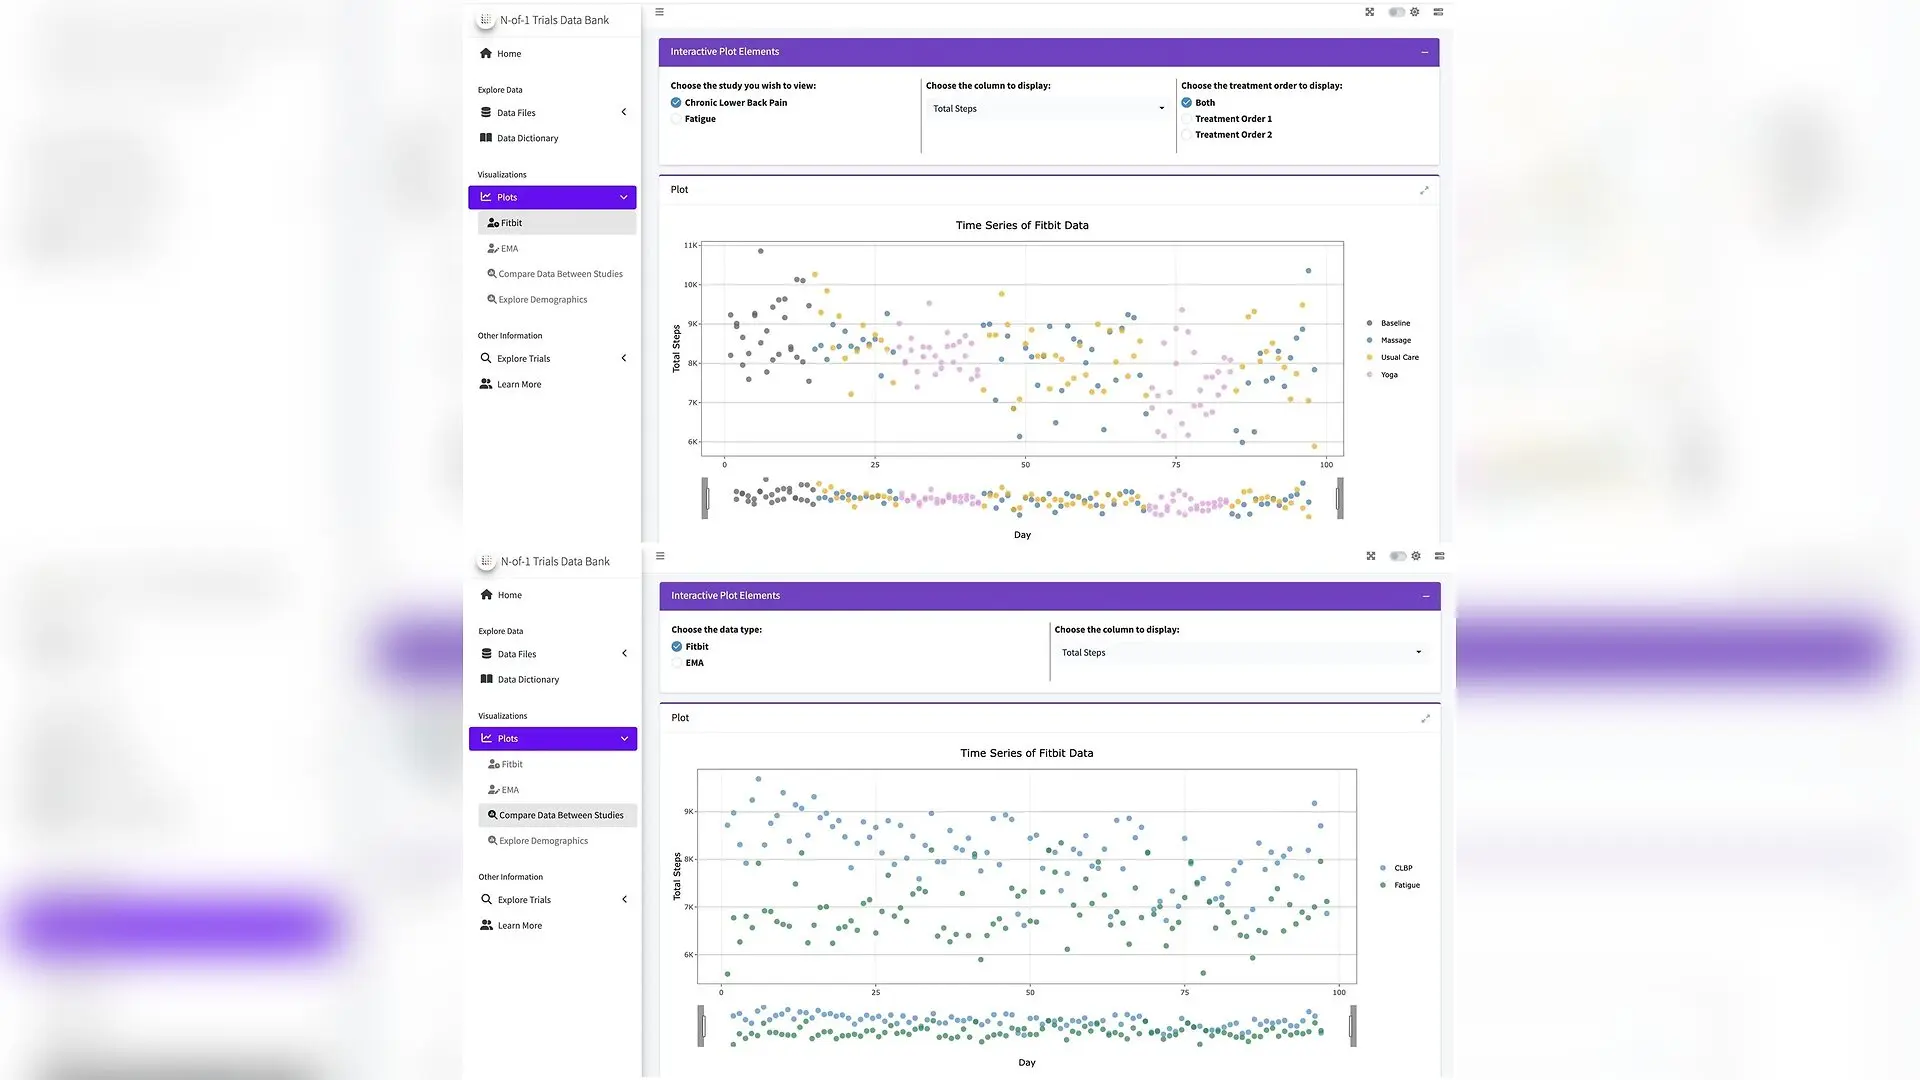
A new open-source platform brings together data from 117 personalized clinical trials, letting scientists explore health trends across large groups of people for the first time. Personalized N-of-1 cross-over trials evaluate treatments within a single patient by rotating through different therapies and control conditions over several weeks. While these single-case studies excel at guiding individual care, their data are rarely examined collectively to understand broader population patterns or treatment responses.
How the Personalized Data Wizard Combines Single-Patient Trials
To bridge this gap, a team of researchers published in JAMIA Open a new web platform named the Personalized N-of-1 Data Wizard. The platform integrates de-identified data from two separate clinical trial series. The first dataset involves 57 individuals managing chronic lower back pain who tried massage, yoga, and usual care. The second dataset features 60 participants experiencing fatigue who tested active versus sham light therapy. Each individual trial spanned 14 weeks, combining a two-week baseline phase with a 12-week intervention period.
Interactive Visualization and Sub-Group Analysis Features
The online tool utilizes the R programming language and the R Shiny web framework alongside dashboard packages to give users deep access to the underlying metrics. Participants in these studies wore Fitbit activity trackers and provided daily updates through text-message ecological momentary assessments, capturing short-term health fluctuations. Users of the Wizard can inspect raw data tables, view longitudinal scatter plots of study measures over time, and examine patient demographics by age, race, ethnicity, self-identified gender, weight, height, and job occupation.
Furthermore, the platform incorporates specialized statistical modeling to handle the unique nature of repeated-measures cross-over data. Because traditional randomized controlled trial methods do not always apply when treatments are delivered sequentially within the same person, the Wizard uses linear mixed models with an autoregressive structure of order one. This mathematical approach accounts for serial autocorrelation, meaning it adjusts for the fact that a patient’s symptom score on a Monday is likely to strongly resemble their score on a Tuesday.

What Pooled Trial Data Reveals About Treatment Responses
By pooling across multiple participants, researchers can estimate population-average treatment effects and evaluate the heterogeneity of treatment effects, which describes how widely treatment effectiveness varies across different people. For instance, initial visualizations and sub-group analyses generated by the Wizard show that while yoga is associated with small reductions in chronic lower back pain relative to usual care across the entire sample, specific demographic groups display distinct point estimates. The platform also allows scientists to spot potential unintended consequences, such as an intervention successfully reducing pain while inadvertently worsening fatigue.
Limitations and Next Steps for the Open-Source Platform
Despite its utility, the current iteration of the Wizard has certain limitations. It does not natively handle multiply imputed datasets, meaning researchers must upload data with pre-processed imputations for missing values or conduct sensitivity analyses to check for bias. Looking ahead, the research group intends to incorporate additional clinical trials, establish automated data harmonization protocols, and conduct formal usability testing using the system usability scale to refine the interface for scientists and clinicians alike.
The research was published in JAMIA open.
This article has been fact checked for accuracy, with information verified against reputable sources. Learn more about us and our editorial process.
Last reviewed on .
Article history
- Latest version
Reference(s)
- Butler, Mark J., et al. “A framework for the aggregation and visualization of personalized N-of-1 trial data: the Personalized N-of-1 Data Wizard.” JAMIA Open, vol. 9, no. 6, November 13, 2026 Oxford University Press (OUP), doi: 10.1093/jamiaopen/ooag217. <https://doi.org/10.1093/jamiaopen/ooag217>.
Cite this page:
- Posted by David Anderson