Gut Dysbiosis Fractures Into Two Distinct States Tied to Inflammation and Transit Speed
Genetics

Gut Dysbiosis Fractures Into Two Distinct States Tied to Inflammation and Transit Speed

Large-scale genetic analysis of 4,500 microbiomes suggests that gut dysbiosis is divided into contrasting inflammatory and slow-transit profiles.
By Elizabeth Taylor
Published:
Email this Article
Gut Dysbiosis Fractures Into Two Distinct States Tied to Inflammation and Transit Speed
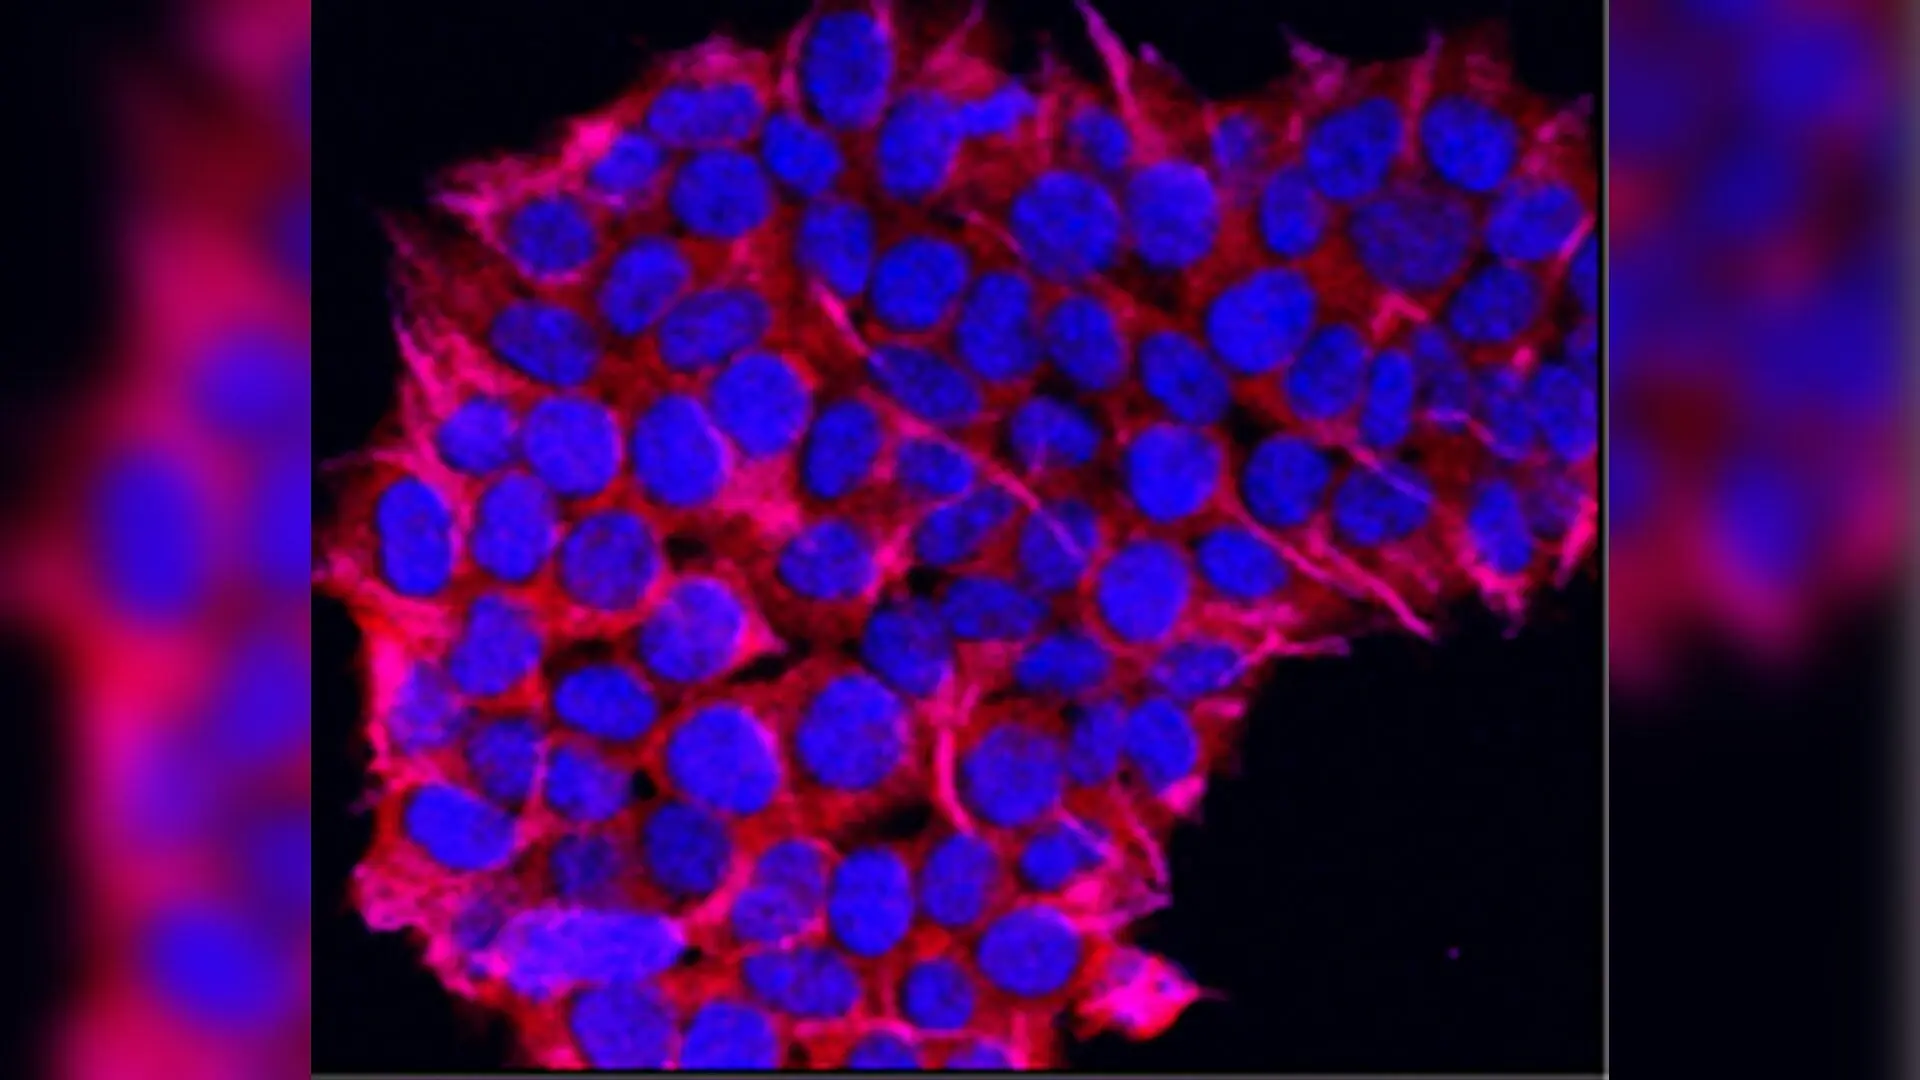
Photo by National Cancer Institute on Unsplash

A sweeping genetic analysis of 4,500 human gut microbiomes reveals that gut dysbiosis, long treated as a single catch-all term for an unbalanced microbiome, actually fractures into at least two distinct biological states linked to gut inflammation and bowel transit speed.

The research, published in eGastroenterology, focused on a specific microbial community profile known as the Bacteroides 2 enterotype, or Bact2. Scientists have long associated this enterotype with low microbial diversity, reduced levels of beneficial bacteria, and chronic inflammation. However, the new work demonstrates that this dysbiotic label masks deep internal variation rather than representing a uniform state across different patients.

How the Human Gut Microbiome Breaks Down Into Different Dysbiosis Profiles

To untangle how gut bacteria vary across health and disease, a team of researchers combined 4,500 faecal microbiome samples from five distinct European cohorts. These groups included healthy volunteers from the Flemish Gut Flora Project alongside patients diagnosed with inflammatory bowel disease, irritable bowel syndrome, multiple sclerosis, and colorectal cancer progression.
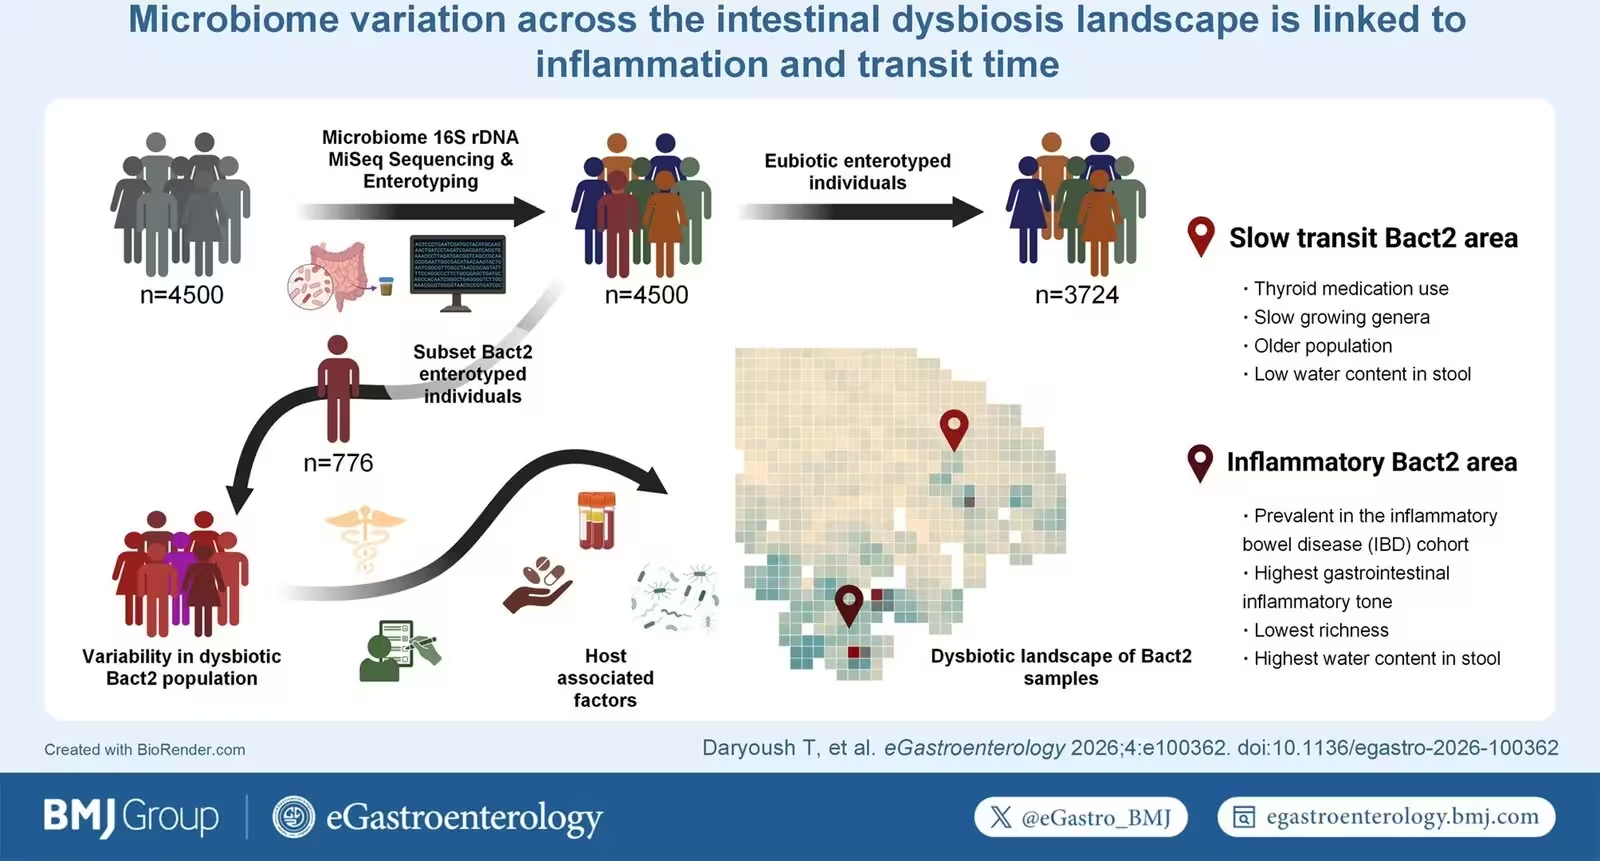
Figure 1: Visual Abstract The graphical abstract was created in BioRender by Daryoush, T. (2025) https://biorender.com/bcfhpae.
Visual Abstract The graphical abstract was created in BioRender by Daryoush, T. (2025) https://biorender.com/bcfhpae. Credit: Tanine Daryoush et al. / eGastroenterology

Using advanced clustering models to examine the 754 samples classified as the Bact2 enterotype, the investigators mapped how microbial composition relates to clinical and physiological markers. Rather than clustering tightly together, the Bact2 samples separated into three distinct regions. Two of these areas displayed clear biological signatures tied to specific host characteristics, while the third overlapped more closely with healthy, eubiotic microbiome configurations.

What Drives the Inflammatory Subtype of Gut Dysbiosis

The first major subgroup identified in the study is an inflammatory area linked heavily with active inflammatory bowel disease, particularly Crohn’s disease. Patients in this group exhibited high levels of faecal calprotectin, a protein marker indicating intestinal inflammation, alongside elevated C-reactive protein in the blood.

Taxonomically, this inflammatory profile showed severe ecological disruption. It featured the lowest microbial richness and diversity across the entire dataset, accompanied by a marked depletion of beneficial commensal bacteria such as Faecalibacterium. At the same time, opportunistic bacterial genera including Pseudocitrobacter, Streptococcus, and Enterocloster expanded significantly. The authors noted that recent antibiotic use also concentrated within this heavily perturbed group.
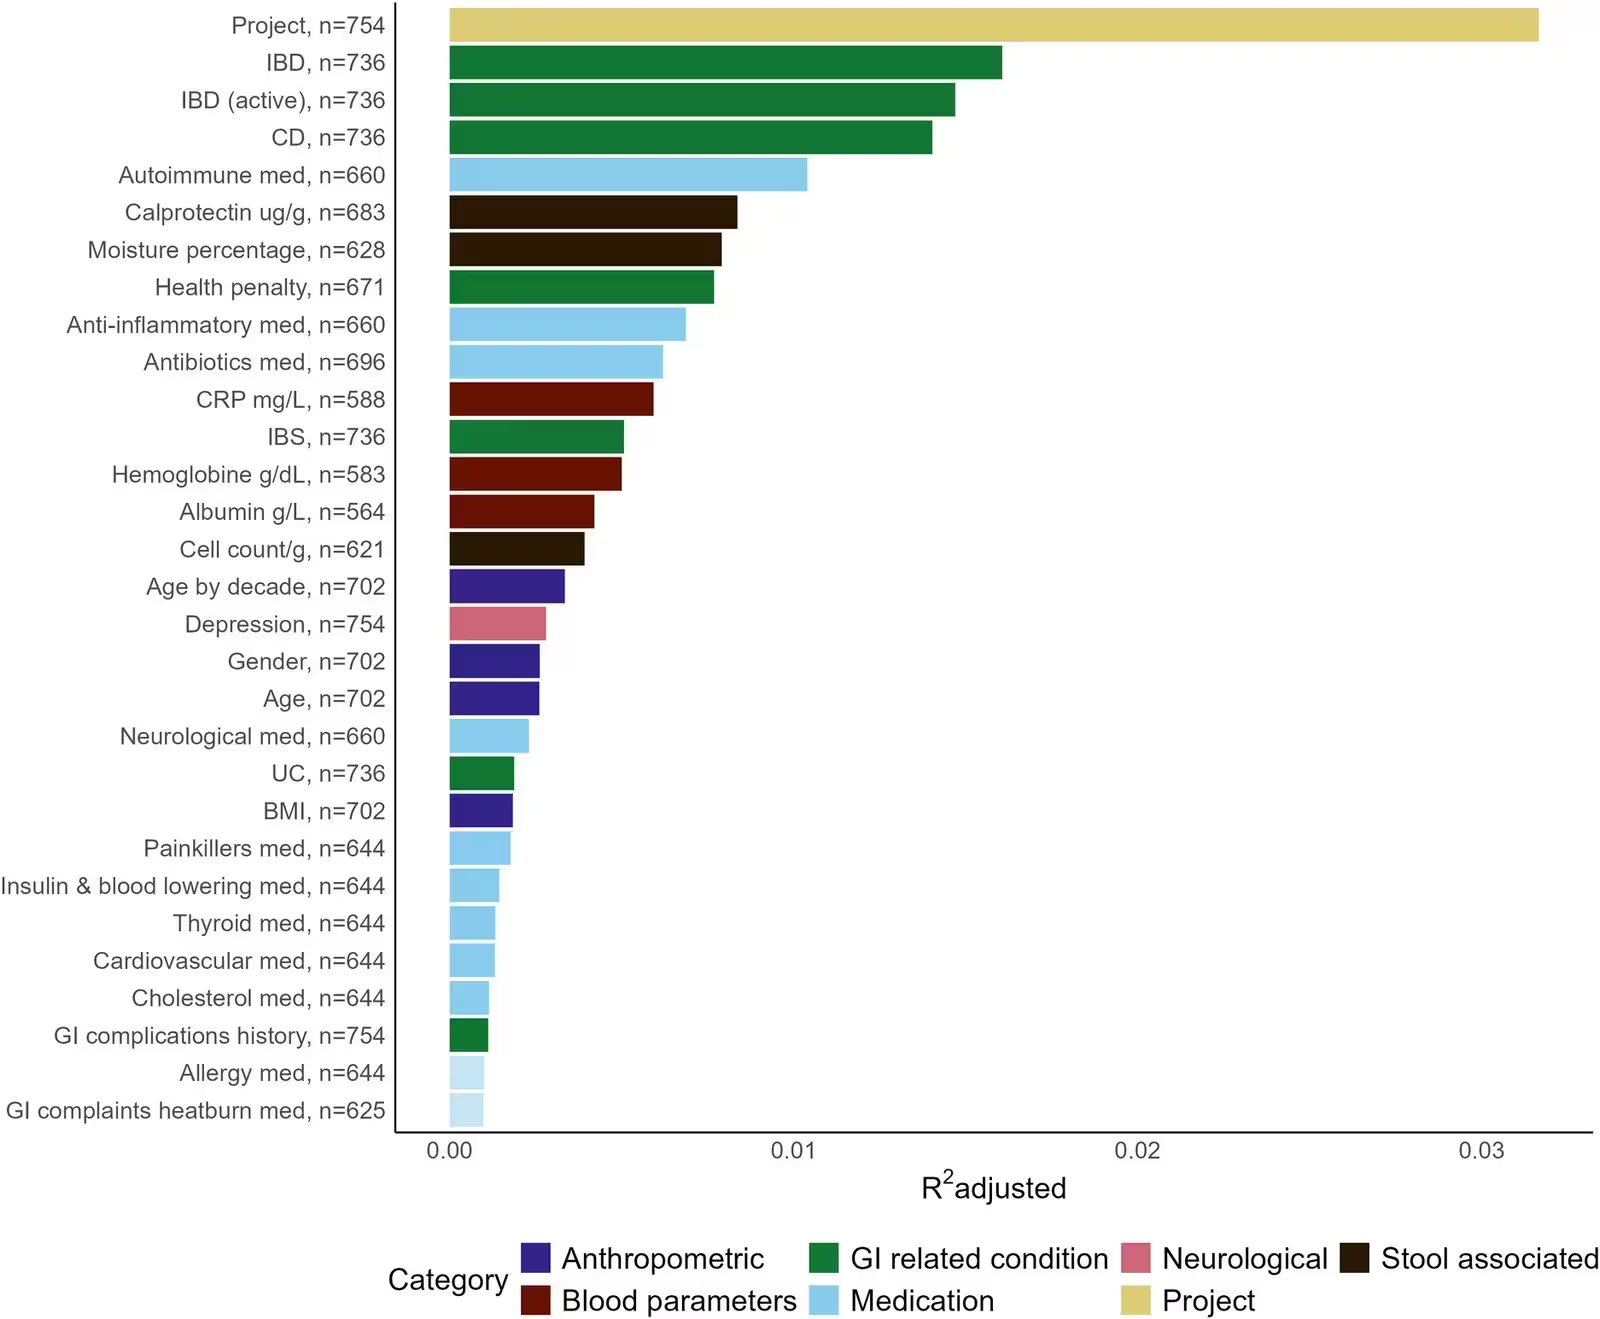
Figure 1: Host and clinical factors associated with compositional variation within Bact2 samples. Distance-based redundancy analysis (dbRDA; “capscale()”) was performed on genus-level, rarefied microbiome profiles from all individuals classified as Bact2 across the five cohorts. Bray-Curtis dissimilarities were used to quantify beta-diversity, and all 96 available host and clinical metadata variables were tested separately using 10 000 permutations. Bars represent the adjusted explained variance (adjusted R²) for the subset of 34 variables that were statistically significant after FDR correction and/or sufficiently represented (≥60% non-missing data) to allow robust interpretation. Each label includes the number of non-missing samples (n), and bar colours denote metadata categories (anthropometric, stool-related, blood parameters, medication, disease-related, dietary, surgical and project). Higher adjusted R² values indicate greater contribution to compositional heterogeneity within Bact2. Bact2
Host and clinical factors associated with compositional variation within Bact2 samples. Distance-based redundancy analysis (dbRDA; “capscale()”) was performed on genus-level, rarefied microbiome profiles from all individuals classified as Bact2 across the five cohorts. Bray-Curtis dissimilarities were used to quantify beta-diversity, and all 96 available host and clinical metadata variables were tested separately using 10 000 permutations. Bars represent the adjusted explained variance (adjusted R²) for the subset of 34 variables that were statistically significant after FDR correction and/or sufficiently represented (≥60% non-missing data) to allow robust interpretation. Each label includes the number of non-missing samples (n), and bar colours denote metadata categories (anthropometric, stool-related, blood parameters, medication, disease-related, dietary, surgical and project). Higher adjusted R² values indicate greater contribution to compositional heterogeneity within Bact2. Bact2 Credit: Tanine Daryoush et al. / eGastroenterology

Why Slow Transit and Constipation Create a Completely Different Bacterial Balance

In contrast, the second major subgroup revealed a surprising twist regarding bowel transit speed. While classic dysbiosis is frequently associated with faster transit and watery stools, this newly defined slow-transit area correlated with low stool moisture below 65 percent and was more common in older adults.

This slow-transit group maintained higher microbial richness than the inflammatory subgroup and showed distinct elevations in slow-growing bacterial genera such as Alistipes, Oscillibacter, and Flavonifractor. Furthermore, individuals taking thyroid medication, which is frequently linked to constipation, were strongly represented in this configuration. Despite these differences, all Bact2 subgroups maintained higher overall dysbiosis scores and lower bacterial loads than healthy eubiotic enterotypes.
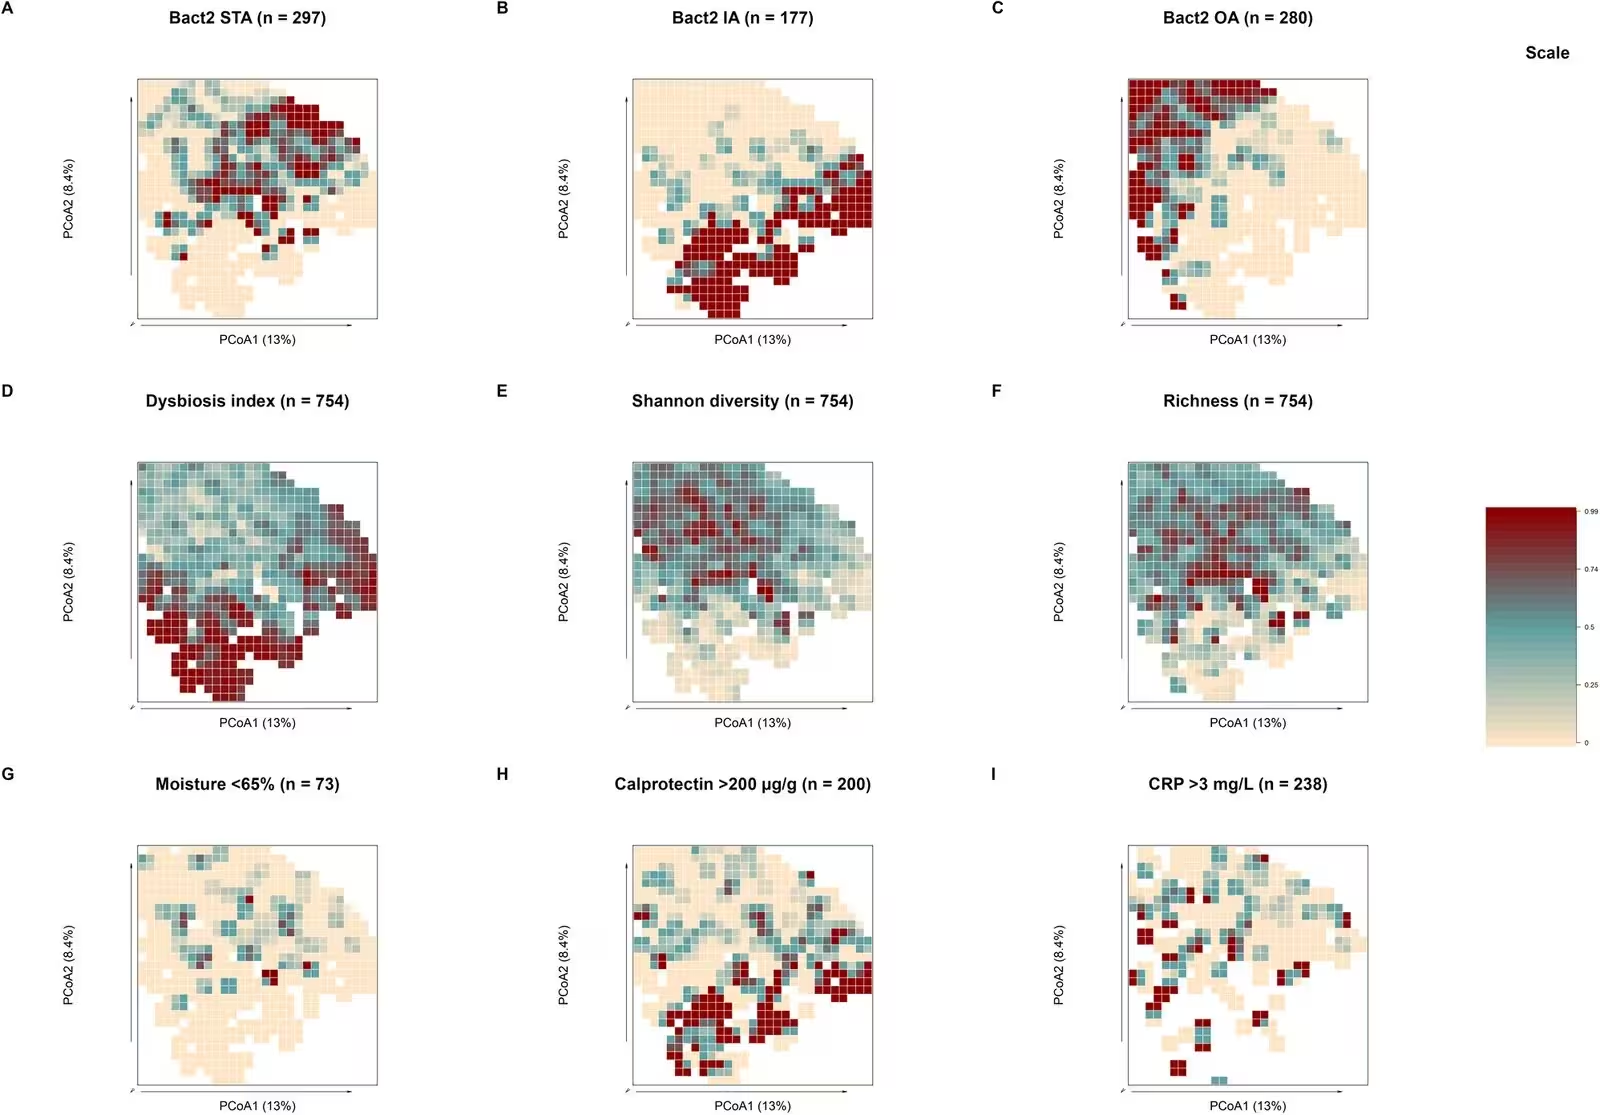
Figure 2: Enteroscapes illustrating Bact2 substructure and associated ecological and host features. Enteroscapes were generated from the first two principal coordinate axes of Bray–Curtis dissimilarities among high-confidence Bact2 samples (n=754). (A–C) Distribution of samples assigned to the STA (n=297), IA (n=177) and OA (n=280), respectively. (D–F) Spatial distribution of the dysbiosis index, Shannon diversity and genus richness, respectively (n=754 for each feature). (G) Distribution of samples with stool moisture <65% (n=73). (H) Distribution of samples with faecal calprotectin >200 µg/g (n=200). (I) Distribution of samples with CRP >3 mg/L (n=238). For continuous variables (D–F), values were rank-transformed to a 0–1 scale prior to visualisation. For categorical variables (A–C and G–I), the enteroscapes represent the relative distribution of samples belonging to the indicated category across the Bact2 landscape. The common colour scale indicates values from 0 to 1, with increasing intensi
Enteroscapes illustrating Bact2 substructure and associated ecological and host features. Enteroscapes were generated from the first two principal coordinate axes of Bray–Curtis dissimilarities among high-confidence Bact2 samples (n=754). (A–C) Distribution of samples assigned to the STA (n=297), IA (n=177) and OA (n=280), respectively. (D–F) Spatial distribution of the dysbiosis index, Shannon diversity and genus richness, respectively (n=754 for each feature). (G) Distribution of samples with stool moisture <65% (n=73). (H) Distribution of samples with faecal calprotectin >200 µg/g (n=200). (I) Distribution of samples with CRP >3 mg/L (n=238). For continuous variables (D–F), values were rank-transformed to a 0–1 scale prior to visualisation. For categorical variables (A–C and G–I), the enteroscapes represent the relative distribution of samples belonging to the indicated category across the Bact2 landscape. The common colour scale indicates values from 0 to 1, with increasing intensi Credit: Tanine Daryoush et al. / eGastroenterology

What These Findings Mean for Future Diagnostics and Therapeutics

The authors point out that these findings highlight why interpreting microbiome data can be challenging when dysbiosis is treated as a blunt instrument. Because different underlying drivers such as chronic inflammation or sluggish bowel transit produce distinct microbial shifts, clinicians may need more granular diagnostic frameworks.

However, the researchers emphasize that because the study relies on cross-sectional observational data, it cannot prove direct cause and effect between specific host factors and bacterial shifts. Future longitudinal studies and standardized clinical trials will be necessary to determine whether these microbial configurations represent stable endpoints or dynamic states along a shared disease trajectory.

The research was published in eGastroenterology on November 13, 2026.

Fact Checked

This article has been fact checked for accuracy, with information verified against reputable sources. Learn more about us and our editorial process.

Last reviewed on .

Article history

  • Latest version

Reference(s)

  1. Daryoush, Tanine., et al. “Microbiome variation across the intestinal dysbiosis landscape is linked to inflammation and transit time.” eGastroenterology, vol. 4, no. 4, November 13, 2026, pp. e100362 BMJ, doi: 10.1136/egastro-2026-100362. <https://doi.org/10.1136/egastro-2026-100362>.

Cite this page:

Taylor, Elizabeth. “Gut Dysbiosis Fractures Into Two Distinct States Tied to Inflammation and Transit Speed.” BioScience. BioScience ISSN 2521-5760, 20 November 2026. <https://www.bioscience.com.pk/en/subject/genetics/microbiome-variation-across-the-intestinal-dysbiosis-landscape-is-linked-to-inflammation-and-transit-time>. Taylor, E. (2026, November 20). “Gut Dysbiosis Fractures Into Two Distinct States Tied to Inflammation and Transit Speed.” BioScience. ISSN 2521-5760. Retrieved November 20, 2026 from https://www.bioscience.com.pk/en/subject/genetics/microbiome-variation-across-the-intestinal-dysbiosis-landscape-is-linked-to-inflammation-and-transit-time Taylor, Elizabeth. “Gut Dysbiosis Fractures Into Two Distinct States Tied to Inflammation and Transit Speed.” BioScience. ISSN 2521-5760. https://www.bioscience.com.pk/en/subject/genetics/microbiome-variation-across-the-intestinal-dysbiosis-landscape-is-linked-to-inflammation-and-transit-time (accessed November 20, 2026).
End of the article