New Mass Spectrometry Method Accurately Detects Preeclampsia
Biotechnology

New Mass Spectrometry Method Accurately Detects Preeclampsia

Advanced metabolic fingerprinting of blood and tissue samples yields high diagnostic accuracy and uncovers key pathways involved in the pregnancy disorder.“, _comment_field_order: [ ”article_body“, ”abstract“, ”headline“, ”subtitle“, ”meta_description“, ”meta_keywords“, ”tags“, ”publication_name" ],
By Robert Brown
Published:
Email this Article
New Mass Spectrometry Method Accurately Detects Preeclampsia
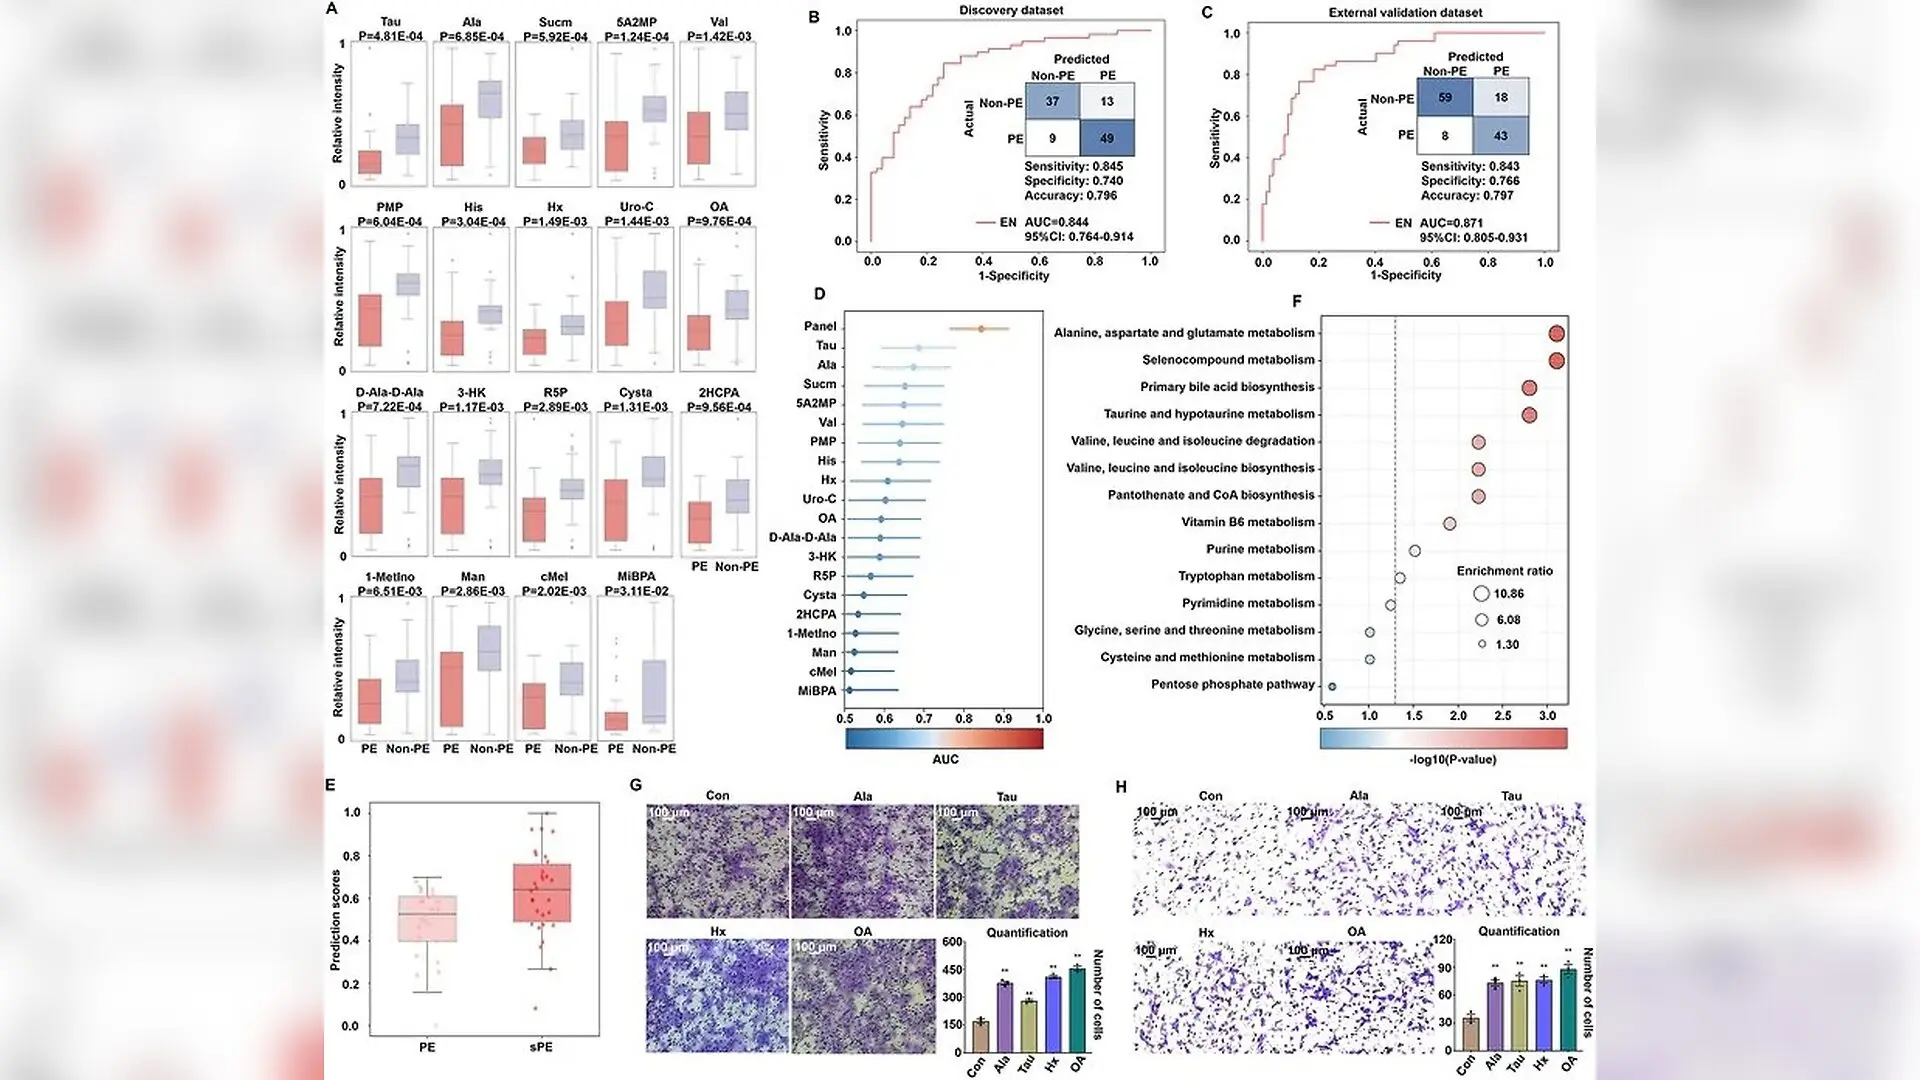
Annotation of metabolic biomarker panel and pathway analysis. (A) The differential expression of 19 metabolites, including taurine (Tau), L‐alanine (Ala), succinimide (Sucm), 5‐amino‐2‐methoxyphenol (5A2MP), L‐valine (Val), pyridoxamine 5'‐phosphate (PMP), histidine (His), hypoxanthine (Hx), urolithin C (Uro‐C), orotic acid (OA), D‐alanyl‐D‐alanine (D‐Ala‐D‐Ala), L‐3‐hydroxykynurenine (3‐HK), d‐ribose 5‐phosphate (R5P), L‐cystathionine (Cysta), 2‐hydroxychlorpropamide (2HCPA), 1‐methylinosine (1‐MetIno), mannitol (Man), cyclic melatonin (cMel), and monoisobutyl phthalic acid (MiBPA), in preeclampsia (PE) patients (pink) and non‐PE participants (purple), and p values were marked. ROC curves and confusion matrices of EN model based on the constructed metabolic panel in (B) discovery and (C) external validation dataset. (D) Enhanced AUC of the metabolic biomarker panel compared with individual biomarkers (p < 0.05, by DeLong test). (E) The box plot indicated different prediction scores gi Yetao Xu et al. / MedComm

A new blood and tissue screening method detects signs of preeclampsia with high accuracy by analyzing small-molecule chemical signatures. Preeclampsia is a dangerous pregnancy-specific condition marked by high blood pressure and organ dysfunction that affects up to 8% of pregnancies globally. Traditional clinical diagnostics rely on tracking blood pressure and measuring urine protein, which can be prone to human error and variable test sensitivity.

To address these diagnostic challenges, researchers turned to metabolomics, which is the study of downstream chemical byproducts created by cellular processes. The team applied nanoparticle-enhanced laser desorption and ionization mass spectrometry, a technique that uses specialized ferric nanoparticles to rapidly extract and measure small molecules from biological samples. This method allows high-throughput analysis at a speed of two seconds per sample, overcoming the slow preparation times of conventional laboratory assays.

How the Multicenter Study Was Designed

The retrospective study, published in MedComm, evaluated plasma and placental tissue samples from a multicenter cohort comprising 236 participants. The dataset included 109 patients diagnosed with preeclampsia, of whom 60 suffered from severe forms of the condition, alongside 127 non-preeclampsia participants recruited across four clinical centers in China between January 2023 and December 2024.
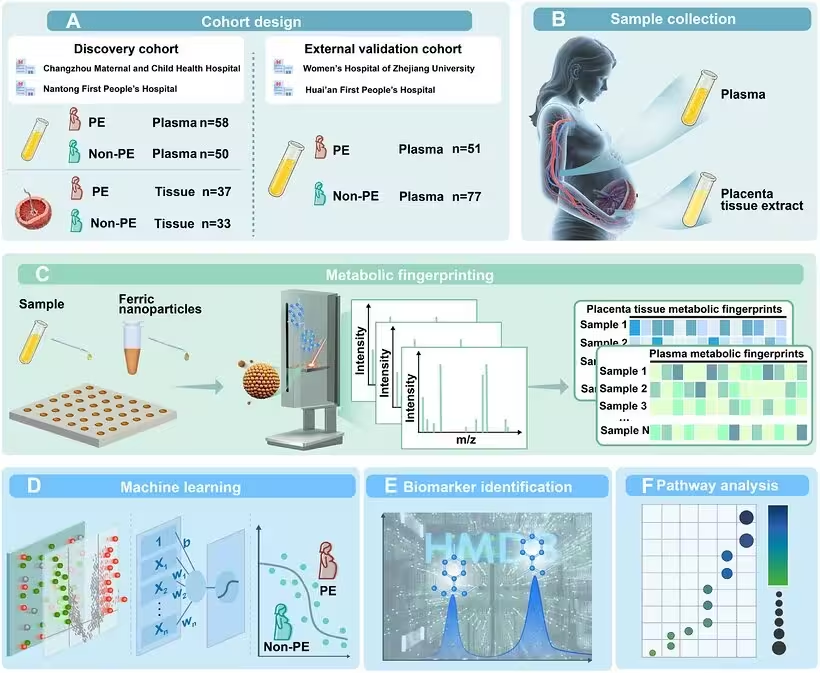
FIGURE 1: Schematic of plasma and placenta metabolic fingerprinting for preeclampsia (PE) diagnosis. (A)  Study design including a discovery dataset and an external validation dataset. (B) Plasma and placental tissue sample collection. (C) Metabolic fingerprinting workflow involves sample preparation and ferric nanoparticle deposition on microarray substrates, acquisition of raw mass spectrometric data, and generation of plasma and placenta metabolic fingerprints through data preprocessing. (D) Feature selection was conducted on metabolic fingerprinting datasets, and predictive models were developed based on machine learning approaches. (E) Biomarker annotation was conducted through Fourier transform ion cyclotron resonance mass spectrometry (FTICR‐MS) analysis, and metabolite annotation was performed based on Human Metabolome Database (HMDB) dataset. (F) PE‐associated metabolic pathways were revealed through quantitative enrichment analysis.
Schematic of plasma and placenta metabolic fingerprinting for preeclampsia (PE) diagnosis. (A)  Study design including a discovery dataset and an external validation dataset. (B) Plasma and placental tissue sample collection. (C) Metabolic fingerprinting workflow involves sample preparation and ferric nanoparticle deposition on microarray substrates, acquisition of raw mass spectrometric data, and generation of plasma and placenta metabolic fingerprints through data preprocessing. (D) Feature selection was conducted on metabolic fingerprinting datasets, and predictive models were developed based on machine learning approaches. (E) Biomarker annotation was conducted through Fourier transform ion cyclotron resonance mass spectrometry (FTICR‐MS) analysis, and metabolite annotation was performed based on Human Metabolome Database (HMDB) dataset. (F) PE‐associated metabolic pathways were revealed through quantitative enrichment analysis. Credit: Yetao Xu et al. / MedComm

By capturing metabolic fingerprints from 236 plasma and 70 placental tissue samples, the scientists generated roughly 130,000 data points per spectrum within a mass range of 80 to 1000 Daltons. Unsupervised clustering algorithms revealed that basic grouping methods were insufficient for clear disease detection, prompting the team to deploy advanced machine learning algorithms including elastic net, lasso regression, and ridge regression.

Performance of the Diagnostic Models

When evaluated using receiver operating characteristic curve analysis, the machine learning models trained on plasma metabolic fingerprints achieved areas under the curve ranging from 0.932 to 0.974 in the discovery dataset. Comparable accuracy emerged in the independent external validation dataset, with areas under the curve reaching between 0.965 and 0.992. By filtering shared signals across both plasma and placental tissues, the researchers narrowed down 22 common features that maintained robust predictive power.

Further analysis annotated a targeted panel of 19 specific metabolites associated with preeclampsia. This biomarker panel achieved an area under the curve of 0.844 in the discovery dataset and 0.871 in the external validation dataset. Furthermore, patients with severe preeclampsia displayed significantly higher prediction scores than those with milder presentations, indicating that the model can differentiate disease severity.
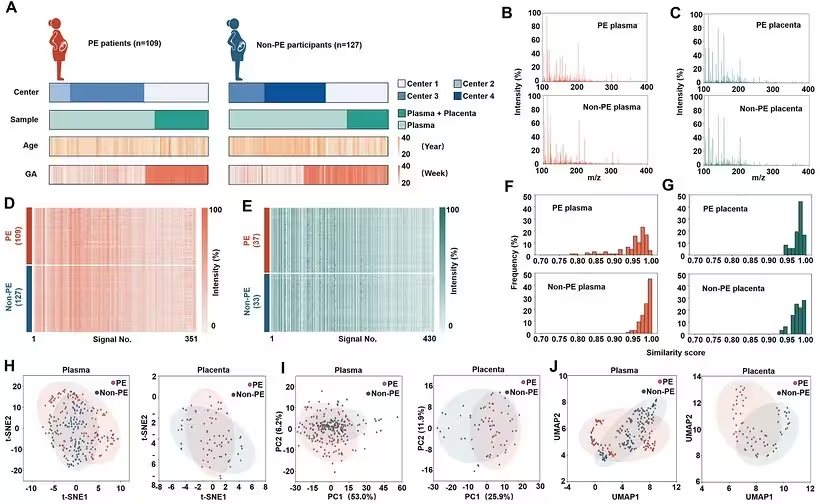
FIGURE 2: Establishment of preeclampsia (PE)‐associated plasma and placenta metabolic fingerprints. (A) The center, sample type, age and gestational age (GA) at sample collection distribution of PE patients (n = 109) and non‐PE participants (n = 127). Centers 1–4 correspond to Nantong First People's Hospital, Changzhou Maternal and Child Health Hospital, Huai'an First People's Hospital, and the Women's Hospital of Zhejiang University, respectively. (B) The mass spectra of PE and non‐PE plasma samples. (C) The mass spectra of PE and non‐PE placental samples. (D) Plasma metabolic fingerprints, including 351 m/z features, and (E) placenta metabolic fingerprints, including 430 m/z features, were extracted from the original MS data. The color scale was logarithmically adjusted. Distribution of similarity scores of (F) plasma and (G) placenta metabolic fingerprints in PE and non‐PE groups, demonstrating all the samples exhibited similarity scores exceeding 0.75. (H) T‐distributed stochastic neighbor e
Establishment of preeclampsia (PE)‐associated plasma and placenta metabolic fingerprints. (A) The center, sample type, age and gestational age (GA) at sample collection distribution of PE patients (n = 109) and non‐PE participants (n = 127). Centers 1–4 correspond to Nantong First People's Hospital, Changzhou Maternal and Child Health Hospital, Huai'an First People's Hospital, and the Women's Hospital of Zhejiang University, respectively. (B) The mass spectra of PE and non‐PE plasma samples. (C) The mass spectra of PE and non‐PE placental samples. (D) Plasma metabolic fingerprints, including 351 m/z features, and (E) placenta metabolic fingerprints, including 430 m/z features, were extracted from the original MS data. The color scale was logarithmically adjusted. Distribution of similarity scores of (F) plasma and (G) placenta metabolic fingerprints in PE and non‐PE groups, demonstrating all the samples exhibited similarity scores exceeding 0.75. (H) T‐distributed stochastic neighbor e Credit: Yetao Xu et al. / MedComm

What Specific Metabolic Pathways Were Discovered

Quantitative enrichment analysis identified ten dysregulated metabolic pathways linked to preeclampsia. These included alanine, aspartate, and glutamate metabolism, taurine and hypotaurine metabolism, valine degradation and biosynthesis, and vitamin B6 metabolism. The widespread metabolic alterations point to systemic shifts during pregnancy adaptation.

To validate the biological role of these molecules, the authors tested four metabolites that showed concordant downregulation in both plasma and placental tissues, namely L-alanine, taurine, hypoxanthine, and orotic acid. Cell-line experiments using Transwell assays demonstrated that treatment with these key metabolites significantly enhanced the migration capabilities of extravillous trophoblast cells, which are specialized cells essential for proper placental development.
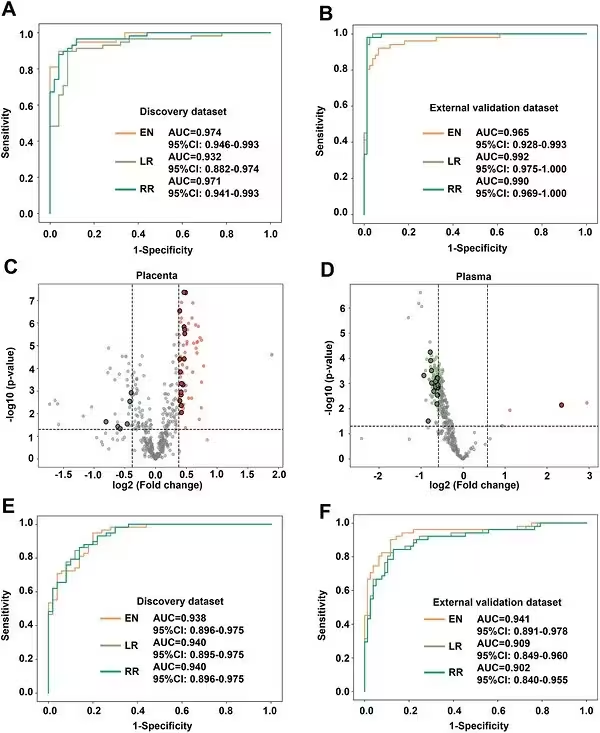
FIGURE 3: Construction of machine learning models for preeclampsia (PE) diagnosis based on plasma metabolic fingerprints. The receiver‐operating characteristic (ROC) curves generated by elastic net (EN), lasso regression (LR), and ridge regression (RR) based on plasma metabolic fingerprints with areas under the curve (AUC) of (A) 0.932‐0.974 in the discovery dataset and (B) 0.965–0.992 in the external validation dataset. Volcano plot for (C) placental and (D) plasma signals with fold‐change thresholds (|log2(FC)| of 0.58 in plasma and 0.38 in placental tissue, vertical dashed lines) and p value thresholds (p = 0.05 by Student's t test, horizontal dashed line), filtering 22 common signals between plasma and placenta metabolic fingerprints. The ROC curves generated by EN, LR, and RR based on 22 selected features, with AUC of (E) 0.938–0.940 in the discovery dataset and (F) 0.902–0.941 in the external validation dataset.
Construction of machine learning models for preeclampsia (PE) diagnosis based on plasma metabolic fingerprints. The receiver‐operating characteristic (ROC) curves generated by elastic net (EN), lasso regression (LR), and ridge regression (RR) based on plasma metabolic fingerprints with areas under the curve (AUC) of (A) 0.932‐0.974 in the discovery dataset and (B) 0.965–0.992 in the external validation dataset. Volcano plot for (C) placental and (D) plasma signals with fold‐change thresholds (|log2(FC)| of 0.58 in plasma and 0.38 in placental tissue, vertical dashed lines) and p value thresholds (p = 0.05 by Student's t test, horizontal dashed line), filtering 22 common signals between plasma and placenta metabolic fingerprints. The ROC curves generated by EN, LR, and RR based on 22 selected features, with AUC of (E) 0.938–0.940 in the discovery dataset and (F) 0.902–0.941 in the external validation dataset. Credit: Yetao Xu et al. / MedComm

What Are the Limitations of the Current Findings

Despite the high diagnostic performance, the authors note several limitations that must be addressed before clinical adoption. The underlying biological mechanisms driving these metabolic shifts require further clarification. In addition, the predictive value of these biomarkers needs to be evaluated during earlier gestational stages through prospective longitudinal studies.

Future work will also require inter-laboratory standardization, automated data processing pipelines, and formal health economics evaluations to establish cost-effectiveness. Until those prospective validations are completed, routine clinical implementation remains on the horizon rather than immediately available.

The research was published in MedComm on November 1, 2026.

Fact Checked

This article has been fact checked for accuracy, with information verified against reputable sources. Learn more about us and our editorial process.

Last reviewed on .

Article history

  • Latest version

Reference(s)

  1. Xu, Yetao., et al. “Efficient Plasma and Placenta Metabolic Fingerprints for Preeclampsia Diagnosis: A Multicenter Study.” MedComm, vol. 7, no. 11, November 8, 2026 Wiley, doi: 10.1002/mco2.71139. <https://doi.org/10.1002/mco2.71139>.

Cite this page:

Brown, Robert. “New Mass Spectrometry Method Accurately Detects Preeclampsia.” BioScience. BioScience ISSN 2521-5760, 11 November 2026. <https://www.bioscience.com.pk/en/subject/biotechnology/efficient-plasma-and-placenta-metabolic-fingerprints-for-preeclampsia-diagnosis-a-multicenter-study>. Brown, R. (2026, November 11). “New Mass Spectrometry Method Accurately Detects Preeclampsia.” BioScience. ISSN 2521-5760. Retrieved November 11, 2026 from https://www.bioscience.com.pk/en/subject/biotechnology/efficient-plasma-and-placenta-metabolic-fingerprints-for-preeclampsia-diagnosis-a-multicenter-study Brown, Robert. “New Mass Spectrometry Method Accurately Detects Preeclampsia.” BioScience. ISSN 2521-5760. https://www.bioscience.com.pk/en/subject/biotechnology/efficient-plasma-and-placenta-metabolic-fingerprints-for-preeclampsia-diagnosis-a-multicenter-study (accessed November 11, 2026).
End of the article