Mapping Cascading Disasters Reveals Massive Gaps in Global Risk Data
Advanced satellites and open-source mapping help track environmental hazards, but institutional barriers and high costs leave many regions vulnerable.
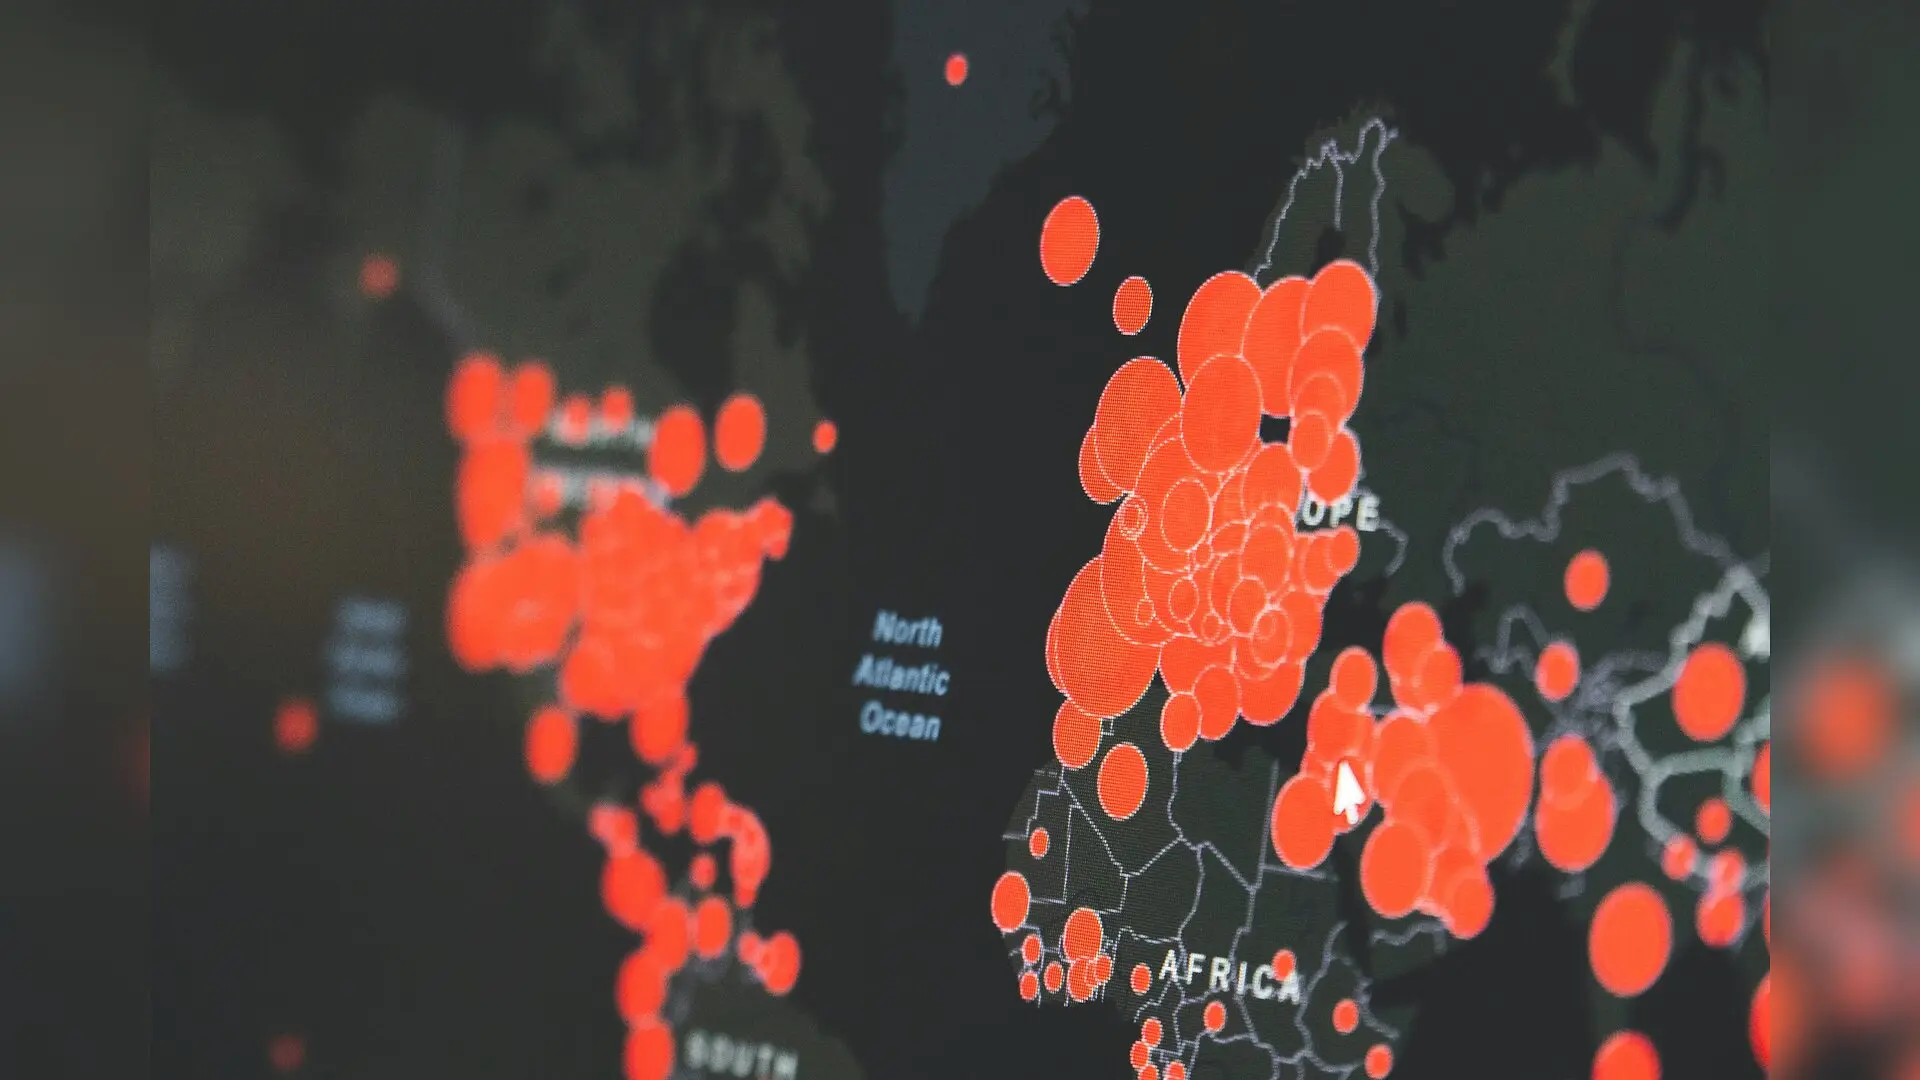
When compounding natural disasters strike, predicting their cascading effects relies entirely on massive streams of precise geospatial data. Researchers mapping these vulnerabilities face formidable obstacles because hazard information is often scattered across incompatible regional systems and fragmented government agencies. Without unified measurements of environmental threats and population exposure, emergency responders struggle to anticipate how a single flood or wildfire might trigger secondary infrastructure failures.
How Do Satellites and Sensor Networks Track Cascading Threats?
Modern disaster management depends on an intricate mix of traditional field mapping and advanced technologies that monitor the Earth from orbit. Remote sensing instruments measure reflected sunlight and thermal radiation to detect wildfire heat signatures or map flooded river basins even through thick cloud cover. Meanwhile, ground-based sensor networks, including global seismic stations and stream gauges, feed continuous readings into centralized forecasting models. Experts reviewing these techniques in a chapter published in Geospatial Innovations in Disaster Management point out that satellites have drastically improved temporal resolution, allowing systems to revisit the same coordinate repeatedly within hours or days.
To turn raw observations into actionable warnings, analysts rely on digital elevation models created through laser scanning from aircraft, known as LiDAR. These elevation datasets achieve centimeter-level accuracy, which is essential for running reliable flood simulations and determining which residential neighborhoods sit in harm’s way. Combining this topography with population grids, such as WorldPop and the Global Human Settlement Layer, reveals exactly how many people live within hazard zones. However, processing these massive spatial files requires specialized geographic information system software and considerable computing power.
Why Is Standardizing Risk Data Across Borders So Difficult?
Significant disparities persist in data availability between wealthy industrialized nations and resource-limited regions. While Europe has implemented structured frameworks like INSPIRE to harmonize thirty-four environmental data themes across borders, many other parts of the world lack basic vulnerability statistics. Institutional fragmentation further worsens these gaps, as local municipalities, national weather services, and international bodies often operate in isolated silos without clear data-sharing agreements.
Financial constraints also prevent smaller nations from acquiring high-resolution satellite imagery or maintaining up-to-date cadastral databases. Privacy laws and intellectual property restrictions frequently lock away critical infrastructure details that could otherwise improve community resilience. When institutional barriers prevent agencies from sharing information, regional disaster response plans suffer from blind spots.
Can Open-Source Mapping and Artificial Intelligence Bridge the Gap?
To overcome high acquisition costs, researchers are increasingly turning to open-source platforms and crowdsourced geographic data. Community-driven mapping projects like OpenStreetMap allow local volunteers to digitize building footprints and road networks in remote areas where official surveys are missing. Artificial intelligence algorithms applied to public satellite archives can also automatically extract building outlines on a global scale.
Public-private partnerships and international frameworks, such as the United Nations Integrated Geospatial Information Framework, offer flexible pathways for countries to strengthen their data maturity. By lowering technical barriers and prioritizing open-source solutions, these initiatives help developing regions build local capacity for multi-hazard risk assessment. Ultimately, bridging the data divide remains a fundamental prerequisite for safeguarding vulnerable populations against future climate extremes.
The research was published in Geospatial Innovations in Disaster Management on January 1, 2027.
This article has been fact checked for accuracy, with information verified against reputable sources. Learn more about us and our editorial process.
Last reviewed on .
Article history
- Latest version
Reference(s)
- van Westen, Cees J.., et al. “Spatial Data for Multi-hazard Risk Assessment.” Civil Protection, Disaster Management, and Resilience, October 26, 2026, pp. 1-17. Springer Nature Switzerland, doi: 10.1007/978-3-032-11832-5_1. <https://doi.org/10.1007/978-3-032-11832-5_1>.
Cite this page:
- Posted by Omar Mirza